Load Balancing Jobs with Hybrid/Remote/WFH Options

Load Balancing
UK > Work from Home

The table below provides summary statistics for permanent remote or hybrid work requiring Load Balancing skills. It includes a benchmarking guide to the annual salaries offered in vacancies that cited Load Balancing over the 6 months leading up to 2 May 2025, comparing them to the same period in the previous two years.

6 months to
2 May 2025
Same period 2024 Same period 2023
Rank 375 438 507
Rank change year-on-year +63 +69 -15
Permanent jobs citing Load Balancing 38 151 167
As % of all permanent jobs with a WFH option 0.25% 0.45% 0.39%
As % of the Processes & Methodologies category 0.27% 0.49% 0.41%
Number of salaries quoted 29 86 113
10th Percentile £43,750 £45,000 £41,250
25th Percentile £44,000 £52,500 £52,500
Median annual salary (50th Percentile) £60,000 £62,500 £60,000
Median % change year-on-year -4.00% +4.17% -7.69%
75th Percentile £70,000 £80,000 £87,500
90th Percentile £75,500 £100,000 £91,250
UK median annual salary £61,250 £60,000 £57,500
% change year-on-year +2.08% +4.35% -8.00%

All Process and Methodology Skills
Work from Home

Load Balancing falls under the Processes and Methodologies category. For comparison with the information above, the following table provides summary statistics for all permanent job vacancies with remote or hybrid options requiring process or methodology skills.

Permanent vacancies with a requirement for process or methodology skills 13,938 31,020 41,026
As % of all permanent jobs with a WFH option 93.13% 91.65% 96.09%
Number of salaries quoted 9,733 23,575 28,496
10th Percentile £30,000 £33,800 £37,500
25th Percentile £45,000 £42,500 £47,500
Median annual salary (50th Percentile) £60,000 £57,500 £62,500
Median % change year-on-year +4.35% -8.00% +4.17%
75th Percentile £77,500 £75,000 £82,500
90th Percentile £102,500 £95,000 £100,000
UK median annual salary £57,500 £55,000 £61,500
% change year-on-year +4.55% -10.57% +2.50%

Load Balancing
Trend for Jobs with a WFH Option

Job vacancies with remote working options citing Load Balancing as a proportion of all IT jobs advertised.
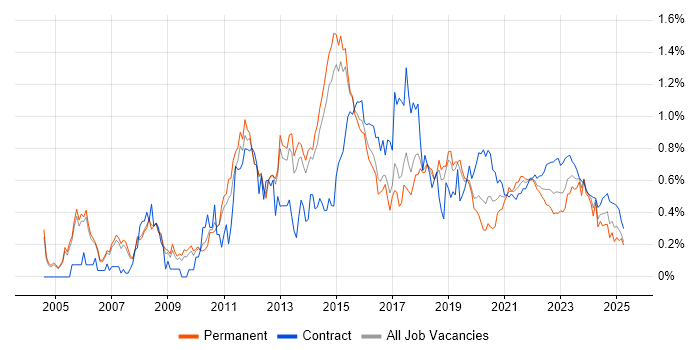
Load Balancing trend for jobs with Hybrid/Remote/WFH options

Load Balancing
Salary Trend for Jobs with a WFH Option

3-month moving average salary quoted in job vacancies with remote working options citing Load Balancing.

Load Balancing salary trend for jobs with a WFH option

Load Balancing
Salary Histogram for Jobs with a WFH Option

Salary distribution for jobs with remote working options citing Load Balancing over the 6 months to 2 May 2025.

Load Balancing salary histogram for jobs with a WFH option

Load Balancing
Co-occurring Skills and Capabilities with WFH Options by Category

The follow tables expand on the table above by listing co-occurrences grouped by category. The same employment type, locality and period is covered with up to 20 co-occurrences shown in each of the following categories:

Application Platforms
1 7 (18.42%) nginx
2 5 (13.16%) Apache
3 3 (7.89%) Microsoft Exchange
3 3 (7.89%) SharePoint
3 3 (7.89%) Tomcat
4 2 (5.26%) Skype for Business
5 1 (2.63%) IIS
Applications
1 1 (2.63%) Microsoft Office
Cloud Services
1 20 (52.63%) Azure
2 15 (39.47%) AWS
3 8 (21.05%) Azure Sentinel
4 5 (13.16%) Entra ID
4 5 (13.16%) Microsoft 365
5 4 (10.53%) Amazon EC2
5 4 (10.53%) Microsoft Purview
5 4 (10.53%) Route 53
6 3 (7.89%) Amazon CloudWatch
6 3 (7.89%) GCP
7 2 (5.26%) Azure Monitor
7 2 (5.26%) SaaS
8 1 (2.63%) Amazon ECS
8 1 (2.63%) Amazon EKS
8 1 (2.63%) AWS Fargate
8 1 (2.63%) Azure ExpressRoute
8 1 (2.63%) Cloud Computing
8 1 (2.63%) Datadog
8 1 (2.63%) PaaS
8 1 (2.63%) Virtual Private Cloud
Communications & Networking
1 29 (76.32%) Firewall
2 20 (52.63%) VPN
3 18 (47.37%) WAN
4 13 (34.21%) SD-WAN
5 9 (23.68%) DNS
5 9 (23.68%) VLAN
6 7 (18.42%) Wireless
7 6 (15.79%) Network Security
7 6 (15.79%) TCP/IP
8 5 (13.16%) IPsec
8 5 (13.16%) LAN
9 4 (10.53%) Cisco ASA
9 4 (10.53%) Cisco Firepower
9 4 (10.53%) Cisco Nexus
9 4 (10.53%) HTTPS
9 4 (10.53%) SAN
9 4 (10.53%) VSAN
9 4 (10.53%) Wi-Fi
10 3 (7.89%) DHCP
10 3 (7.89%) WebEx
Database & Business Intelligence
1 4 (10.53%) SQL Server
2 2 (5.26%) MySQL
3 1 (2.63%) PostgreSQL
3 1 (2.63%) RDBMS
3 1 (2.63%) Relational Database
Development Applications
1 2 (5.26%) Git
2 1 (2.63%) GitLab
General
1 9 (23.68%) Finance
2 6 (15.79%) Analytical Skills
2 6 (15.79%) Inclusion and Diversity
3 5 (13.16%) Social Skills
4 4 (10.53%) Banking
4 4 (10.53%) Local Government
4 4 (10.53%) Manufacturing
4 4 (10.53%) Public Sector
4 4 (10.53%) Retail
5 2 (5.26%) Law
Job Titles
1 11 (28.95%) Infrastructure Engineer
2 10 (26.32%) Senior
3 9 (23.68%) Network Engineer
4 6 (15.79%) Azure Engineer
4 6 (15.79%) Azure Infrastructure Engineer
4 6 (15.79%) Cloud Engineer
5 5 (13.16%) Cloud Infrastructure Engineer
6 4 (10.53%) Architect
6 4 (10.53%) Consultant
6 4 (10.53%) Cybersecurity Engineer
6 4 (10.53%) Infrastructure Consultant
6 4 (10.53%) Network Infrastructure Consultant
6 4 (10.53%) Network Security Engineer
6 4 (10.53%) Security Engineer
6 4 (10.53%) Senior Consultant
6 4 (10.53%) Senior Infrastructure Consultant
6 4 (10.53%) Senior Network Consultant
7 3 (7.89%) Network Architect
7 3 (7.89%) Senior Infrastructure Engineer
8 2 (5.26%) Linux Systems Administrator
Libraries, Frameworks & Software Standards
1 5 (13.16%) Web Services
2 2 (5.26%) .NET
2 2 (5.26%) .NET Framework
2 2 (5.26%) JSON
2 2 (5.26%) LEMP Stack
2 2 (5.26%) Node.js
3 1 (2.63%) Classic ASP
3 1 (2.63%) CSS
3 1 (2.63%) Elastic Stack
3 1 (2.63%) HTML
3 1 (2.63%) Laravel
3 1 (2.63%) RESTful
3 1 (2.63%) SAML
3 1 (2.63%) XML
Miscellaneous
1 11 (28.95%) Self-Motivation
2 6 (15.79%) Data Centre
3 3 (7.89%) Hybrid Cloud
3 3 (7.89%) Management Information System
3 3 (7.89%) Team-Oriented Environment
3 3 (7.89%) Video Conferencing
4 2 (5.26%) Public Cloud
5 1 (2.63%) Cloud Native
5 1 (2.63%) Distributed Applications
5 1 (2.63%) Distributed Denial-of-Service
5 1 (2.63%) Driving Licence
5 1 (2.63%) Greenfield Project
5 1 (2.63%) IoT
5 1 (2.63%) Legacy Code
5 1 (2.63%) Legacy Systems
5 1 (2.63%) Onboarding
Operating Systems
1 26 (68.42%) Windows
2 17 (44.74%) Linux
3 14 (36.84%) Windows Server
4 2 (5.26%) CentOS
4 2 (5.26%) Rocky
4 2 (5.26%) Windows Server 2003
4 2 (5.26%) Windows Server 2019
Processes & Methodologies
1 13 (34.21%) Infrastructure Engineering
2 12 (31.58%) Problem-Solving
3 10 (26.32%) DevOps
4 9 (23.68%) Cybersecurity
5 8 (21.05%) Disaster Recovery
5 8 (21.05%) High Availability
6 7 (18.42%) Coaching
6 7 (18.42%) Collaborative Culture
6 7 (18.42%) Network Monitoring
7 6 (15.79%) Infrastructure Management
7 6 (15.79%) ITIL
7 6 (15.79%) Security Operations
7 6 (15.79%) Service Delivery
7 6 (15.79%) Zero Trust
8 5 (13.16%) Cloud Security
8 5 (13.16%) Cost Management
8 5 (13.16%) Customer Service
8 5 (13.16%) Hardware Maintenance
9 4 (10.53%) Infrastructure as Code
9 4 (10.53%) Proactive Management
Programming Languages
1 8 (21.05%) PowerShell
2 6 (15.79%) SQL
3 4 (10.53%) Python
4 3 (7.89%) Bash
4 3 (7.89%) JavaScript
5 1 (2.63%) C#
5 1 (2.63%) Java
5 1 (2.63%) PHP
5 1 (2.63%) T-SQL
5 1 (2.63%) VB.NET
5 1 (2.63%) VBScript
Qualifications
1 8 (21.05%) Cisco Certification
2 4 (10.53%) AWS Certification
2 4 (10.53%) Azure Certification
2 4 (10.53%) CCNP
2 4 (10.53%) CCSE
2 4 (10.53%) CCSM
2 4 (10.53%) CISSP
2 4 (10.53%) CompTIA Security+
2 4 (10.53%) Microsoft Certification
2 4 (10.53%) Security Cleared
3 3 (7.89%) Degree
4 2 (5.26%) DV Cleared
4 2 (5.26%) SC Cleared
5 1 (2.63%) CCNA
5 1 (2.63%) DBS Check
Quality Assurance & Compliance
1 3 (7.89%) QA
1 3 (7.89%) SLA
System Software
1 15 (39.47%) VMware Infrastructure
2 10 (26.32%) VMware ESXi
3 9 (23.68%) Active Directory
4 4 (10.53%) Virtual Machines
5 3 (7.89%) Hyper-V
5 3 (7.89%) Squid
6 2 (5.26%) Firmware
7 1 (2.63%) BitLocker
7 1 (2.63%) Docker
7 1 (2.63%) VMware Server
7 1 (2.63%) vSphere
Systems Management
1 8 (21.05%) Microsoft Intune
2 4 (10.53%) Ansible
2 4 (10.53%) FortiGate
3 3 (7.89%) HAProxy
3 3 (7.89%) SCCM
3 3 (7.89%) SCOM
4 2 (5.26%) Active Directory Federation Services
4 2 (5.26%) Dell DRAC
4 2 (5.26%) Nagios
4 2 (5.26%) Red Hat Satellite
4 2 (5.26%) SCOrch
4 2 (5.26%) SCSM
4 2 (5.26%) Single Sign-On
4 2 (5.26%) Terraform
5 1 (2.63%) Grafana
5 1 (2.63%) Kubernetes
5 1 (2.63%) Progress Chef
5 1 (2.63%) Prometheus
5 1 (2.63%) Puppet
Vendors
1 16 (42.11%) Microsoft
2 15 (39.47%) VMware
3 13 (34.21%) Cisco
4 6 (15.79%) CheckPoint
4 6 (15.79%) Fortinet
4 6 (15.79%) Palo Alto
5 5 (13.16%) SolarWinds
5 5 (13.16%) Veeam
6 4 (10.53%) Zscaler
7 3 (7.89%) F5
7 3 (7.89%) HP
7 3 (7.89%) Meraki
8 2 (5.26%) Barracuda Networks
8 2 (5.26%) Dell
8 2 (5.26%) Google
8 2 (5.26%) Juniper
8 2 (5.26%) Rapid7
8 2 (5.26%) Red Hat
8 2 (5.26%) Zerto
9 1 (2.63%) LogRhythm