Business Development Jobs in London

Business Development
England > London

The table below provides summary statistics for permanent job vacancies advertised in London requiring Business Development skills. It includes a benchmarking guide to the annual salaries offered in vacancies that cited Business Development over the 6 months leading up to 16 May 2025, comparing them to the same period in the previous two years.

6 months to
16 May 2025
Same period 2024 Same period 2023
Rank 64 104 189
Rank change year-on-year +40 +85 +74
Permanent jobs citing Business Development 559 669 642
As % of all permanent jobs advertised in London 4.34% 2.83% 1.90%
As % of the Processes & Methodologies category 4.51% 3.11% 2.00%
Number of salaries quoted 172 401 302
10th Percentile £38,000 £35,000 £37,563
25th Percentile £42,375 - £51,250
Median annual salary (50th Percentile) £75,000 £40,000 £68,000
Median % change year-on-year +87.50% -41.18% -9.33%
75th Percentile £115,000 £80,000 £83,438
90th Percentile £120,000 £102,500 £104,750
England median annual salary £41,000 £41,500 £60,000
% change year-on-year -1.20% -30.83% -11.11%

All Process and Methodology Skills
London

Business Development falls under the Processes and Methodologies category. For comparison with the information above, the following table provides summary statistics for all permanent job vacancies requiring process or methodology skills in London.

Permanent vacancies with a requirement for process or methodology skills 12,397 21,536 32,168
As % of all permanent jobs advertised in London 96.18% 91.13% 95.37%
Number of salaries quoted 7,220 15,919 23,171
10th Percentile £42,000 £37,500 £43,477
25th Percentile £56,000 £51,532 £55,000
Median annual salary (50th Percentile) £75,000 £70,500 £75,000
Median % change year-on-year +6.38% -6.00% +7.14%
75th Percentile £100,000 £95,000 £95,000
90th Percentile £122,500 £115,000 £115,000
England median annual salary £57,500 £55,000 £62,500
% change year-on-year +4.55% -12.00% +4.17%

Business Development
Job Vacancy Trend in London

Job postings citing Business Development as a proportion of all IT jobs advertised in London.
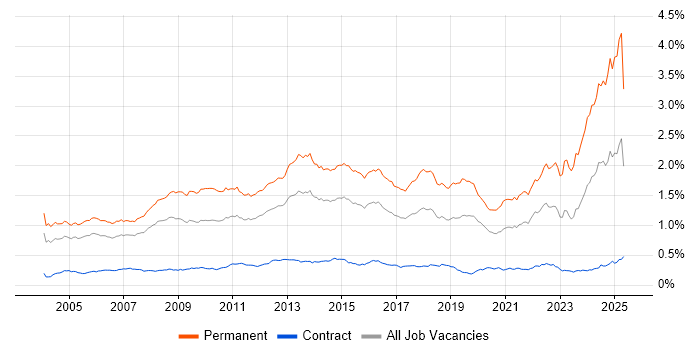
Job vacancy trend for Business Development in London

Business Development
Salary Trend in London

3-month moving average salary quoted in jobs citing Business Development in London.

Salary trend for Business Development in London

Business Development
Salary Histogram in London

Salary distribution for jobs citing Business Development in London over the 6 months to 16 May 2025.

Salary histogram for Business Development in London

Business Development
Job Locations in London

The table below looks at the demand and provides a guide to the median salaries quoted in IT jobs citing Business Development within the London region over the 6 months to 16 May 2025. The 'Rank Change' column provides an indication of the change in demand within each location based on the same 6 month period last year.

Location Rank Change
on Same Period
Last Year
Matching
Permanent
IT Job Ads
Median Salary
Past 6 Months
Median Salary
% Change
on Same Period
Last Year
Live
Jobs
West London +18 49 £40,000 - 15
Central London -15 43 £81,250 +103.13% 73
South London +18 35 £38,000 -5.00% 6
East London -1 29 - - 16
North London -6 2 - - 2
Business Development
England

Business Development
Co-occurring Skills and Capabilities in London by Category

The follow tables expand on the table above by listing co-occurrences grouped by category. The same employment type, locality and period is covered with up to 20 co-occurrences shown in each of the following categories:

Application Platforms
1 8 (1.43%) CMS
2 7 (1.25%) Sitecore CMS
3 5 (0.89%) Microsoft Exchange
3 5 (0.89%) SharePoint
4 1 (0.18%) SAS
Applications
1 60 (10.73%) Microsoft Office
2 23 (4.11%) Microsoft Excel
3 21 (3.76%) Microsoft PowerPoint
4 1 (0.18%) Adobe Creative Suite
4 1 (0.18%) Chatbot
4 1 (0.18%) Stata
Business Applications
1 8 (1.43%) Academy Revenues and Benefits
1 8 (1.43%) Aladdin
2 6 (1.07%) Dynamics CRM
3 5 (0.89%) SAP S/4HANA
4 4 (0.72%) NetSuite
5 2 (0.36%) Oracle ERP
5 2 (0.36%) Oracle Payroll
5 2 (0.36%) SAP SD
6 1 (0.18%) Actimize
6 1 (0.18%) Salesforce CRM
6 1 (0.18%) SAP CO
6 1 (0.18%) SAP FI
6 1 (0.18%) SAP FI/CO
Cloud Services
1 63 (11.27%) Azure
2 62 (11.09%) AWS
3 51 (9.12%) GCP
4 17 (3.04%) SaaS
5 10 (1.79%) Power Platform
6 8 (1.43%) Microsoft 365
7 7 (1.25%) Google Analytics
7 7 (1.25%) Microsoft Copilot
8 6 (1.07%) Cloud Computing
9 5 (0.89%) Azure AI
9 5 (0.89%) Entra ID
10 4 (0.72%) Dynamics 365
11 3 (0.54%) Collibra
11 3 (0.54%) Microsoft Purview
11 3 (0.54%) OCI
11 3 (0.54%) Snowflake
12 2 (0.36%) PowerApps
12 2 (0.36%) Pulumi
13 1 (0.18%) Canva
13 1 (0.18%) Figma
Communications & Networking
1 8 (1.43%) WPA
2 6 (1.07%) Network Security
3 5 (0.89%) Firewall
4 3 (0.54%) VPN
5 2 (0.36%) 5G
5 2 (0.36%) DHCP
5 2 (0.36%) DNS
5 2 (0.36%) Internet
5 2 (0.36%) Unified Communications
5 2 (0.36%) VLAN
5 2 (0.36%) VoIP
6 1 (0.18%) LAN
6 1 (0.18%) MPLS
6 1 (0.18%) SD-WAN
6 1 (0.18%) WAN
Database & Business Intelligence
1 28 (5.01%) Metadata
2 23 (4.11%) Data Lake
3 3 (0.54%) GIS
3 3 (0.54%) Oracle Reports
3 3 (0.54%) Power BI
3 3 (0.54%) Spatial Data
3 3 (0.54%) Tableau
4 2 (0.36%) Electronic Patient Records
5 1 (0.18%) SAP BW
5 1 (0.18%) SAP HANA
Development Applications
1 1 (0.18%) Jenkins
1 1 (0.18%) Team Foundation Server
General
1 327 (58.50%) Social Skills
2 289 (51.70%) Finance
3 201 (35.96%) Marketing
4 80 (14.31%) Public Sector
5 68 (12.16%) Legal
6 65 (11.63%) Inclusion and Diversity
7 63 (11.27%) Analytical Skills
8 58 (10.38%) Banking
9 33 (5.90%) Retail Banking
10 32 (5.72%) Advertising
11 30 (5.37%) Presentation Skills
12 29 (5.19%) Retail
13 25 (4.47%) Financial Institution
14 18 (3.22%) Law
15 17 (3.04%) Local Government
16 12 (2.15%) Publishing
17 11 (1.97%) Telecoms
18 10 (1.79%) Billing
19 6 (1.07%) Influencing Skills
20 5 (0.89%) Organisational Skills
Job Titles
1 193 (34.53%) Business Manager
2 192 (34.35%) Business Development Manager
2 192 (34.35%) Development Manager
3 69 (12.34%) Senior
4 59 (10.55%) Consultant
5 48 (8.59%) Customer Executive
6 47 (8.41%) Architect
7 35 (6.26%) Senior Manager
8 30 (5.37%) Cybersecurity Consultant
8 30 (5.37%) Security Consultant
9 24 (4.29%) Associate Director
10 23 (4.11%) Data Architect
10 23 (4.11%) Managing Consultant
11 21 (3.76%) Solutions Architect
12 19 (3.40%) Senior Architect
13 18 (3.22%) Senior Solutions Architect
14 17 (3.04%) Head of Content
15 14 (2.50%) Head of Production
16 10 (1.79%) Digital Communications Manager
16 10 (1.79%) Recruitment Consultant
Libraries, Frameworks & Software Standards
1 7 (1.25%) Oracle Fusion
2 3 (0.54%) RSS
3 2 (0.36%) Lightning Web Components
4 1 (0.18%) .NET
4 1 (0.18%) AngularJS
4 1 (0.18%) ARM Templates
4 1 (0.18%) EDI
4 1 (0.18%) Elastic Stack
4 1 (0.18%) J2EE
4 1 (0.18%) React
Miscellaneous
1 82 (14.67%) Self-Motivation
2 26 (4.65%) Life Science
3 23 (4.11%) Social Media
4 16 (2.86%) Digital Media
5 14 (2.50%) Blog
6 9 (1.61%) Onboarding
7 8 (1.43%) NHS
8 7 (1.25%) Analytical Mindset
8 7 (1.25%) Data Centre
8 7 (1.25%) Management Information System
9 5 (0.89%) Data Protection Act
9 5 (0.89%) Distributed Computing
9 5 (0.89%) Legacy Systems
9 5 (0.89%) Microsoft Licensing
9 5 (0.89%) Product Ownership
9 5 (0.89%) Security Posture
10 4 (0.72%) Mobile App
10 4 (0.72%) Renewable Energy
11 3 (0.54%) Enterprise Software
11 3 (0.54%) IoT
Operating Systems
1 15 (2.68%) Windows
2 8 (1.43%) Windows Vista
3 2 (0.36%) Windows 10
4 1 (0.18%) Android
4 1 (0.18%) Android TV
Processes & Methodologies
1 143 (25.58%) Decision-Making
2 96 (17.17%) Agile
3 85 (15.21%) Collaborative Culture
4 75 (13.42%) B2B
5 67 (11.99%) Contract Negotiation
6 66 (11.81%) Business Intelligence
6 66 (11.81%) Cybersecurity
7 63 (11.27%) B2B Sales
7 63 (11.27%) Collaborative Working
7 63 (11.27%) Marketing Strategy
8 60 (10.73%) Facilities Management
9 58 (10.38%) Data-Driven Decision Making
10 56 (10.02%) Analytics
10 56 (10.02%) OpenUP
11 53 (9.48%) CRM
12 50 (8.94%) Asset Management
13 49 (8.77%) Project Management
14 45 (8.05%) Data Strategy
15 44 (7.87%) Data Management
16 42 (7.51%) Innovative Thinking
Programming Languages
1 22 (3.94%) R
2 14 (2.50%) Python
3 7 (1.25%) SQL
4 6 (1.07%) C
5 3 (0.54%) PowerShell
6 2 (0.36%) Java
6 2 (0.36%) Ruby
6 2 (0.36%) VBA
7 1 (0.18%) ABAP
7 1 (0.18%) Bash
7 1 (0.18%) C#
7 1 (0.18%) Go
7 1 (0.18%) Groovy
7 1 (0.18%) JavaScript
7 1 (0.18%) MATLAB
Qualifications
1 69 (12.34%) Degree
2 32 (5.72%) CISM
3 29 (5.19%) CISSP
4 25 (4.47%) Azure Certification
5 23 (4.11%) AWS Certification
6 21 (3.76%) Master's Degree
7 11 (1.97%) Security Cleared
8 8 (1.43%) CISA
8 8 (1.43%) DBS Check
9 7 (1.25%) MBA
10 6 (1.07%) (ISC)2 CCSP
10 6 (1.07%) CCSP
10 6 (1.07%) Cisco Certification
11 4 (0.72%) Computer Science Degree
11 4 (0.72%) Microsoft Certification
12 3 (0.54%) CCSK
13 2 (0.36%) CCSAS
13 2 (0.36%) CREST Certified
13 2 (0.36%) ISO 27001 Lead Auditor
13 2 (0.36%) PhD
Quality Assurance & Compliance
1 9 (1.61%) ISO/IEC 27001
1 9 (1.61%) NIST
2 6 (1.07%) IFRS
2 6 (1.07%) IFRS 9
3 5 (0.89%) Cyber Essentials
3 5 (0.89%) Data Quality
3 5 (0.89%) QA
4 3 (0.54%) GDPR
4 3 (0.54%) GRC
4 3 (0.54%) Sarbanes-Oxley
5 2 (0.36%) Accessibility
5 2 (0.36%) ISO/IEC 17025
5 2 (0.36%) ISO/IEC 27002 (supersedes ISO/IEC 17799)
5 2 (0.36%) NCSC
5 2 (0.36%) PCI DSS
5 2 (0.36%) PMO
6 1 (0.18%) Basel III
System Software
1 7 (1.25%) Active Directory
2 2 (0.36%) Docker
Systems Management
1 5 (0.89%) EMC NetWorker
2 2 (0.36%) Kubernetes
2 2 (0.36%) Microsoft Intune
2 2 (0.36%) Prometheus
2 2 (0.36%) Terraform
3 1 (0.18%) Ansible
3 1 (0.18%) Consul
3 1 (0.18%) Packer
3 1 (0.18%) Progress Chef
3 1 (0.18%) Puppet
Vendors
1 72 (12.88%) Salesforce
2 68 (12.16%) Microsoft
3 18 (3.22%) Google
4 13 (2.33%) Oracle
5 11 (1.97%) SAP
6 7 (1.25%) Ahrefs
6 7 (1.25%) HubSpot
6 7 (1.25%) Screaming Frog
6 7 (1.25%) Sitecore
7 6 (1.07%) Charles River
7 6 (1.07%) VMware
8 5 (0.89%) eFront
8 5 (0.89%) ServiceNow
9 4 (0.72%) BT
9 4 (0.72%) Databricks
10 3 (0.54%) Alteryx
10 3 (0.54%) ESRI
10 3 (0.54%) Guidewire
10 3 (0.54%) Informatica
10 3 (0.54%) Workday