Data Security Jobs in the UK excluding London

Data Security
UK > UK excluding London

The table below provides summary statistics for permanent job vacancies advertised in the UK excluding London requiring Data Security skills. It includes a benchmarking guide to the annual salaries offered in vacancies that cited Data Security over the 6 months leading up to 30 May 2025, comparing them to the same period in the previous two years.

6 months to
30 May 2025
Same period 2024 Same period 2023
Rank 343 372 469
Rank change year-on-year +29 +97 -75
Permanent jobs citing Data Security 255 480 305
As % of all permanent jobs advertised in the UK excluding London 0.65% 0.64% 0.53%
As % of the Processes & Methodologies category 0.70% 0.78% 0.55%
Number of salaries quoted 166 296 218
10th Percentile £42,500 £27,625 £26,250
25th Percentile £47,500 £41,500 £30,688
Median annual salary (50th Percentile) £55,000 £57,500 £45,000
Median % change year-on-year -4.35% +27.78% -10.21%
75th Percentile £67,500 £85,000 £62,833
90th Percentile £83,750 £95,000 £72,500
UK median annual salary £65,000 £67,500 £55,250
% change year-on-year -3.70% +22.17% -3.91%

All Process and Methodology Skills
UK excluding London

Data Security falls under the Processes and Methodologies category. For comparison with the information above, the following table provides summary statistics for all permanent job vacancies requiring process or methodology skills in the UK excluding London.

Permanent vacancies with a requirement for process or methodology skills 36,483 61,419 55,450
As % of all permanent jobs advertised in the UK excluding London 92.65% 82.37% 95.58%
Number of salaries quoted 17,392 42,187 28,711
10th Percentile £26,250 £27,250 £30,500
25th Percentile £36,750 £36,250 £40,000
Median annual salary (50th Percentile) £51,574 £50,000 £55,000
Median % change year-on-year +3.15% -9.09% +4.76%
75th Percentile £65,000 £65,000 £70,000
90th Percentile £77,500 £77,500 £82,500
UK median annual salary £57,443 £55,000 £60,899
% change year-on-year +4.44% -9.69% +1.50%

Data Security
Job Vacancy Trend in the UK excluding London

Job postings citing Data Security as a proportion of all IT jobs advertised in the UK excluding London.
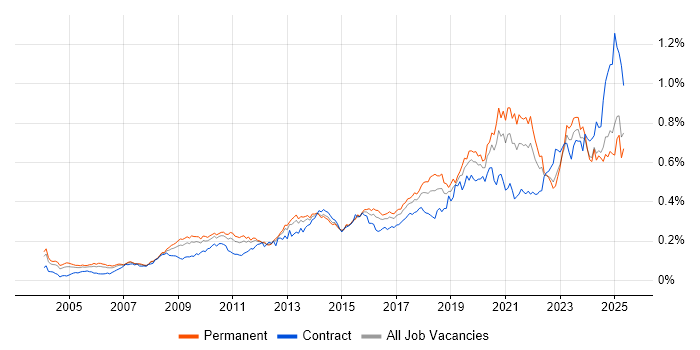
Job vacancy trend for Data Security in the UK excluding London

Data Security
Salary Trend in the UK excluding London

3-month moving average salary quoted in jobs citing Data Security in the UK excluding London.

Salary trend for Data Security in the UK excluding London

Data Security
Salary Histogram in the UK excluding London

Salary distribution for jobs citing Data Security in the UK excluding London over the 6 months to 30 May 2025.

Salary histogram for Data Security in the UK excluding London

Data Security
Job Locations in the UK excluding London

The table below looks at the demand and provides a guide to the median salaries quoted in IT jobs citing Data Security within the UK excluding London region over the 6 months to 30 May 2025. The 'Rank Change' column provides an indication of the change in demand within each location based on the same 6 month period last year.

Location Rank Change
on Same Period
Last Year
Matching
Permanent
IT Job Ads
Median Salary
Past 6 Months
Median Salary
% Change
on Same Period
Last Year
Live
Jobs
South East +49 95 £65,000 -13.33% 307
Midlands +44 72 £55,000 -8.33% 172
West Midlands +38 62 £55,000 -15.38% 95
North of England -40 38 £57,500 +21.05% 207
South West +77 19 £58,750 +46.88% 106
Yorkshire +37 19 £57,500 +27.78% 79
East of England +40 18 £50,000 -16.67% 142
North West -51 17 £55,000 -4.35% 99
East Midlands +28 10 £41,500 -24.55% 65
Scotland +109 7 £56,250 +30.06% 38
Wales +39 2 £80,000 +71.66% 24
North East +34 2 £65,750 +56.55% 30
Isle of Man - 2 - - 1
Northern Ireland - 2 - - 13
Data Security
UK

Data Security
Co-occurring Skills and Capabilities in the UK excluding London by Category

The follow tables expand on the table above by listing co-occurrences grouped by category. The same employment type, locality and period is covered with up to 20 co-occurrences shown in each of the following categories:

Application Platforms
1 29 (11.37%) Apache Spark
2 19 (7.45%) Microsoft Exchange
3 13 (5.10%) Apache
4 11 (4.31%) SharePoint
5 4 (1.57%) SAS
6 2 (0.78%) BizTalk Server
7 1 (0.39%) Confluence
7 1 (0.39%) IIS
Applications
1 15 (5.88%) Microsoft Office
2 11 (4.31%) Microsoft Excel
3 7 (2.75%) Acrobat
4 4 (1.57%) Microsoft Project
Business Applications
1 15 (5.88%) Oracle EBS
2 14 (5.49%) SAP S/4HANA
3 13 (5.10%) SAP HCM
3 13 (5.10%) SAP HR
3 13 (5.10%) SAP Payroll
4 7 (2.75%) SAP ERP
5 6 (2.35%) Dynamics NAV
6 4 (1.57%) ResourceLink
7 3 (1.18%) Dynamics CRM
7 3 (1.18%) Sparx Enterprise Architect
8 2 (0.78%) Salesforce CRM
9 1 (0.39%) Payment Gateway
Cloud Services
1 89 (34.90%) Azure
2 42 (16.47%) Power Platform
3 39 (15.29%) Microsoft 365
4 38 (14.90%) AWS
5 22 (8.63%) GCP
6 20 (7.84%) Azure Data Factory
7 18 (7.06%) Amazon S3
8 13 (5.10%) SuccessFactors
9 11 (4.31%) AWS Lambda
9 11 (4.31%) Serverless
10 9 (3.53%) Microsoft Purview
10 9 (3.53%) Power Automate
10 9 (3.53%) Snowflake
11 8 (3.14%) Google Workspace
12 5 (1.96%) Cloud Computing
12 5 (1.96%) Entra ID
13 4 (1.57%) Amazon Kinesis
14 3 (1.18%) Azure DevOps
14 3 (1.18%) Azure Synapse Analytics
14 3 (1.18%) SaaS
Communications & Networking
1 29 (11.37%) Firewall
2 24 (9.41%) LAN
2 24 (9.41%) WAN
3 9 (3.53%) VPN
4 8 (3.14%) Intranet
5 6 (2.35%) DHCP
5 6 (2.35%) TCP/IP
5 6 (2.35%) Wi-Fi
6 5 (1.96%) Network Security
7 2 (0.78%) Internet
8 1 (0.39%) Cisco ISE
8 1 (0.39%) Intrusion Detection
8 1 (0.39%) SD-WAN
8 1 (0.39%) VoIP
8 1 (0.39%) Wireless
Database & Business Intelligence
1 62 (24.31%) Data Warehouse
2 41 (16.08%) Power BI
3 25 (9.80%) Big Data
4 24 (9.41%) Data Lake
5 17 (6.67%) SQL Server
6 15 (5.88%) Oracle ODI
6 15 (5.88%) Tableau
7 14 (5.49%) SQL Server Integration Services
8 13 (5.10%) Amazon Redshift
9 12 (4.71%) SQL Server Reporting Services
10 11 (4.31%) NoSQL
11 10 (3.92%) Hadoop
12 8 (3.14%) MySQL
13 7 (2.75%) Looker
13 7 (2.75%) SQL Server Analysis Services
14 6 (2.35%) Azure SQL Database
14 6 (2.35%) Metadata
14 6 (2.35%) MongoDB
14 6 (2.35%) Oracle Database
15 5 (1.96%) PostgreSQL
Development Applications
1 6 (2.35%) JIRA
2 4 (1.57%) Moq
2 4 (1.57%) SpecFlow
3 3 (1.18%) ERwin
3 3 (1.18%) Git
4 1 (0.39%) GitLab
4 1 (0.39%) Jenkins
4 1 (0.39%) MLflow
4 1 (0.39%) Octopus Deploy
General
1 93 (36.47%) Social Skills
2 64 (25.10%) Analytical Skills
3 53 (20.78%) Finance
4 43 (16.86%) Law
5 17 (6.67%) Legal
5 17 (6.67%) Public Sector
6 12 (4.71%) Marketing
6 12 (4.71%) Retail
7 9 (3.53%) Banking
8 7 (2.75%) Inclusion and Diversity
8 7 (2.75%) Telecoms
9 6 (2.35%) Pharmaceutical
10 3 (1.18%) Games
11 2 (0.78%) Billing
11 2 (0.78%) Health Technology
11 2 (0.78%) Manufacturing
11 2 (0.78%) Organisational Skills
11 2 (0.78%) Presentation Skills
11 2 (0.78%) Tech for Good
12 1 (0.39%) Documentation Skills
Job Titles
1 44 (17.25%) Lead
2 37 (14.51%) Data Engineer
3 36 (14.12%) Analyst
4 23 (9.02%) Senior
5 20 (7.84%) Support Analyst
6 17 (6.67%) Support Engineer
7 16 (6.27%) Consultant
7 16 (6.27%) Data Consultant
8 15 (5.88%) Data Manager
8 15 (5.88%) Data Migration Consultant
8 15 (5.88%) Migration Consultant
8 15 (5.88%) Oracle Consultant
8 15 (5.88%) Oracle Data Migration Consultant
8 15 (5.88%) Oracle Technical Consultant
8 15 (5.88%) Technical Consultant
9 14 (5.49%) 2nd/3rd Line Support
9 14 (5.49%) 2nd/3rd Line Support Engineer
9 14 (5.49%) 3rd Line Engineer
9 14 (5.49%) 3rd Line Support
9 14 (5.49%) 3rd Line Support Engineer
Libraries, Frameworks & Software Standards
1 15 (5.88%) Oracle Fusion
2 13 (5.10%) PySpark
2 13 (5.10%) SAP Fiori
3 10 (3.92%) Kafka
3 10 (3.92%) REST
4 6 (2.35%) .NET
5 5 (1.96%) OAuth
5 5 (1.96%) OAuth2
6 4 (1.57%) EDI
6 4 (1.57%) Middleware
6 4 (1.57%) Pandas
7 3 (1.18%) .NET Core
7 3 (1.18%) .NET Framework
7 3 (1.18%) Entity Framework
7 3 (1.18%) FHIR
7 3 (1.18%) Swagger
8 2 (0.78%) CSS
8 2 (0.78%) HTML
9 1 (0.39%) ASP.NET
9 1 (0.39%) JSON
Miscellaneous
1 25 (9.80%) Management Information System
2 17 (6.67%) Data Structures
3 16 (6.27%) Onboarding
4 15 (5.88%) Legacy Systems
5 13 (5.10%) Cloud Native
6 7 (2.75%) Data Protection Act
6 7 (2.75%) e-Learning
7 6 (2.35%) Driving Licence
7 6 (2.35%) Marketing Technology
8 4 (1.57%) Cyber Threat
9 3 (1.18%) Life Science
10 2 (0.78%) Analytical Mindset
10 2 (0.78%) Data Centre
10 2 (0.78%) Product Ownership
10 2 (0.78%) Self-Motivation
11 1 (0.39%) Cyber Defence
11 1 (0.39%) Enterprise Software
11 1 (0.39%) Housing Association
11 1 (0.39%) Security Posture
11 1 (0.39%) Virtual Team
Operating Systems
1 34 (13.33%) Windows
2 25 (9.80%) Windows Server
3 16 (6.27%) Windows Server 2016
3 16 (6.27%) Windows Server 2019
4 8 (3.14%) Linux
5 6 (2.35%) Apple iOS
5 6 (2.35%) Mac OS
6 1 (0.39%) Ubuntu
Processes & Methodologies
1 88 (34.51%) Problem-Solving
2 61 (23.92%) Analytics
3 60 (23.53%) ETL
4 56 (21.96%) Business Intelligence
5 55 (21.57%) Data Governance
6 48 (18.82%) Agile
7 40 (15.69%) Data Modelling
7 40 (15.69%) Mentoring
8 36 (14.12%) Decision-Making
9 34 (13.33%) Data Pipeline
10 33 (12.94%) Data Engineering
11 31 (12.16%) Computer Science
11 31 (12.16%) Migration
12 29 (11.37%) Project Management
13 27 (10.59%) DevOps
13 27 (10.59%) Validation
14 26 (10.20%) Data Architecture
15 25 (9.80%) Data Migration
15 25 (9.80%) Stakeholder Management
15 25 (9.80%) User Experience
Programming Languages
1 89 (34.90%) SQL
2 47 (18.43%) Python
3 25 (9.80%) PowerShell
4 21 (8.24%) PL/SQL
5 13 (5.10%) ABAP
6 9 (3.53%) T-SQL
7 7 (2.75%) Data Analysis Expressions
7 7 (2.75%) Scala
8 6 (2.35%) C#
9 5 (1.96%) Bash
10 4 (1.57%) TypeScript
11 2 (0.78%) Java
11 2 (0.78%) JavaScript
12 1 (0.39%) Cypher
12 1 (0.39%) Groovy
12 1 (0.39%) Progress 4GL
12 1 (0.39%) Shell Script
12 1 (0.39%) VB.NET
Qualifications
1 46 (18.04%) Degree
2 25 (9.80%) Computer Science Degree
3 19 (7.45%) PMI Certification
3 19 (7.45%) PMP
4 12 (4.71%) Master's Degree
5 11 (4.31%) Azure Certification
6 10 (3.92%) AWS Certification
7 8 (3.14%) Security Cleared
8 7 (2.75%) Microsoft Certification
8 7 (2.75%) SC Cleared
9 6 (2.35%) ITIL Certification
10 4 (1.57%) A+ Certification
10 4 (1.57%) CISM
10 4 (1.57%) CISSP
11 3 (1.18%) CITP
11 3 (1.18%) FFIEC
11 3 (1.18%) MCDST
12 2 (0.78%) DBS Check
13 1 (0.39%) (ISC)2 CCSP
13 1 (0.39%) CESG Certified Professional
Quality Assurance & Compliance
1 69 (27.06%) GDPR
2 30 (11.76%) Data Quality
3 16 (6.27%) California Consumer Privacy Act
4 12 (4.71%) Cyber Essentials
4 12 (4.71%) ISO/IEC 27001
5 11 (4.31%) QA
6 10 (3.92%) Accessibility
7 8 (3.14%) NIST
7 8 (3.14%) PCI DSS
8 7 (2.75%) PERC
9 3 (1.18%) 21 CFR Part 11
9 3 (1.18%) Good Clinical Practice
10 2 (0.78%) CDISC
11 1 (0.39%) GLP
11 1 (0.39%) ISO/IEC 27002 (supersedes ISO/IEC 17799)
11 1 (0.39%) SLA
System Software
1 30 (11.76%) Active Directory
2 19 (7.45%) VMware Infrastructure
3 16 (6.27%) XenApp
4 10 (3.92%) Docker
5 2 (0.78%) Hyper-V
5 2 (0.78%) Virtual Servers
6 1 (0.39%) Oracle RAC
Systems Management
1 16 (6.27%) Microsoft Intune
2 7 (2.75%) Kubernetes
3 2 (0.78%) Terraform
4 1 (0.39%) AirWatch
4 1 (0.39%) FortiGate
4 1 (0.39%) Oracle RMAN
4 1 (0.39%) Single Sign-On
Vendors
1 44 (17.25%) Microsoft
2 40 (15.69%) SAP
3 32 (12.55%) Oracle
4 23 (9.02%) Google
5 19 (7.45%) Cisco
5 19 (7.45%) Concur
5 19 (7.45%) VMware
5 19 (7.45%) Workday
6 17 (6.67%) Meraki
7 16 (6.27%) CheckPoint
7 16 (6.27%) Citrix
7 16 (6.27%) SonicWALL
8 7 (2.75%) Adobe
8 7 (2.75%) OneTrust
9 6 (2.35%) Apple
9 6 (2.35%) Databricks
10 4 (1.57%) Cognos
10 4 (1.57%) Informatica
10 4 (1.57%) Palantir
10 4 (1.57%) ServiceNow