Games Jobs in the UK excluding London

Gaming
UK > UK excluding London

The table below looks at the prevalence of the term Games in permanent job vacancies in the UK excluding London. Included is a benchmarking guide to the salaries offered in vacancies that cited Games over the 6 months leading up to 14 May 2025, comparing them to the same period in the previous two years.

6 months to
14 May 2025
Same period 2024 Same period 2023
Rank 102 220 58
Rank change year-on-year +118 -162 +125
Permanent jobs citing Games 1,144 943 3,149
As % of all permanent jobs advertised in the UK excluding London 2.93% 1.33% 5.24%
As % of the General category 4.40% 2.32% 7.63%
Number of salaries quoted 593 723 384
10th Percentile - £27,500 £26,250
25th Percentile £23,504 £37,500 £41,250
Median annual salary (50th Percentile) £25,087 £50,000 £55,000
Median % change year-on-year -49.83% -9.09% -15.38%
75th Percentile £45,250 £65,000 £72,500
90th Percentile £67,500 £75,000 £87,125
UK median annual salary £26,929 £54,900 £62,500
% change year-on-year -50.95% -12.16% -9.75%

All General Skills
UK excluding London

Games falls under the General Skills category. For comparison with the information above, the following table provides summary statistics for all permanent job vacancies requiring common skills in the UK excluding London.

Permanent vacancies with a requirement for common skills 25,991 40,667 41,255
As % of all permanent jobs advertised in the UK excluding London 66.66% 57.40% 68.63%
Number of salaries quoted 11,992 26,395 18,794
10th Percentile £25,313 £26,000 £28,500
25th Percentile £34,500 £32,500 £37,418
Median annual salary (50th Percentile) £50,000 £47,500 £52,500
Median % change year-on-year +5.26% -9.52% +5.00%
75th Percentile £65,000 £62,500 £67,500
90th Percentile £77,500 £75,000 £81,250
UK median annual salary £55,000 £52,500 £60,000
% change year-on-year +4.76% -12.50% -

Games
Job Vacancy Trend in the UK excluding London

Job postings citing Games as a proportion of all IT jobs advertised in the UK excluding London.
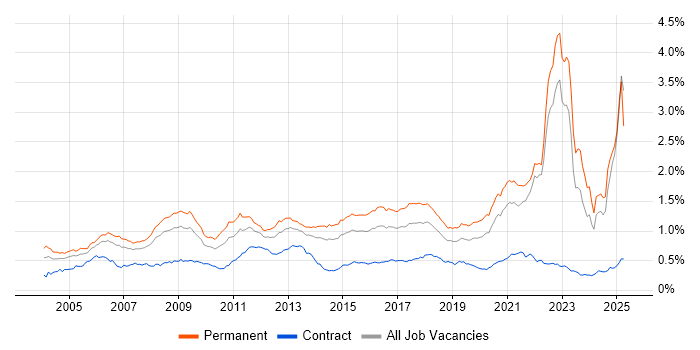
Job vacancy trend for Games in the UK excluding London

Games
Salary Trend in the UK excluding London

3-month moving average salary quoted in jobs citing Games in the UK excluding London.

Salary trend for Games in the UK excluding London

Games
Salary Histogram in the UK excluding London

Salary distribution for jobs citing Games in the UK excluding London over the 6 months to 14 May 2025.

Salary histogram for Games in the UK excluding London

Games
Job Locations in the UK excluding London

The table below looks at the demand and provides a guide to the median salaries quoted in IT jobs citing Games within the UK excluding London region over the 6 months to 14 May 2025. The 'Rank Change' column provides an indication of the change in demand within each location based on the same 6 month period last year.

Location Rank Change
on Same Period
Last Year
Matching
Permanent
IT Job Ads
Median Salary
Past 6 Months
Median Salary
% Change
on Same Period
Last Year
Live
Jobs
North of England +72 415 £25,087 -54.30% 357
Wales +69 238 £23,504 -52.99% 32
North West +16 187 £23,504 -47.77% 243
South West +75 169 £25,087 -44.86% 71
North East +42 156 £25,087 -60.85% 41
Scotland +124 98 £26,968 -48.63% 44
South East +48 92 £39,500 -21.00% 428
Midlands +25 89 £42,500 -22.73% 155
Yorkshire +79 72 £25,267 -49.47% 77
West Midlands +7 48 £55,000 - 96
East of England +7 42 £60,000 - 114
East Midlands +42 41 £42,500 -19.05% 51
Northern Ireland +46 4 - - 7
Games
UK

Games
Co-occurring Skills and Capabilities in the UK excluding London by Category

The follow tables expand on the table above by listing co-occurrences grouped by category. The same employment type, locality and period is covered with up to 20 co-occurrences shown in each of the following categories:

Application Platforms
1 13 (1.14%) Microsoft Exchange
2 6 (0.52%) SharePoint
3 5 (0.44%) IIS
4 3 (0.26%) CMS
4 3 (0.26%) Confluence
4 3 (0.26%) EPiServer
5 1 (0.087%) Jupyter
Applications
1 6 (0.52%) Microsoft Office
2 4 (0.35%) Blender
2 4 (0.35%) Maya
3 3 (0.26%) Adobe After Effects
3 3 (0.26%) Adobe Creative Suite
3 3 (0.26%) Chatbot
3 3 (0.26%) Photoshop
4 2 (0.17%) Adobe Illustrator
4 2 (0.17%) Adobe XD
4 2 (0.17%) Microsoft Excel
4 2 (0.17%) Moqups
4 2 (0.17%) Sketch
4 2 (0.17%) ZBrush
5 1 (0.087%) 3ds Max
5 1 (0.087%) Adobe Captivate
5 1 (0.087%) InDesign
5 1 (0.087%) Microsoft PowerPoint
5 1 (0.087%) Pro Tools
5 1 (0.087%) Spreadsheet
Business Applications
1 22 (1.92%) Dynamics AX
2 3 (0.26%) Payment Gateway
3 1 (0.087%) SAP Business One
Cloud Services
1 68 (5.94%) AWS
2 46 (4.02%) GCP
3 27 (2.36%) Azure
4 22 (1.92%) SaaS
5 18 (1.57%) Microsoft 365
6 11 (0.96%) Power Platform
7 5 (0.44%) Entra ID
7 5 (0.44%) Figma
7 5 (0.44%) Google Analytics
7 5 (0.44%) OneDrive
8 4 (0.35%) AWS Lambda
8 4 (0.35%) Dynamics 365
8 4 (0.35%) Serverless
9 3 (0.26%) Amazon MSK
9 3 (0.26%) Power Automate
9 3 (0.26%) PowerApps
9 3 (0.26%) Stripe
10 2 (0.17%) Amazon ECS
10 2 (0.17%) Google Ads
10 2 (0.17%) Nutanix
Communications & Networking
1 775 (67.74%) Broadband
2 7 (0.61%) SAN
3 6 (0.52%) Firewall
3 6 (0.52%) NAS
3 6 (0.52%) VoIP
4 3 (0.26%) Remote Desktop
4 3 (0.26%) Wi-Fi
5 2 (0.17%) DHCP
5 2 (0.17%) DNS
5 2 (0.17%) LAN
5 2 (0.17%) WAN
6 1 (0.087%) 5G
6 1 (0.087%) 802.11
6 1 (0.087%) Internet
6 1 (0.087%) Network Security
6 1 (0.087%) TCP/IP
6 1 (0.087%) VLAN
6 1 (0.087%) Wireless
6 1 (0.087%) WLAN
Database & Business Intelligence
1 49 (4.28%) MySQL
2 9 (0.79%) SQL Server
3 6 (0.52%) Power BI
4 4 (0.35%) DynamoDB
5 3 (0.26%) Amazon Aurora
5 3 (0.26%) Data Warehouse
5 3 (0.26%) Looker
5 3 (0.26%) PostgreSQL
6 2 (0.17%) Elasticsearch
6 2 (0.17%) NoSQL
6 2 (0.17%) OLTP
6 2 (0.17%) Redis
6 2 (0.17%) Relational Database
7 1 (0.087%) Amazon QuickSight
7 1 (0.087%) Couchbase
7 1 (0.087%) DocumentDB
7 1 (0.087%) GIS
7 1 (0.087%) SAP HANA
7 1 (0.087%) Tableau
Development Applications
1 69 (6.03%) Git
2 21 (1.84%) webpack
3 18 (1.57%) gulp
4 6 (0.52%) Cypress.io
5 5 (0.44%) TestRail
5 5 (0.44%) Vite
6 4 (0.35%) JIRA
7 3 (0.26%) Jenkins
7 3 (0.26%) Postman
8 2 (0.17%) GitLab
9 1 (0.087%) Android Studio
9 1 (0.087%) Bugzilla
9 1 (0.087%) Jasmine
9 1 (0.087%) NUnit
9 1 (0.087%) PostCSS
9 1 (0.087%) rollup.js
9 1 (0.087%) Selenium
9 1 (0.087%) Subversion
9 1 (0.087%) TeamCity
9 1 (0.087%) Xcode
General
1 706 (61.71%) Banking
2 104 (9.09%) Retail
3 93 (8.13%) Telecoms
4 82 (7.17%) Finance
5 47 (4.11%) Social Skills
6 33 (2.88%) Marketing
7 32 (2.80%) Manufacturing
8 22 (1.92%) Law
9 21 (1.84%) Billing
10 14 (1.22%) Analytical Skills
11 12 (1.05%) Advertising
11 12 (1.05%) Inclusion and Diversity
12 5 (0.44%) Presentation Skills
13 4 (0.35%) iGaming
14 3 (0.26%) Documentation Skills
14 3 (0.26%) Public Sector
15 2 (0.17%) Dutch Language
15 2 (0.17%) Legal
15 2 (0.17%) Organisational Skills
15 2 (0.17%) Wearables
Job Titles
1 708 (61.89%) Customer Service Advisor
2 234 (20.45%) Senior
3 76 (6.64%) Developer
4 36 (3.15%) Lead
4 36 (3.15%) Software Engineer
5 29 (2.53%) PHP Developer
5 29 (2.53%) Senior Developer
6 24 (2.10%) Analyst
7 23 (2.01%) Senior Software Engineer
8 22 (1.92%) JavaScript Developer
8 22 (1.92%) PHP Software Engineer
9 21 (1.84%) Senior PHP Developer
10 19 (1.66%) Games Developer
11 16 (1.40%) Support Analyst
12 13 (1.14%) Front-End Developer (Client-Side Developer)
13 11 (0.96%) Technical Leader
14 10 (0.87%) Lead Developer
15 9 (0.79%) Sales Executive
15 9 (0.79%) Senior Front-End Developer
16 8 (0.70%) 2nd Line Support Analyst
Libraries, Frameworks & Software Standards
1 84 (7.34%) WebGL
2 72 (6.29%) Unity (Game Engine)
3 65 (5.68%) GraphQL
4 56 (4.90%) HTML
5 51 (4.46%) CSS
6 38 (3.32%) LAMP
6 38 (3.32%) Laravel
7 31 (2.71%) Node.js
8 28 (2.45%) React
9 22 (1.92%) Pixi.js
10 17 (1.49%) Spine.js
11 12 (1.05%) .NET
11 12 (1.05%) Vue
12 9 (0.79%) AngularJS
12 9 (0.79%) Unreal Engine
13 8 (0.70%) HTML5
13 8 (0.70%) Kafka
14 7 (0.61%) Jest
14 7 (0.61%) jQuery
15 6 (0.52%) Enzyme
Miscellaneous
1 70 (6.12%) Animation
2 37 (3.23%) Mobile App
3 24 (2.10%) Management Information System
3 24 (2.10%) Robotics
4 22 (1.92%) Blockchain
5 21 (1.84%) Self-Motivation
6 13 (1.14%) Online Games
6 13 (1.14%) Social Media
7 12 (1.05%) Algorithms
8 10 (0.87%) Clustering
9 8 (0.70%) Product Ownership
10 7 (0.61%) Sports Betting
11 5 (0.44%) NHS
11 5 (0.44%) Virtual Reality
12 4 (0.35%) Augmented Reality
13 3 (0.26%) e-Learning
13 3 (0.26%) Legacy Code
13 3 (0.26%) Video Conferencing
13 3 (0.26%) Video\Live Streaming
14 2 (0.17%) Distributed Systems
Operating Systems
1 23 (2.01%) Windows
2 8 (0.70%) Linux
3 3 (0.26%) Windows Server
4 2 (0.17%) Android
4 2 (0.17%) Apple iOS
4 2 (0.17%) CentOS
4 2 (0.17%) Windows 10
4 2 (0.17%) Windows Server 2016
5 1 (0.087%) Windows 7
5 1 (0.087%) Windows 8
5 1 (0.087%) Windows Server 2019
Processes & Methodologies
1 879 (76.84%) Problem-Solving
2 742 (64.86%) Customer Service
3 147 (12.85%) Mentoring
4 105 (9.18%) Artificial Intelligence
5 71 (6.21%) Software Engineering
6 70 (6.12%) Agile
7 68 (5.94%) E-Commerce
7 68 (5.94%) Storytelling
8 67 (5.86%) Prototyping
9 66 (5.77%) Visual Effects
10 65 (5.68%) 3D Animation
10 65 (5.68%) Rapid Prototyping
11 43 (3.76%) Coaching
11 43 (3.76%) OOP
12 33 (2.88%) MVC
13 32 (2.80%) Analytics
13 32 (2.80%) Web Development
14 27 (2.36%) SOLID
15 26 (2.27%) ERP
15 26 (2.27%) User Experience
Programming Languages
1 88 (7.69%) JavaScript
2 71 (6.21%) PHP
3 65 (5.68%) HLSL
4 36 (3.15%) TypeScript
5 23 (2.01%) Python
6 16 (1.40%) SQL
7 14 (1.22%) C#
8 12 (1.05%) Go
8 12 (1.05%) Java
9 6 (0.52%) C++
9 6 (0.52%) PowerShell
10 4 (0.35%) Bash
11 2 (0.17%) R
12 1 (0.087%) C
12 1 (0.087%) Groovy
12 1 (0.087%) Swift
12 1 (0.087%) T-SQL
Qualifications
1 30 (2.62%) Degree
2 22 (1.92%) CISA
2 22 (1.92%) ISACA
3 5 (0.44%) Master's Degree
4 4 (0.35%) Computer Science Degree
5 1 (0.087%) ACCA
5 1 (0.087%) CISM
5 1 (0.087%) CISSP
5 1 (0.087%) DBS Check
5 1 (0.087%) HNC
5 1 (0.087%) HND
5 1 (0.087%) ICAEW
5 1 (0.087%) ISEB
5 1 (0.087%) ISTQB
5 1 (0.087%) ITIL Foundation Certificate
5 1 (0.087%) Microsoft Certification
5 1 (0.087%) Numerate Degree
5 1 (0.087%) SC Cleared
5 1 (0.087%) Security Cleared
Quality Assurance & Compliance
1 33 (2.88%) QA
2 22 (1.92%) ITGC
3 17 (1.49%) GDPR
4 13 (1.14%) Accessibility
5 2 (0.17%) Data Quality
System Software
1 13 (1.14%) Active Directory
2 12 (1.05%) Docker
3 8 (0.70%) VMware Infrastructure
4 3 (0.26%) Virtual Desktop
5 2 (0.17%) VMware ESXi
5 2 (0.17%) VMware NSX
Systems Management
1 24 (2.10%) Kubernetes
2 8 (0.70%) Terraform
3 5 (0.44%) Microsoft Intune
4 4 (0.35%) Ansible
5 2 (0.17%) Grafana
5 2 (0.17%) Prometheus
Vendors
1 780 (68.18%) BT
2 39 (3.41%) Microsoft
3 25 (2.19%) Oracle
4 24 (2.10%) SAP
5 17 (1.49%) Commvault
6 11 (0.96%) Twitter
7 10 (0.87%) VMware
8 8 (0.70%) Adobe
9 6 (0.52%) Google
10 5 (0.44%) Meraki
11 4 (0.35%) HubSpot
11 4 (0.35%) ServiceNow
12 3 (0.26%) PayPal
12 3 (0.26%) Sun
13 2 (0.17%) Kofax
13 2 (0.17%) Proofpoint
13 2 (0.17%) Rollbar
14 1 (0.087%) Nimble Storage
14 1 (0.087%) UiPath
14 1 (0.087%) Xero