Waterfall Jobs in the UK excluding London

Waterfall Model
UK > UK excluding London

The table below provides summary statistics for permanent job vacancies advertised in the UK excluding London requiring Waterfall skills. It includes a benchmarking guide to the annual salaries offered in vacancies that cited Waterfall over the 6 months leading up to 11 May 2025, comparing them to the same period in the previous two years.

6 months to
11 May 2025
Same period 2024 Same period 2023
Rank 186 256 151
Rank change year-on-year +70 -105 -28
Permanent jobs citing Waterfall 603 795 1,381
As % of all permanent jobs advertised in the UK excluding London 1.54% 1.12% 2.30%
As % of the Processes & Methodologies category 1.66% 1.33% 2.41%
Number of salaries quoted 416 661 710
10th Percentile £46,250 £36,000 £41,250
25th Percentile £54,793 £46,250 £47,031
Median annual salary (50th Percentile) £60,000 £54,000 £57,500
Median % change year-on-year +11.11% -6.09% +4.55%
75th Percentile £68,000 £67,500 £68,750
90th Percentile £73,000 £78,750 £79,000
UK median annual salary £60,000 £55,000 £60,000
% change year-on-year +9.09% -8.33% +4.35%

All Process and Methodology Skills
UK excluding London

Waterfall falls under the Processes and Methodologies category. For comparison with the information above, the following table provides summary statistics for all permanent job vacancies requiring process or methodology skills in the UK excluding London.

Permanent vacancies with a requirement for process or methodology skills 36,295 59,625 57,307
As % of all permanent jobs advertised in the UK excluding London 92.88% 84.00% 95.62%
Number of salaries quoted 18,237 41,241 29,486
10th Percentile £27,000 £27,250 £30,500
25th Percentile £37,750 £36,250 £40,000
Median annual salary (50th Percentile) £52,500 £50,000 £55,000
Median % change year-on-year +5.00% -9.09% +4.76%
75th Percentile £66,200 £65,000 £70,000
90th Percentile £78,750 £77,500 £82,500
UK median annual salary £57,500 £55,000 £61,180
% change year-on-year +4.55% -10.10% +1.97%

Waterfall
Job Vacancy Trend in the UK excluding London

Job postings citing Waterfall as a proportion of all IT jobs advertised in the UK excluding London.
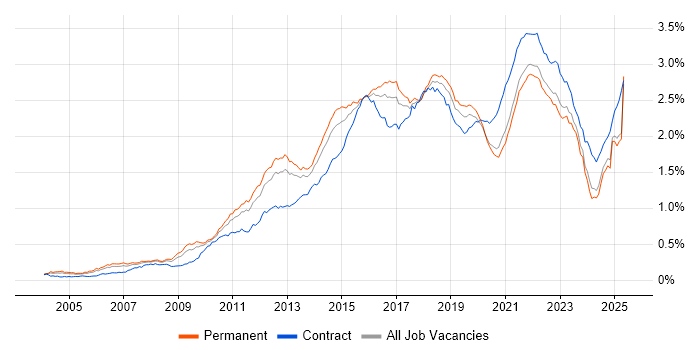
Job vacancy trend for Waterfall in the UK excluding London

Waterfall
Salary Trend in the UK excluding London

3-month moving average salary quoted in jobs citing Waterfall in the UK excluding London.

Salary trend for Waterfall in the UK excluding London

Waterfall
Salary Histogram in the UK excluding London

Salary distribution for jobs citing Waterfall in the UK excluding London over the 6 months to 11 May 2025.

Salary histogram for Waterfall in the UK excluding London

Waterfall
Job Locations in the UK excluding London

The table below looks at the demand and provides a guide to the median salaries quoted in IT jobs citing Waterfall within the UK excluding London region over the 6 months to 11 May 2025. The 'Rank Change' column provides an indication of the change in demand within each location based on the same 6 month period last year.

Location Rank Change
on Same Period
Last Year
Matching
Permanent
IT Job Ads
Median Salary
Past 6 Months
Median Salary
% Change
on Same Period
Last Year
Live
Jobs
South East +101 249 £65,000 +20.37% 139
Midlands +22 134 £57,750 +6.94% 55
North of England -12 111 £54,793 -0.19% 70
West Midlands +46 92 £57,500 +4.55% 30
North West +1 79 £54,793 +5.37% 43
East Midlands +16 42 £60,000 +11.11% 22
South West +50 32 £60,000 +20.00% 47
Wales +62 31 £65,000 +23.96% 6
Yorkshire +10 25 £56,250 -10.00% 25
Scotland +109 23 £55,000 - 25
East of England -19 23 £70,000 +27.27% 23
North East +28 7 £47,500 -9.52% 6
Waterfall
UK

Waterfall
Co-occurring Skills and Capabilities in the UK excluding London by Category

The follow tables expand on the table above by listing co-occurrences grouped by category. The same employment type, locality and period is covered with up to 20 co-occurrences shown in each of the following categories:

Application Platforms
1 24 (3.98%) Confluence
2 8 (1.33%) Apache Spark
3 4 (0.66%) Apache
4 3 (0.50%) SharePoint
5 2 (0.33%) Apache Airflow
5 2 (0.33%) CMS
6 1 (0.17%) CICS
6 1 (0.17%) ColdFusion
6 1 (0.17%) Kentico
6 1 (0.17%) OpenEdge
6 1 (0.17%) Sitecore CMS
6 1 (0.17%) Sitefinity
6 1 (0.17%) Umbraco
Applications
1 33 (5.47%) Microsoft Project
2 13 (2.16%) Microsoft Office
3 11 (1.82%) Microsoft Excel
4 7 (1.16%) MS Visio
4 7 (1.16%) Trello
5 4 (0.66%) Microsoft PowerPoint
6 1 (0.17%) Spreadsheet
Business Applications
1 5 (0.83%) Dynamics CRM
1 5 (0.83%) Oracle ERP
2 2 (0.33%) Oracle EBS
2 2 (0.33%) Oracle EBS R12
2 2 (0.33%) Salesforce CRM
2 2 (0.33%) Siebel CRM
3 1 (0.17%) ResourceLink
Cloud Services
1 46 (7.63%) Azure
2 32 (5.31%) AWS
3 30 (4.98%) Power Platform
4 28 (4.64%) SaaS
5 27 (4.48%) Azure DevOps
5 27 (4.48%) Power Automate
6 23 (3.81%) Azure Service Bus
7 17 (2.82%) PaaS
8 15 (2.49%) Dynamics 365
8 15 (2.49%) IaaS
9 14 (2.32%) Azure AI
9 14 (2.32%) Azure ExpressRoute
9 14 (2.32%) Azure Key Vault
9 14 (2.32%) Azure Monitor
9 14 (2.32%) Entra ID
10 11 (1.82%) Amazon S3
11 10 (1.66%) Microsoft 365
11 10 (1.66%) Serverless
12 7 (1.16%) Amazon CloudWatch
12 7 (1.16%) Virtual Private Cloud
Communications & Networking
1 26 (4.31%) Firewall
2 22 (3.65%) SD-WAN
2 22 (3.65%) WAN
3 15 (2.49%) DNS
4 14 (2.32%) VPN
5 8 (1.33%) 5G
6 3 (0.50%) Ethernet
7 2 (0.33%) DWDM
7 2 (0.33%) GPON
7 2 (0.33%) IPv4
7 2 (0.33%) IPv6
7 2 (0.33%) MPLS
8 1 (0.17%) Broadband
8 1 (0.17%) DHCP
8 1 (0.17%) Modbus
8 1 (0.17%) Wireless
Database & Business Intelligence
1 23 (3.81%) Power BI
2 16 (2.65%) MySQL
3 14 (2.32%) Data Lake
4 12 (1.99%) Data Warehouse
5 11 (1.82%) Relational Database
6 8 (1.33%) PostgreSQL
7 7 (1.16%) SQL Server
8 5 (0.83%) Oracle Database
8 5 (0.83%) RDBMS
9 4 (0.66%) Amazon Redshift
9 4 (0.66%) Big Data
9 4 (0.66%) Tableau
10 2 (0.33%) Apache Hive
10 2 (0.33%) Data Mining
10 2 (0.33%) DB2
10 2 (0.33%) NoSQL
10 2 (0.33%) OLAP
10 2 (0.33%) OLTP
10 2 (0.33%) Oracle Reports
10 2 (0.33%) Snowflake Schema
Development Applications
1 62 (10.28%) JIRA
2 22 (3.65%) Git
3 21 (3.48%) eggPlant
4 5 (0.83%) Postman
5 4 (0.66%) Cypress.io
5 4 (0.66%) Selenium
5 4 (0.66%) Visual Studio
5 4 (0.66%) Visual Studio Code
6 3 (0.50%) Oracle Forms
7 2 (0.33%) Jenkins
7 2 (0.33%) Oracle APEX
7 2 (0.33%) Subversion
8 1 (0.17%) IBM UrbanCode
8 1 (0.17%) JMeter
8 1 (0.17%) LoadRunner
8 1 (0.17%) PROIV
8 1 (0.17%) Team Foundation Server
General
1 125 (20.73%) Social Skills
2 75 (12.44%) Finance
3 43 (7.13%) Analytical Skills
4 24 (3.98%) Organisational Skills
5 23 (3.81%) Manufacturing
6 18 (2.99%) Electronics
7 15 (2.49%) Law
8 14 (2.32%) Retail
9 12 (1.99%) Inclusion and Diversity
10 11 (1.82%) Banking
11 10 (1.66%) Presentation Skills
11 10 (1.66%) Public Sector
12 7 (1.16%) Influencing Skills
13 3 (0.50%) Military
14 2 (0.33%) Aerospace
14 2 (0.33%) Documentation Skills
14 2 (0.33%) Legal
14 2 (0.33%) Marketing
14 2 (0.33%) Telecoms
15 1 (0.17%) Aviation
Job Titles
1 181 (30.02%) Senior
2 171 (28.36%) Principal Engineer
3 115 (19.07%) Software Engineer
4 106 (17.58%) Project Manager
5 73 (12.11%) Principal Software Engineer
6 70 (11.61%) Analyst
7 60 (9.95%) Architect
8 51 (8.46%) Test Engineer
9 50 (8.29%) Senior Software Test Engineer
9 50 (8.29%) Senior Test Engineer
9 50 (8.29%) Software Test Engineer
10 38 (6.30%) Senior Software Engineer
11 35 (5.80%) Software Architect
11 35 (5.80%) Test Analyst
12 34 (5.64%) Senior Analyst
12 34 (5.64%) Senior Manager
13 32 (5.31%) Senior Project Manager
14 28 (4.64%) Lead
15 26 (4.31%) Configuration Management Engineer
15 26 (4.31%) IT Project Manager
Libraries, Frameworks & Software Standards
1 35 (5.80%) Middleware
2 15 (2.49%) .NET
3 13 (2.16%) HTML
4 8 (1.33%) .NET Framework
4 8 (1.33%) React
5 7 (1.16%) AngularJS
5 7 (1.16%) ASP.NET Web API
5 7 (1.16%) CSS
5 7 (1.16%) JSON
6 6 (1.00%) Bootstrap
6 6 (1.00%) Tailwind CSS
6 6 (1.00%) XML
7 4 (0.66%) ADO
7 4 (0.66%) NgRx
7 4 (0.66%) Playwright
7 4 (0.66%) REST
7 4 (0.66%) RxJS
7 4 (0.66%) Web Services
8 3 (0.50%) ASP.NET
8 3 (0.50%) SOAP
Miscellaneous
1 21 (3.48%) Product Ownership
2 18 (2.99%) Data Centre
3 15 (2.49%) NHS
4 12 (1.99%) Self-Motivation
5 8 (1.33%) Management Information System
5 8 (1.33%) Self-Driving Car
5 8 (1.33%) Social Media
6 5 (0.83%) Client/Server
6 5 (0.83%) Driving Licence
6 5 (0.83%) PMI
6 5 (0.83%) Virtual Team
7 4 (0.66%) Data Protection Act
7 4 (0.66%) Legacy Applications
7 4 (0.66%) Legacy Systems
8 2 (0.33%) Algorithms
8 2 (0.33%) Greenfield Project
8 2 (0.33%) IoT
8 2 (0.33%) Low-Code
8 2 (0.33%) Onboarding
8 2 (0.33%) PKI
Operating Systems
1 10 (1.66%) Windows
2 8 (1.33%) Windows Vista
3 3 (0.50%) Linux
4 1 (0.17%) AIX
4 1 (0.17%) Android
4 1 (0.17%) Apple iOS
4 1 (0.17%) CentOS
4 1 (0.17%) Debian
4 1 (0.17%) Unix
4 1 (0.17%) zOS
Processes & Methodologies
1 569 (94.36%) Agile
2 216 (35.82%) Software Engineering
3 209 (34.66%) Computer Science
4 202 (33.50%) UML
5 180 (29.85%) Project Management
6 170 (28.19%) Configuration Management
7 148 (24.54%) Software Testing
8 138 (22.89%) SDLC
9 123 (20.40%) Stakeholder Management
10 107 (17.74%) Project Delivery
11 100 (16.58%) Test Automation
12 87 (14.43%) Scrum
13 76 (12.60%) Mentoring
14 75 (12.44%) DevOps
15 70 (11.61%) Validation
16 68 (11.28%) Continuous Improvement
17 57 (9.45%) Verification and Validation
18 55 (9.12%) PRINCE2
19 52 (8.62%) Problem-Solving
20 44 (7.30%) ITIL
Programming Languages
1 76 (12.60%) Ada
2 41 (6.80%) SQL
3 27 (4.48%) JavaScript
3 27 (4.48%) Python
4 21 (3.48%) Ada 95
4 21 (3.48%) Java
5 17 (2.82%) C#
6 16 (2.65%) PowerShell
7 14 (2.32%) Bicep
8 9 (1.49%) C++
9 6 (1.00%) C
10 5 (0.83%) PL/SQL
11 4 (0.66%) TypeScript
11 4 (0.66%) VBA
12 3 (0.50%) T-SQL
13 2 (0.33%) R
14 1 (0.17%) Apex Code
14 1 (0.17%) Go
14 1 (0.17%) JCL
14 1 (0.17%) PHP
Qualifications
1 349 (57.88%) Degree
2 237 (39.30%) BPSS Clearance
3 134 (22.22%) Chartered Engineer
4 52 (8.62%) PMP
5 40 (6.63%) Computer Science Degree
6 29 (4.81%) PMI Certification
7 26 (4.31%) Security Cleared
8 25 (4.15%) DBS Check
9 19 (3.15%) SC Cleared
10 17 (2.82%) Azure Certification
11 14 (2.32%) ISTQB
12 5 (0.83%) Microsoft Certification
13 4 (0.66%) Master's Degree
13 4 (0.66%) PRINCE2 Certification
13 4 (0.66%) PRINCE2 Practitioner
14 3 (0.50%) CISSP
14 3 (0.50%) CSPO
15 2 (0.33%) APMP
15 2 (0.33%) DV Cleared
15 2 (0.33%) ISEB
Quality Assurance & Compliance
1 141 (23.38%) ISO/IEC 12207
2 33 (5.47%) QA
3 30 (4.98%) PMO
4 12 (1.99%) Data Quality
5 5 (0.83%) ISO/IEC 27001
6 4 (0.66%) NCSC
7 3 (0.50%) GDPR
7 3 (0.50%) NIST
8 2 (0.33%) HIPAA
9 1 (0.17%) Accessibility
9 1 (0.17%) Cyber Essentials
9 1 (0.17%) ISO 9001
9 1 (0.17%) P3O
9 1 (0.17%) PCI DSS
9 1 (0.17%) Software Quality Assurance
System Software
1 14 (2.32%) Virtual Machines
2 6 (1.00%) Embedded Firmware
2 6 (1.00%) Firmware
3 1 (0.17%) Docker
Systems Management
1 14 (2.32%) Single Sign-On
2 2 (0.33%) Ansible
3 1 (0.17%) CA Service Virtualization
3 1 (0.17%) Terraform
Vendors
1 72 (11.94%) Siemens
2 59 (9.78%) Microsoft
3 26 (4.31%) Micro Focus
4 23 (3.81%) Atlassian
5 21 (3.48%) Keysight
6 18 (2.99%) Databricks
7 14 (2.32%) Meraki
7 14 (2.32%) Oracle
8 7 (1.16%) Cisco
9 4 (0.66%) Blue Prism
9 4 (0.66%) Google
9 4 (0.66%) Salesforce
9 4 (0.66%) UiPath
10 3 (0.50%) IBM
10 3 (0.50%) SAP
11 2 (0.33%) Informatica
11 2 (0.33%) Nokia
11 2 (0.33%) ServiceNow
11 2 (0.33%) Siebel
11 2 (0.33%) Splunk