Waterfall Job Trends

Waterfall Model
UK

The table below provides summary statistics and salary benchmarking for jobs requiring Waterfall skills. It covers permanent job vacancies from the 6 months leading up to 24 October 2025, with comparisons to the same periods in the previous two years.

6 months to
24 Oct 2025
Same period 2024 Same period 2023
Rank 266 314 149
Rank change year-on-year +48 -165 +22
Permanent jobs citing Waterfall 542 557 1,217
As % of all permanent jobs in the UK 1.10% 0.81% 2.19%
As % of the Processes & Methodologies category 1.24% 0.98% 2.32%
Number of salaries quoted 356 349 963
10th Percentile £46,300 £41,250 £41,800
25th Percentile £52,500 £50,138 £51,250
Median annual salary (50th Percentile) £65,000 £59,125 £60,000
Median % change year-on-year +9.94% -1.46% -1.64%
75th Percentile £80,000 £73,886 £75,000
90th Percentile £95,000 £95,000 £89,750
UK excluding London median annual salary £60,000 £55,000 £55,000
% change year-on-year +9.09% - -

All Process and Methodology Skills
UK

Waterfall falls under the Processes and Methodologies category. For comparison with the information above, the following table provides summary statistics for all permanent job vacancies requiring process or methodology skills.

Permanent vacancies with a requirement for process or methodology skills 43,671 56,801 52,380
As % of all permanent jobs advertised in the UK 88.34% 82.43% 94.05%
Number of salaries quoted 24,895 30,230 40,176
10th Percentile £28,250 £33,500 £32,500
25th Percentile £35,750 £45,000 £44,804
Median annual salary (50th Percentile) £54,625 £60,000 £60,000
Median % change year-on-year -8.96% - -
75th Percentile £75,000 £78,750 £80,000
90th Percentile £95,000 £97,500 £97,500
UK excluding London median annual salary £46,000 £54,000 £53,000
% change year-on-year -14.81% +1.89% +0.95%

Waterfall
Job Vacancy Trend

Historical trend showing the proportion of permanent IT job postings citing Waterfall relative to all permanent IT jobs advertised.
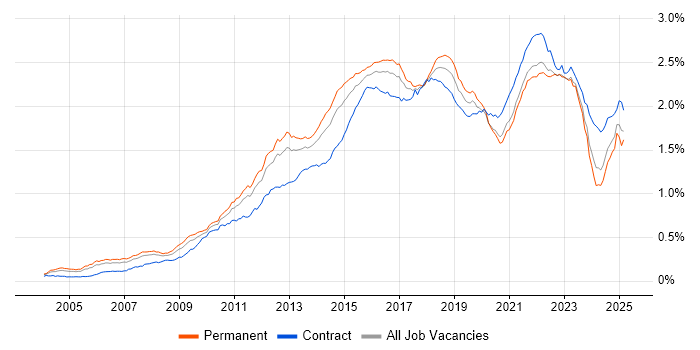
Waterfall job vacancy trend in the UK

Waterfall
Salary Trend

Salary distribution trend for jobs in the UK citing Waterfall.

Salary distribution trend for jobs in the UK citing Waterfall

Waterfall
Salary Histogram

Salary distribution for jobs citing Waterfall over the 6 months to 24 October 2025.

Salary histogram for Waterfall in the UK

Waterfall
Top 17 Job Locations

The table below looks at the demand and provides a guide to the median salaries quoted in IT jobs citing Waterfall within the UK over the 6 months to 24 October 2025. The 'Rank Change' column provides an indication of the change in demand within each location based on the same 6 month period last year.

Location Rank Change
on Same Period
Last Year
Matching
Permanent
IT Job Ads
Median Salary
Past 6 Months
Median Salary
% Change
on Same Period
Last Year
Live
Jobs
England +61 481 £65,000 +12.31% 574
UK excluding London +25 328 £60,000 +9.09% 489
Work from Home +35 187 £57,500 - 208
London +91 181 £75,000 +7.14% 186
South East +54 120 £62,500 +11.11% 155
North of England -35 67 £55,000 +1.85% 127
Midlands +45 66 £60,000 +9.15% 76
West Midlands +37 34 £61,250 +11.36% 42
East Midlands +24 32 £60,000 +11.11% 33
Yorkshire +18 32 £55,233 -13.70% 44
North West -27 30 £53,250 +1.43% 64
South West +46 28 £61,250 +11.36% 51
Scotland +10 23 £75,900 +41.21% 23
East of England -5 12 £63,750 +18.06% 44
Wales +21 10 £70,000 +16.67% 7
North East +5 5 £65,000 +37.87% 20
Northern Ireland +11 2 - - 9

Waterfall
Co-Occurring Skills & Capabilities by Category

The following tables expand on the one above by listing co-occurrences grouped by category. They cover the same employment type, locality and period, with up to 20 co-occurrences shown in each category:

Application Platforms
1 43 (7.93%) Confluence
2 16 (2.95%) Appian
2 16 (2.95%) SharePoint
3 4 (0.74%) CMS
4 2 (0.37%) Apache
4 2 (0.37%) Apache Spark
5 1 (0.18%) Headless CMS
5 1 (0.18%) Sitecore CMS
5 1 (0.18%) Umbraco
Applications
1 43 (7.93%) Microsoft Project
2 34 (6.27%) Microsoft Office
3 25 (4.61%) Microsoft Excel
3 25 (4.61%) MS Visio
4 18 (3.32%) Microsoft PowerPoint
5 10 (1.85%) Trello
6 4 (0.74%) CATIA
7 2 (0.37%) EPLAN
8 1 (0.18%) Photoshop
Business Applications
1 16 (2.95%) SAP S/4HANA
2 9 (1.66%) Dynamics CRM
3 6 (1.11%) Elite 3E
4 5 (0.92%) Salesforce CRM
5 2 (0.37%) Adobe Campaign
5 2 (0.37%) Bloomberg AIM
5 2 (0.37%) IBM Planning Analytics
5 2 (0.37%) Maximo
5 2 (0.37%) Primavera
5 2 (0.37%) Shopify
6 1 (0.18%) Aladdin
6 1 (0.18%) Lorenzo
6 1 (0.18%) NetSuite
6 1 (0.18%) Oracle Financials
6 1 (0.18%) SAP ERP
6 1 (0.18%) Sparx Enterprise Architect
6 1 (0.18%) SystmOne
Cloud Services
1 84 (15.50%) Azure
2 53 (9.78%) Azure DevOps
3 48 (8.86%) Power Platform
4 37 (6.83%) SaaS
5 29 (5.35%) AWS
6 28 (5.17%) PaaS
7 24 (4.43%) IaaS
8 21 (3.87%) Microsoft 365
9 20 (3.69%) Azure Service Bus
10 19 (3.51%) Entra ID
11 18 (3.32%) Power Automate
12 17 (3.14%) Dynamics 365
13 16 (2.95%) Azure Monitor
14 15 (2.77%) Azure AI
14 15 (2.77%) Azure ExpressRoute
14 15 (2.77%) Azure Key Vault
15 10 (1.85%) Smartsheet
16 5 (0.92%) Miro
17 4 (0.74%) GCP
17 4 (0.74%) Serverless
Communications & Networking
1 23 (4.24%) Firewall
2 18 (3.32%) WAN
3 17 (3.14%) SD-WAN
4 15 (2.77%) DNS
4 15 (2.77%) VPN
5 7 (1.29%) Network Security
6 4 (0.74%) Cisco ISE
7 2 (0.37%) Profibus
8 1 (0.18%) HTTP
8 1 (0.18%) LAN
8 1 (0.18%) MPLS
8 1 (0.18%) VoIP
8 1 (0.18%) Wi-Fi
8 1 (0.18%) Wireless
Database & Business Intelligence
1 35 (6.46%) Power BI
2 20 (3.69%) MySQL
3 18 (3.32%) Data Lake
4 11 (2.03%) DTS
5 9 (1.66%) Data Warehouse
6 5 (0.92%) Relational Database
7 3 (0.55%) Oracle BI Publisher
7 3 (0.55%) SAP HANA
7 3 (0.55%) SQL Server
8 2 (0.37%) Amazon Aurora
8 2 (0.37%) Amazon Redshift
8 2 (0.37%) Apache Iceberg
8 2 (0.37%) Big Data
8 2 (0.37%) Data Vault
8 2 (0.37%) Electronic Patient Records
8 2 (0.37%) Metadata
9 1 (0.18%) Apache Cassandra
9 1 (0.18%) Elasticsearch
9 1 (0.18%) Oracle Database
9 1 (0.18%) PostgreSQL
Development Applications
1 115 (21.22%) JIRA
2 22 (4.06%) Rational DOORS
3 19 (3.51%) Git
4 6 (1.11%) Jenkins
5 5 (0.92%) SoapUI
6 4 (0.74%) Selenium
6 4 (0.74%) Team Foundation Server
6 4 (0.74%) TestRail
7 3 (0.55%) eCATT
7 3 (0.55%) Subversion
8 2 (0.37%) TestDirector
8 2 (0.37%) Zephyr
9 1 (0.18%) Cucumber
9 1 (0.18%) Eclipse
9 1 (0.18%) HP UFT
9 1 (0.18%) LoadRunner
9 1 (0.18%) mountebank
9 1 (0.18%) REST Assured
General
1 219 (40.41%) Social Skills
2 214 (39.48%) Finance
3 97 (17.90%) Analytical Skills
4 30 (5.54%) Retail
5 27 (4.98%) Law
6 26 (4.80%) Inclusion and Diversity
7 23 (4.24%) Banking
7 23 (4.24%) Influencing Skills
7 23 (4.24%) Manufacturing
8 22 (4.06%) Legal
9 21 (3.87%) Public Sector
10 20 (3.69%) Marketing
10 20 (3.69%) Presentation Skills
11 17 (3.14%) Documentation Skills
12 12 (2.21%) Games
12 12 (2.21%) Organisational Skills
13 11 (2.03%) Telecoms
14 10 (1.85%) Advertising
15 7 (1.29%) Financial Institution
15 7 (1.29%) Retail Banking
Job Titles
1 131 (24.17%) Project Manager
2 114 (21.03%) Analyst
3 92 (16.97%) Senior
4 85 (15.68%) Business Analyst
5 54 (9.96%) IT Manager
6 50 (9.23%) IT Project Manager
7 49 (9.04%) Architect
8 46 (8.49%) Lead
9 30 (5.54%) Senior Analyst
10 28 (5.17%) Senior Business Analyst
11 25 (4.61%) Senior Manager
12 21 (3.87%) Software Architect
13 20 (3.69%) IT Analyst
14 18 (3.32%) Developer
14 18 (3.32%) Principal Engineer
15 17 (3.14%) Programme Manager
16 16 (2.95%) Senior Project Manager
17 15 (2.77%) Appian Developer
17 15 (2.77%) Cloud Architect
18 13 (2.40%) Systems Manager
Libraries, Frameworks & Software Standards
1 24 (4.43%) Middleware
2 10 (1.85%) XML
3 8 (1.48%) .NET
3 8 (1.48%) RESTful
4 7 (1.29%) JSON
5 5 (0.92%) SAP Fiori
5 5 (0.92%) SOAP
6 4 (0.74%) .NET Framework
6 4 (0.74%) ADO
6 4 (0.74%) CSS
6 4 (0.74%) HTML
7 3 (0.55%) EDI
8 2 (0.37%) CakePHP
8 2 (0.37%) FHIR
8 2 (0.37%) Laravel
8 2 (0.37%) Oracle Fusion
8 2 (0.37%) Pandas
8 2 (0.37%) Playwright
8 2 (0.37%) REST
8 2 (0.37%) Web Services
Miscellaneous
1 22 (4.06%) Data Centre
2 17 (3.14%) Management Information System
2 17 (3.14%) NHS
3 12 (2.21%) Onboarding
4 11 (2.03%) Product Ownership
4 11 (2.03%) Virtual Team
5 10 (1.85%) Analytical Mindset
6 9 (1.66%) Cloud Native
6 9 (1.66%) Driving Licence
7 8 (1.48%) Legacy Systems
7 8 (1.48%) PMI
8 6 (1.11%) Foreign Exchange (FX)
8 6 (1.11%) Self-Motivation
8 6 (1.11%) Social Media
9 4 (0.74%) Marketing Technology
10 3 (0.55%) Data Protection Act
10 3 (0.55%) Enterprise Software
10 3 (0.55%) Life Science
11 2 (0.37%) Private Cloud
11 2 (0.37%) Public Cloud
Operating Systems
1 11 (2.03%) Windows
2 5 (0.92%) Windows Server
2 5 (0.92%) Windows Server 2019
3 1 (0.18%) VMS
Processes & Methodologies
1 526 (97.05%) Agile
2 212 (39.11%) Project Management
3 159 (29.34%) Project Delivery
4 154 (28.41%) Stakeholder Management
5 123 (22.69%) Continuous Improvement
6 114 (21.03%) DevOps
7 95 (17.53%) PRINCE2
8 89 (16.42%) Problem-Solving
9 88 (16.24%) Change Management
10 81 (14.94%) Stakeholder Engagement
11 80 (14.76%) Risk Management
12 78 (14.39%) SDLC
13 67 (12.36%) Mentoring
14 66 (12.18%) Business Case
15 63 (11.62%) Roadmaps
16 60 (11.07%) Computer Science
17 59 (10.89%) Business Analysis
18 58 (10.70%) UML
19 57 (10.52%) Scrum
20 53 (9.78%) AI
Programming Languages
1 51 (9.41%) SQL
2 21 (3.87%) Python
3 19 (3.51%) PowerShell
4 15 (2.77%) Ada
4 15 (2.77%) Bicep
4 15 (2.77%) C#
5 12 (2.21%) Ada 95
6 8 (1.48%) JavaScript
7 6 (1.11%) Bash
8 5 (0.92%) Java
8 5 (0.92%) R
9 3 (0.55%) PHP
10 2 (0.37%) Ladder Logic
11 1 (0.18%) C
11 1 (0.18%) Scala
Qualifications
1 156 (28.78%) Degree
2 67 (12.36%) BPSS Clearance
3 56 (10.33%) PMP
4 55 (10.15%) PMI Certification
5 40 (7.38%) Chartered Engineer
6 33 (6.09%) Security Cleared
7 31 (5.72%) Computer Science Degree
8 28 (5.17%) SC Cleared
9 24 (4.43%) Azure Certification
10 23 (4.24%) DBS Check
11 16 (2.95%) ISTQB
12 9 (1.66%) DV Cleared
13 7 (1.29%) ACCA
14 6 (1.11%) CBAP
14 6 (1.11%) CIMA
15 5 (0.92%) APMG
16 4 (0.74%) Numerate Degree
16 4 (0.74%) PRINCE2 Certification
17 3 (0.55%) IIBA
17 3 (0.55%) SAP Certification
Quality Assurance & Compliance
1 57 (10.52%) QA
2 53 (9.78%) PMO
3 50 (9.23%) ISO/IEC 12207
4 15 (2.77%) ISO/IEC 15288
5 11 (2.03%) Data Quality
6 10 (1.85%) MiFID
7 7 (1.29%) GDPR
8 6 (1.11%) Accessibility
9 4 (0.74%) ISO/IEC 27001
9 4 (0.74%) NCSC
9 4 (0.74%) PMBOK
10 3 (0.55%) P3O
11 2 (0.37%) Def Stans
11 2 (0.37%) EMIR
11 2 (0.37%) GxP
11 2 (0.37%) HL7
11 2 (0.37%) IEC 61131
11 2 (0.37%) UCITS
12 1 (0.18%) Cyber Essentials
12 1 (0.18%) Cyber Essentials PLUS
System Software
1 15 (2.77%) Virtual Machines
2 8 (1.48%) VMware Infrastructure
3 6 (1.11%) Active Directory
4 4 (0.74%) Terminal Server
5 3 (0.55%) Docker
6 1 (0.18%) Hyper-V
6 1 (0.18%) VMware ESXi
Systems Management
1 15 (2.77%) Single Sign-On
2 6 (1.11%) SCOM
3 5 (0.92%) SCCM
4 4 (0.74%) Microsoft Intune
5 1 (0.18%) Ansible
5 1 (0.18%) Kubernetes
5 1 (0.18%) Terraform
5 1 (0.18%) vCenter Server
Vendors
1 69 (12.73%) Microsoft
2 31 (5.72%) SAP
3 26 (4.80%) IBM
4 19 (3.51%) Salesforce
5 17 (3.14%) Meraki
6 15 (2.77%) Databricks
7 12 (2.21%) Dell
8 11 (2.03%) Oracle
8 11 (2.03%) Siemens
9 9 (1.66%) VMware
10 7 (1.29%) Cisco
11 6 (1.11%) iManage
11 6 (1.11%) MuleSoft
11 6 (1.11%) Workday
12 5 (0.92%) ServiceNow
13 4 (0.74%) Guidewire
13 4 (0.74%) JD Edwards
13 4 (0.74%) Juniper
13 4 (0.74%) McAfee
14 2 (0.37%) Bloomberg