MariaDB
UK

The following table provides summary statistics for permanent job vacancies with a requirement for MariaDB skills. Included is a benchmarking guide to the salaries offered in vacancies that have cited MariaDB over the 6 months to 4 December 2023 with a comparison to the same period in the previous 2 years.

6 months to
4 Dec 2023
Same period 2022 Same period 2021
Rank 687 925 666
Rank change year-on-year +238 -259 -25
Permanent jobs citing MariaDB 54 151 468
As % of all permanent jobs advertised in the UK 0.10% 0.12% 0.36%
As % of the Database & Business Intelligence category 0.48% 0.53% 1.34%
Number of salaries quoted 50 120 251
10th Percentile £42,375 £40,000 £37,500
25th Percentile £45,500 £45,000 £45,000
Median annual salary (50th Percentile) £53,500 £55,000 £60,000
Median % change year-on-year -2.73% -8.33% -
75th Percentile £58,750 £72,188 £71,250
90th Percentile £64,200 £92,625 £81,250
UK excluding London median annual salary £53,500 £52,500 £55,000
% change year-on-year +1.90% -4.55% -8.33%

All Database and Business Intelligence Skills
UK

MariaDB is in the Databases and Business Intelligence category. The following table is for comparison with the above and provides summary statistics for all permanent job vacancies with a requirement for database or business intelligence skills.

Permanent vacancies with a requirement for database or business intelligence skills 11,310 28,707 34,865
As % of all permanent jobs advertised in the UK 21.25% 23.16% 27.19%
Number of salaries quoted 8,502 17,521 22,585
10th Percentile £37,000 £36,750 £35,704
25th Percentile £46,906 £46,250 £42,500
Median annual salary (50th Percentile) £60,000 £62,500 £58,500
Median % change year-on-year -4.00% +6.84% +6.36%
75th Percentile £80,000 £82,500 £77,500
90th Percentile £95,000 £100,000 £95,000
UK excluding London median annual salary £55,000 £55,000 £50,000
% change year-on-year - +10.00% +2.04%

MariaDB
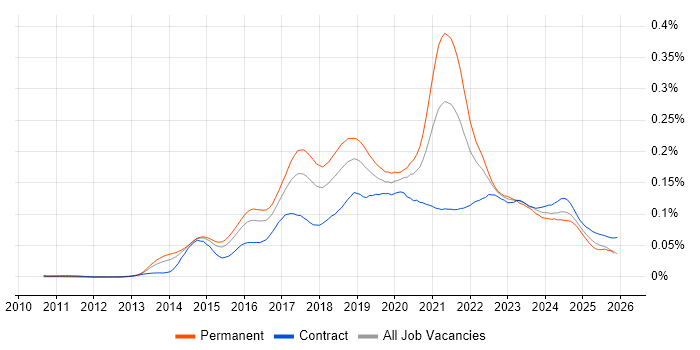
Job Vacancy Trend

Job postings citing MariaDB as a proportion of all IT jobs advertised.

Job vacancy trend for MariaDB in the UK

MariaDB
Salary Trend

3-month moving average salary quoted in jobs citing MariaDB.

Salary trend for MariaDB in the UK

MariaDB
Salary Histogram

Salary distribution for jobs citing MariaDB over the 6 months to 4 December 2023.

Salary histogram for MariaDB in the UK

MariaDB
Top 14 Job Locations

The table below looks at the demand and provides a guide to the median salaries quoted in IT jobs citing MariaDB within the UK over the 6 months to 4 December 2023. The 'Rank Change' column provides an indication of the change in demand within each location based on the same 6 month period last year.

Location Rank Change
on Same Period
Last Year
Matching
Permanent
IT Job Ads
Median Salary
Past 6 Months
Median Salary
% Change
on Same Period
Last Year
Live
Jobs
England +250 49 £53,500 -2.73% 49
UK excluding London +207 46 £53,500 +1.90% 46
Work from Home +179 30 £53,500 -10.83% 130
South East +151 23 £53,500 +1.90% 12
North of England +145 9 £50,000 -23.08% 10
North West +101 8 £52,500 -22.22% 4
London +224 7 £85,000 +21.43% 17
Midlands +123 5 £50,000 -16.67% 9
West Midlands +132 4 £52,500 -12.50% 5
South West +70 4 £52,750 +17.22% 3
Scotland - 4 £55,000 - 11
Yorkshire +92 1 £45,000 -30.77% 5
Wales +21 1 - - 1
East Midlands - 1 £49,000 - 4

MariaDB
Co-occurring Skills and Capabilities by Category

The follow tables expand on the table above by listing co-occurrences grouped by category. The same employment type, locality and period is covered with up to 20 co-occurrences shown in each of the following categories:

Application Platforms
1 9 (16.67%) CMS
2 4 (7.41%) OpenStack
3 3 (5.56%) Appian
4 1 (1.85%) Confluence
4 1 (1.85%) SAS
Cloud Services
1 20 (37.04%) AWS
2 18 (33.33%) SaaS
3 13 (24.07%) Cloud Computing
4 12 (22.22%) Azure
5 5 (9.26%) Microsoft 365
6 2 (3.70%) Azure Cosmos DB
6 2 (3.70%) npm
6 2 (3.70%) Power Platform
6 2 (3.70%) WhatsApp
7 1 (1.85%) Amazon Kinesis
7 1 (1.85%) Azure AKS
7 1 (1.85%) Azure Data Factory
7 1 (1.85%) Azure Synapse Analytics
7 1 (1.85%) Cohesity
7 1 (1.85%) Entra ID
7 1 (1.85%) GitHub
7 1 (1.85%) IaaS
7 1 (1.85%) OpenShift
7 1 (1.85%) PaaS
7 1 (1.85%) Snowflake
Communications & Networking
1 5 (9.26%) WAN
2 4 (7.41%) LAN
2 4 (7.41%) NAS
2 4 (7.41%) TCP/IP
2 4 (7.41%) VPN
3 3 (5.56%) iSCSI
3 3 (5.56%) VLAN
4 2 (3.70%) BGP
4 2 (3.70%) Intrusion Detection
4 2 (3.70%) ISDN
4 2 (3.70%) OSPF
4 2 (3.70%) PBX
4 2 (3.70%) Remote Desktop
4 2 (3.70%) SAN
4 2 (3.70%) VoIP
4 2 (3.70%) VSAN
4 2 (3.70%) Wi-Fi
4 2 (3.70%) WLAN
5 1 (1.85%) ADSL
5 1 (1.85%) MPLS
Database & Business Intelligence
1 48 (88.89%) MySQL
2 18 (33.33%) SQL Server
3 9 (16.67%) Relational Database
4 8 (14.81%) PostgreSQL
5 7 (12.96%) MongoDB
5 7 (12.96%) OLTP
5 7 (12.96%) RDBMS
6 6 (11.11%) InfluxDB
7 3 (5.56%) Redis
8 2 (3.70%) Azure SQL Data Warehouse
8 2 (3.70%) Azure SQL Database
8 2 (3.70%) Data Warehouse
8 2 (3.70%) NoSQL
8 2 (3.70%) Power BI
9 1 (1.85%) Amazon Aurora
9 1 (1.85%) Amazon Redshift
9 1 (1.85%) Dremio
9 1 (1.85%) Metadata
9 1 (1.85%) MySQL Workbench
9 1 (1.85%) Tableau
Development Applications
1 14 (25.93%) JIRA
2 7 (12.96%) Jenkins
3 6 (11.11%) Git
4 2 (3.70%) ESLint
5 1 (1.85%) DBeaver
5 1 (1.85%) Liquibase
5 1 (1.85%) Octopus Deploy
5 1 (1.85%) TeamCity
General
1 20 (37.04%) Social Skills
2 5 (9.26%) Games
3 4 (7.41%) Analytical Skills
3 4 (7.41%) Inclusion and Diversity
4 3 (5.56%) Finance
5 2 (3.70%) Legal
5 2 (3.70%) Marketing
6 1 (1.85%) Back Office
6 1 (1.85%) Banking
6 1 (1.85%) Documentation Skills
6 1 (1.85%) Organisational Skills
6 1 (1.85%) Retail
6 1 (1.85%) Tech for Good
Job Titles
1 31 (57.41%) Developer
2 23 (42.59%) PHP Developer
3 9 (16.67%) DBA
4 6 (11.11%) MySQL DBA
5 5 (9.26%) Database Developer
6 4 (7.41%) Lead
7 3 (5.56%) Full Stack Developer
7 3 (5.56%) Lead Developer
7 3 (5.56%) Lead PHP Developer
7 3 (5.56%) Systems Engineer
8 2 (3.70%) Infrastructure Engineer
8 2 (3.70%) Linux Engineer
8 2 (3.70%) MySQL Developer
8 2 (3.70%) Network Engineer
8 2 (3.70%) Network Systems Engineer
8 2 (3.70%) Senior
9 1 (1.85%) Appian Developer
9 1 (1.85%) Azure Platform Engineer
9 1 (1.85%) Kubernetes Engineer
9 1 (1.85%) Senior DevOps
Libraries, Frameworks & Software Standards
1 22 (40.74%) Laravel
2 20 (37.04%) Vue
3 14 (25.93%) jQuery
3 14 (25.93%) REST
4 13 (24.07%) SOAP
5 12 (22.22%) CSS
6 11 (20.37%) HTML
7 6 (11.11%) Symfony
8 3 (5.56%) Yii
9 2 (3.70%) .NET
9 2 (3.70%) CSS3
9 2 (3.70%) Elastic Stack
9 2 (3.70%) GraphQL
9 2 (3.70%) gRPC
9 2 (3.70%) HTML5
9 2 (3.70%) Node.js
9 2 (3.70%) Web Services
10 1 (1.85%) Blazor
10 1 (1.85%) FastAPI
10 1 (1.85%) XML
Miscellaneous
1 4 (7.41%) Replication
2 3 (5.56%) Distributed Systems
2 3 (5.56%) Greenfield Project
2 3 (5.56%) PKI
3 2 (3.70%) Algorithms
3 2 (3.70%) CCTV
3 2 (3.70%) Cloud Native
3 2 (3.70%) Data Structures
3 2 (3.70%) Marketing Technology
4 1 (1.85%) Derivative
4 1 (1.85%) Enterprise Software
4 1 (1.85%) Low-Code
4 1 (1.85%) Private Cloud
4 1 (1.85%) Renewable Energy
Operating Systems
1 18 (33.33%) Linux
2 7 (12.96%) Windows
3 6 (11.11%) CentOS
4 4 (7.41%) Red Hat Enterprise Linux
5 3 (5.56%) Windows 10
5 3 (5.56%) Windows Server 2012
5 3 (5.56%) Windows Server 2016
5 3 (5.56%) Windows Server 2019
6 2 (3.70%) Ubuntu
6 2 (3.70%) Windows Server
7 1 (1.85%) Debian
7 1 (1.85%) Unix
Processes & Methodologies
1 27 (50.00%) Agile
2 16 (29.63%) MVC
2 16 (29.63%) OOP
3 13 (24.07%) OO
3 13 (24.07%) OO PHP
3 13 (24.07%) Unit Testing
3 13 (24.07%) Web Development
4 9 (16.67%) CRM
4 9 (16.67%) Performance Optimisation
5 6 (11.11%) Continuous Improvement
6 5 (9.26%) CI/CD
7 4 (7.41%) Business Intelligence
7 4 (7.41%) Mentoring
7 4 (7.41%) Problem-Solving
7 4 (7.41%) Scrum
7 4 (7.41%) SDLC
8 3 (5.56%) Continuous Delivery
8 3 (5.56%) Continuous Integration
8 3 (5.56%) DevOps
8 3 (5.56%) Technical Architecture
Programming Languages
1 24 (44.44%) JavaScript
1 24 (44.44%) PHP
2 15 (27.78%) SQL
3 7 (12.96%) Python
4 3 (5.56%) Bash
5 2 (3.70%) C#
5 2 (3.70%) Go
5 2 (3.70%) PowerShell
5 2 (3.70%) TypeScript
6 1 (1.85%) Data Analysis Expressions
6 1 (1.85%) Java
6 1 (1.85%) Perl
6 1 (1.85%) PL/SQL
6 1 (1.85%) R
6 1 (1.85%) Scala
6 1 (1.85%) T-SQL
6 1 (1.85%) XMLA
Qualifications
1 6 (11.11%) Security Cleared
2 5 (9.26%) Degree
3 4 (7.41%) SC Cleared
4 3 (5.56%) DV Cleared
5 2 (3.70%) CCNA
5 2 (3.70%) Cisco Certification
5 2 (3.70%) JNCIA
5 2 (3.70%) Master's Degree
5 2 (3.70%) Microsoft Certification
Quality Assurance & Compliance
1 2 (3.70%) ISO 9001
1 2 (3.70%) ISO/IEC 27001
1 2 (3.70%) QA
2 1 (1.85%) ISO/IEC 20000
System Software
1 7 (12.96%) Active Directory
1 7 (12.96%) Docker
1 7 (12.96%) VMware Infrastructure
2 5 (9.26%) Citrix Hypervisor
2 5 (9.26%) Hyper-V
3 3 (5.56%) vSphere
4 2 (3.70%) Firmware
4 2 (3.70%) pfSense
4 2 (3.70%) Virtual Servers
5 1 (1.85%) Ceph
5 1 (1.85%) KVM
5 1 (1.85%) QEMU
Systems Management
1 9 (16.67%) Ansible
1 9 (16.67%) Terraform
2 5 (9.26%) Kubernetes
3 2 (3.70%) Dell DRAC
3 2 (3.70%) Proxmox
3 2 (3.70%) Puppet
4 1 (1.85%) Active Directory Federation Services
4 1 (1.85%) Grafana
4 1 (1.85%) HAProxy
4 1 (1.85%) Kibana
4 1 (1.85%) Nagios
4 1 (1.85%) Packer
4 1 (1.85%) Prometheus
4 1 (1.85%) Red Hat Satellite
4 1 (1.85%) Red Hat Spacewalk
4 1 (1.85%) SCOM
Vendors
1 7 (12.96%) Microsoft
1 7 (12.96%) VMware
2 6 (11.11%) Cisco
3 4 (7.41%) Fortinet
3 4 (7.41%) Juniper
3 4 (7.41%) Oracle
4 3 (5.56%) Dell
4 3 (5.56%) Rollbar
5 2 (3.70%) Aruba
5 2 (3.70%) Meraki
5 2 (3.70%) MikroTik
5 2 (3.70%) Mitel
5 2 (3.70%) QNAP
5 2 (3.70%) Red Hat
5 2 (3.70%) Splunk
5 2 (3.70%) Ubiquiti
5 2 (3.70%) Veeam
6 1 (1.85%) Barracuda Networks
6 1 (1.85%) Dynatrace
6 1 (1.85%) SonicWALL