PHP
UK

The table below provides summary statistics for permanent job vacancies requiring PHP skills. It includes a benchmarking guide to the annual salaries offered in vacancies that cited PHP over the 6 months leading up to 2 April 2025, comparing them to the same period in the previous two years.

6 months to
2 Apr 2025
Same period 2024 Same period 2023
Rank 222 153 170
Rank change year-on-year -69 +17 -75
Permanent jobs citing PHP 676 1,814 2,451
As % of all permanent jobs advertised in the UK 1.34% 1.96% 2.22%
As % of the Programming Languages category 4.39% 5.62% 5.08%
Number of salaries quoted 617 1,650 1,692
10th Percentile £30,500 £31,250 £36,250
25th Percentile £37,500 £37,500 £42,500
Median annual salary (50th Percentile) £52,500 £50,000 £55,000
Median % change year-on-year +5.00% -9.09% +10.00%
75th Percentile £67,500 £63,039 £67,500
90th Percentile £78,750 £77,500 £87,500
UK excluding London median annual salary £50,000 £47,500 £50,000
% change year-on-year +5.26% -5.00% -

All Programming Languages
UK

PHP falls under the Programming Languages category. For comparison with the information above, the following table provides summary statistics for all permanent job vacancies requiring coding skills.

Permanent vacancies with a requirement for coding skills 15,411 32,300 48,242
As % of all permanent jobs advertised in the UK 30.49% 34.86% 43.62%
Number of salaries quoted 11,524 24,726 30,584
10th Percentile £37,500 £35,505 £38,750
25th Percentile £47,683 £45,000 £48,750
Median annual salary (50th Percentile) £60,000 £60,000 £65,000
Median % change year-on-year - -7.69% +4.00%
75th Percentile £82,500 £78,750 £86,250
90th Percentile £107,500 £100,000 £105,000
UK excluding London median annual salary £55,000 £54,000 £55,000
% change year-on-year +1.85% -1.82% +3.14%

PHP
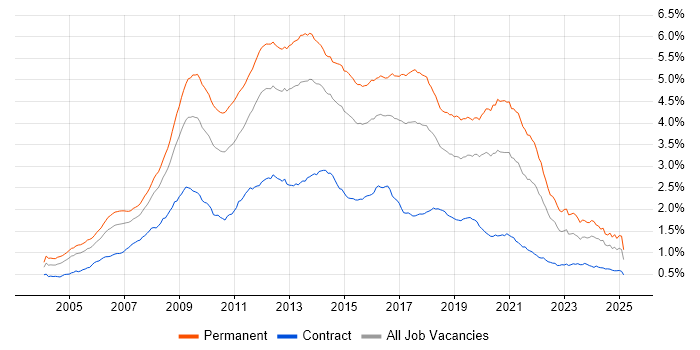
Job Vacancy Trend

Job postings citing PHP as a proportion of all IT jobs advertised.

Job vacancy trend for PHP in the UK

PHP
Salary Trend

3-month moving average salary quoted in jobs citing PHP.

Salary trend for PHP in the UK

PHP
Salary Histogram

Salary distribution for jobs citing PHP over the 6 months to 2 April 2025.

Salary histogram for PHP in the UK

PHP
Top 17 Job Locations

The table below looks at the demand and provides a guide to the median salaries quoted in IT jobs citing PHP within the UK over the 6 months to 2 April 2025. The 'Rank Change' column provides an indication of the change in demand within each location based on the same 6 month period last year.

Location Rank Change
on Same Period
Last Year
Matching
Permanent
IT Job Ads
Median Salary
Past 6 Months
Median Salary
% Change
on Same Period
Last Year
Live
Jobs
England -91 600 £52,500 +5.00% 421
UK excluding London -42 535 £50,000 +5.26% 240
Work from Home -19 343 £52,500 - 268
North of England -77 136 £52,500 +10.53% 65
London -66 118 £57,500 -9.04% 205
South East +6 117 £50,000 -9.09% 61
South West -3 95 £60,000 +33.33% 33
North West -74 79 £52,500 +5.00% 45
Midlands -49 70 £40,000 -11.11% 46
East of England -27 57 £38,000 -5.00% 21
Yorkshire -40 41 £47,500 - 17
West Midlands -29 38 £55,000 +22.22% 28
Scotland +103 33 £55,000 +15.79% 11
East Midlands -18 31 £35,000 -22.22% 18
Wales +24 24 £32,500 -35.00% 4
North East +35 16 £55,000 +18.28% 3
Northern Ireland +34 3 £85,000 +88.89% 1

PHP
Co-occurring Skills and Capabilities by Category

The follow tables expand on the table above by listing co-occurrences grouped by category. The same employment type, locality and period is covered with up to 20 co-occurrences shown in each of the following categories:

Application Platforms
1 84 (12.43%) WordPress
2 81 (11.98%) CMS
3 20 (2.96%) Drupal
4 18 (2.66%) nginx
5 15 (2.22%) Apache
6 12 (1.78%) Apache Solr
7 4 (0.59%) Joomla!
8 3 (0.44%) ColdFusion
8 3 (0.44%) IIS
8 3 (0.44%) SharePoint
9 2 (0.30%) Confluence
10 1 (0.15%) Cloud Foundry
10 1 (0.15%) Headless CMS
10 1 (0.15%) Kentico
10 1 (0.15%) SAS
10 1 (0.15%) Tomcat
10 1 (0.15%) Umbraco
Applications
1 11 (1.63%) Microsoft Office
2 10 (1.48%) Photoshop
3 5 (0.74%) Adobe XD
4 4 (0.59%) Adobe Illustrator
4 4 (0.59%) Adobe Premiere
4 4 (0.59%) Microsoft Excel
5 2 (0.30%) Trello
6 1 (0.15%) InVision
6 1 (0.15%) Microsoft PowerPoint
6 1 (0.15%) MS Visio
6 1 (0.15%) Sketch
6 1 (0.15%) SPSS
6 1 (0.15%) Zeplin
Business Applications
1 26 (3.85%) Shopify
2 13 (1.92%) Magento
3 10 (1.48%) Payment Gateway
4 9 (1.33%) NetSuite
5 2 (0.30%) Dynamics CRM
5 2 (0.30%) Odoo
5 2 (0.30%) SAP Oil and Gas
6 1 (0.15%) SAP Business One
Cloud Services
1 222 (32.84%) AWS
2 96 (14.20%) Azure
3 81 (11.98%) GCP
4 75 (11.09%) GitHub
5 46 (6.80%) SaaS
6 35 (5.18%) Serverless
7 23 (3.40%) Azure DevOps
8 21 (3.11%) AWS Lambda
9 19 (2.81%) Slack
10 17 (2.51%) Zapier
11 16 (2.37%) npm
12 13 (1.92%) Amazon S3
12 13 (1.92%) Google Analytics
13 11 (1.63%) Amazon EC2
14 9 (1.33%) Salesforce Commerce Cloud
15 8 (1.18%) Figma
15 8 (1.18%) Stripe
16 7 (1.04%) Amazon ECS
16 7 (1.04%) Amazon SQS
16 7 (1.04%) Power Platform
Communications & Networking
1 17 (2.51%) Internet
2 16 (2.37%) DNS
3 15 (2.22%) TCP/IP
4 14 (2.07%) HTTPS
5 12 (1.78%) IPsec
6 4 (0.59%) HTTP
6 4 (0.59%) Network Security
7 3 (0.44%) Wireshark
8 2 (0.30%) FTP
8 2 (0.30%) Intrusion Detection
8 2 (0.30%) LoRaWAN
8 2 (0.30%) SSH
8 2 (0.30%) SSL
8 2 (0.30%) Wi-Fi
9 1 (0.15%) Bluetooth
9 1 (0.15%) Broadband
9 1 (0.15%) Multicast
9 1 (0.15%) RTP
9 1 (0.15%) RTSP
9 1 (0.15%) tcpdump
Database & Business Intelligence
1 358 (52.96%) MySQL
2 95 (14.05%) SQL Server
3 38 (5.62%) PostgreSQL
4 25 (3.70%) MongoDB
5 24 (3.55%) Relational Database
6 20 (2.96%) NoSQL
7 15 (2.22%) SQLite
8 14 (2.07%) Azure SQL Database
9 13 (1.92%) Amazon RDS
10 12 (1.78%) Couchbase
11 9 (1.33%) Redis
12 8 (1.18%) RDBMS
13 7 (1.04%) MariaDB
14 5 (0.74%) Power BI
15 4 (0.59%) Big Data
15 4 (0.59%) TimescaleDB
16 3 (0.44%) Amazon Aurora
16 3 (0.44%) Data Warehouse
16 3 (0.44%) OLTP
17 2 (0.30%) Data Mining
Development Applications
1 226 (33.43%) Git
2 28 (4.14%) JIRA
3 20 (2.96%) Selenium
4 18 (2.66%) Bitbucket
5 16 (2.37%) webpack
6 15 (2.22%) Jenkins
7 13 (1.92%) Grunt
8 11 (1.63%) PHPUnit
9 10 (1.48%) Cypress.io
10 7 (1.04%) Postman
11 5 (0.74%) Cucumber
11 5 (0.74%) SoapUI
12 4 (0.59%) git-flow
12 4 (0.59%) GitLab
12 4 (0.59%) Subversion
13 3 (0.44%) Jasmine
13 3 (0.44%) Mocha
13 3 (0.44%) Vite
14 2 (0.30%) Octopus Deploy
14 2 (0.30%) Visual Studio
General
1 186 (27.51%) Social Skills
2 107 (15.83%) Finance
3 88 (13.02%) Games
4 40 (5.92%) Marketing
5 38 (5.62%) Analytical Skills
6 30 (4.44%) Retail
7 17 (2.51%) Organisational Skills
7 17 (2.51%) Pharmaceutical
8 15 (2.22%) Manufacturing
9 13 (1.92%) Inclusion and Diversity
10 10 (1.48%) Law
11 8 (1.18%) Back Office
11 8 (1.18%) Telecoms
12 7 (1.04%) Turkish Language
13 5 (0.74%) Health Technology
13 5 (0.74%) Tech for Good
14 4 (0.59%) Automotive
14 4 (0.59%) Documentation Skills
14 4 (0.59%) Influencing Skills
14 4 (0.59%) Public Sector
Job Titles
1 445 (65.83%) Developer
2 211 (31.21%) PHP Developer
3 195 (28.85%) Senior
4 128 (18.93%) Senior Developer
5 74 (10.95%) Software Engineer
6 67 (9.91%) Web Developer
7 60 (8.88%) Full-Stack Developer
8 57 (8.43%) Lead
8 57 (8.43%) Senior PHP Developer
9 41 (6.07%) PHP Software Engineer
10 39 (5.77%) Graduate
10 39 (5.77%) Graduate Developer
11 36 (5.33%) IT Graduate
12 32 (4.73%) Front-End Developer (Client-Side Developer)
13 31 (4.59%) Senior Software Engineer
14 30 (4.44%) Junior
15 25 (3.70%) Junior Developer
16 22 (3.25%) PHP Web Developer
17 21 (3.11%) Full-Stack PHP Developer
17 21 (3.11%) Software Developer
Libraries, Frameworks & Software Standards
1 324 (47.93%) CSS
2 298 (44.08%) HTML
3 285 (42.16%) Laravel
4 147 (21.75%) React
5 113 (16.72%) Vue
6 97 (14.35%) LAMP
7 90 (13.31%) .NET
8 75 (11.09%) jQuery
9 74 (10.95%) Symfony
10 70 (10.36%) AngularJS
11 67 (9.91%) Node.js
12 56 (8.28%) HTML5
13 54 (7.99%) ASP.NET
14 47 (6.95%) CSS3
15 46 (6.80%) RESTful
16 41 (6.07%) Sass
17 35 (5.18%) Web Services
18 27 (3.99%) CakePHP
19 20 (2.96%) Tailwind CSS
20 19 (2.81%) LESS
Miscellaneous
1 51 (7.54%) Mobile App
2 34 (5.03%) Greenfield Project
3 17 (2.51%) IoT
4 15 (2.22%) Legacy Code
4 15 (2.22%) Onboarding
5 13 (1.92%) Product Ownership
5 13 (1.92%) Virtual Team
6 11 (1.63%) Cloud Native
7 9 (1.33%) Renewable Energy
8 8 (1.18%) Enterprise Software
9 7 (1.04%) Learning Management System
9 7 (1.04%) Self-Motivation
10 6 (0.89%) Legacy Systems
10 6 (0.89%) Linux Command Line
11 5 (0.74%) Educational Technology
11 5 (0.74%) Online Games
12 4 (0.59%) Blog
13 3 (0.44%) Client/Server
13 3 (0.44%) NHS
13 3 (0.44%) Robotics
Operating Systems
1 51 (7.54%) Linux
2 19 (2.81%) Windows
3 14 (2.07%) Android
3 14 (2.07%) Apple iOS
4 7 (1.04%) Unix
5 5 (0.74%) CentOS
6 3 (0.44%) Red Hat Enterprise Linux
6 3 (0.44%) Ubuntu
7 2 (0.30%) AIX
7 2 (0.30%) Oracle Linux
8 1 (0.15%) Debian
8 1 (0.15%) Rocky
8 1 (0.15%) Windows Server
Processes & Methodologies
1 193 (28.55%) Agile
1 193 (28.55%) E-Commerce
2 180 (26.63%) Web Development
3 174 (25.74%) Problem-Solving
4 161 (23.82%) Software Engineering
5 141 (20.86%) MVC
6 133 (19.67%) OOP
7 119 (17.60%) Full-Stack Development
8 106 (15.68%) Computer Science
9 87 (12.87%) User Experience
10 86 (12.72%) OO
11 84 (12.43%) Mentoring
12 83 (12.28%) DevOps
13 77 (11.39%) Front End Development
13 77 (11.39%) TDD
14 70 (10.36%) CI/CD
15 62 (9.17%) Continuous Improvement
16 53 (7.84%) Microservices
16 53 (7.84%) Project Management
17 50 (7.40%) SEO
Programming Languages
1 363 (53.70%) JavaScript
2 121 (17.90%) SQL
3 94 (13.91%) Java
4 83 (12.28%) Python
5 80 (11.83%) C#
6 75 (11.09%) TypeScript
7 61 (9.02%) C++
8 37 (5.47%) Go
9 24 (3.55%) C
10 17 (2.51%) T-SQL
11 14 (2.07%) Objective-C
12 7 (1.04%) Perl
13 4 (0.59%) Bash
13 4 (0.59%) Kotlin
13 4 (0.59%) Scala
13 4 (0.59%) VB
14 3 (0.44%) R
14 3 (0.44%) Ruby
15 2 (0.30%) AWK
15 2 (0.30%) Korn
Qualifications
1 109 (16.12%) Degree
2 78 (11.54%) Computer Science Degree
3 14 (2.07%) Microsoft Certification
4 5 (0.74%) DBS Check
5 3 (0.44%) DV Cleared
5 3 (0.44%) Security Cleared
6 2 (0.30%) Master's Degree
7 1 (0.15%) HND
7 1 (0.15%) Postgraduate
7 1 (0.15%) SC Cleared
Quality Assurance & Compliance
1 48 (7.10%) QA
2 39 (5.77%) Accessibility
3 23 (3.40%) WCAG
4 9 (1.33%) GDPR
5 8 (1.18%) ISO/IEC 27001
6 4 (0.59%) GMP
7 2 (0.30%) Data Quality
8 1 (0.15%) ISO 9001
8 1 (0.15%) SLA
System Software
1 77 (11.39%) Docker
2 3 (0.44%) Active Directory
2 3 (0.44%) Samba
3 2 (0.30%) KVM
3 2 (0.30%) Postfix
3 2 (0.30%) Sendmail
4 1 (0.15%) Embedded Firmware
4 1 (0.15%) Firmware
4 1 (0.15%) Xen
Systems Management
1 35 (5.18%) Kubernetes
2 26 (3.85%) Terraform
3 15 (2.22%) Ansible
4 4 (0.59%) Grafana
5 3 (0.44%) Puppet
6 2 (0.30%) cPanel
6 2 (0.30%) Nagios
6 2 (0.30%) Nessus
6 2 (0.30%) Prometheus
7 1 (0.15%) Progress Chef
Vendors
1 52 (7.69%) Microsoft
2 26 (3.85%) Google
3 23 (3.40%) Twitter
4 22 (3.25%) Adobe
5 21 (3.11%) WooCommerce
6 14 (2.07%) Xamarin
7 9 (1.33%) New Relic
8 8 (1.18%) SAP
9 5 (0.74%) OpenAI
9 5 (0.74%) Salesforce
10 4 (0.59%) Ahrefs
10 4 (0.59%) Apple
10 4 (0.59%) Red Hat
10 4 (0.59%) Screaming Frog
11 3 (0.44%) HubSpot
11 3 (0.44%) Oracle
11 3 (0.44%) Sage
12 2 (0.30%) IBM
12 2 (0.30%) Zend
12 2 (0.30%) Zoho