MySQL
UK

The following table provides summary statistics for permanent job vacancies with a requirement for MySQL skills. Included is a benchmarking guide to the salaries offered in vacancies that have cited MySQL over the 6 months to 26 April 2024 with a comparison to the same period in the previous 2 years.

6 months to
26 Apr 2024
Same period 2023 Same period 2022
Rank 158 161 81
Rank change year-on-year +3 -80 -11
Permanent jobs citing MySQL 1,804 2,427 6,643
As % of all permanent jobs advertised in the UK 1.84% 2.32% 4.31%
As % of the Database & Business Intelligence category 9.96% 10.69% 15.59%
Number of salaries quoted 1,570 1,397 2,957
10th Percentile £33,750 £36,250 £32,500
25th Percentile £41,250 £45,000 £42,500
Median annual salary (50th Percentile) £52,500 £57,500 £55,000
Median % change year-on-year -8.70% +4.55% +10.00%
75th Percentile £69,500 £77,500 £71,250
90th Percentile £85,000 £93,750 £85,000
UK excluding London median annual salary £50,000 £52,500 £50,000
% change year-on-year -4.76% +5.00% +13.64%

All Database and Business Intelligence Skills
UK

MySQL is in the Databases and Business Intelligence category. The following table is for comparison with the above and provides summary statistics for all permanent job vacancies with a requirement for database or business intelligence skills.

Permanent vacancies with a requirement for database or business intelligence skills 18,115 22,699 42,603
As % of all permanent jobs advertised in the UK 18.45% 21.66% 27.64%
Number of salaries quoted 12,588 14,042 21,422
10th Percentile £35,000 £37,500 £36,250
25th Percentile £42,725 £47,500 £45,000
Median annual salary (50th Percentile) £57,500 £65,000 £60,000
Median % change year-on-year -11.54% +8.33% +9.09%
75th Percentile £76,250 £83,750 £78,750
90th Percentile £95,000 £103,750 £95,000
UK excluding London median annual salary £52,500 £55,000 £52,106
% change year-on-year -4.55% +5.56% +6.88%

MySQL
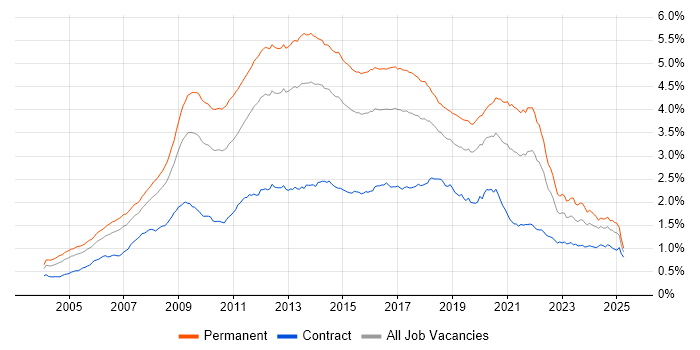
Job Vacancy Trend

Job postings citing MySQL as a proportion of all IT jobs advertised.

Job vacancy trend for MySQL in the UK

MySQL
Salary Trend

3-month moving average salary quoted in jobs citing MySQL.

Salary trend for MySQL in the UK

MySQL
Salary Histogram

Salary distribution for jobs citing MySQL over the 6 months to 26 April 2024.

Salary histogram for MySQL in the UK

MySQL
Top 17 Job Locations

The table below looks at the demand and provides a guide to the median salaries quoted in IT jobs citing MySQL within the UK over the 6 months to 26 April 2024. The 'Rank Change' column provides an indication of the change in demand within each location based on the same 6 month period last year.

Location Rank Change
on Same Period
Last Year
Matching
Permanent
IT Job Ads
Median Salary
Past 6 Months
Median Salary
% Change
on Same Period
Last Year
Live
Jobs
England +7 1,619 £53,500 -6.96% 396
UK excluding London -4 1,379 £50,000 -4.76% 282
Work from Home +5 816 £57,500 - 244
North of England +77 456 £52,500 +8.76% 90
London -34 354 £70,000 -6.67% 130
South East -19 273 £51,000 -4.67% 45
North West +64 241 £52,500 +0.48% 42
South West 0 222 £47,500 - 48
Midlands -46 165 £50,000 -9.09% 55
Yorkshire +76 147 £47,500 +5.56% 33
East of England +5 137 £47,500 -26.92% 29
West Midlands -29 93 £50,000 -11.47% 33
Scotland -57 81 £47,500 +5.56% 11
North East +22 70 £62,500 +56.25% 15
East Midlands -35 68 £45,000 -14.29% 22
Wales +9 38 £52,101 -13.17% 6
Northern Ireland +5 8 £105,000 +153.01% 6

MySQL
Co-occurring Skills and Capabilities by Category

The follow tables expand on the table above by listing co-occurrences grouped by category. The same employment type, locality and period is covered with up to 20 co-occurrences shown in each of the following categories:

Application Platforms
1 97 (5.38%) WordPress
2 78 (4.32%) Apache
3 67 (3.71%) nginx
4 49 (2.72%) Confluence
5 46 (2.55%) CMS
6 32 (1.77%) SharePoint
7 26 (1.44%) Apache Spark
7 26 (1.44%) Drupal
8 23 (1.27%) Tomcat
9 15 (0.83%) IIS
9 15 (0.83%) Microsoft Exchange
10 13 (0.72%) ArcGIS
11 9 (0.50%) Apache Solr
12 7 (0.39%) MQSeries
13 6 (0.33%) OpenStack
14 5 (0.28%) Apache Airflow
14 5 (0.28%) ColdFusion
15 4 (0.22%) Headless CMS
16 3 (0.17%) Oracle HTTP Server
16 3 (0.17%) WebSphere
Applications
1 21 (1.16%) Microsoft Excel
2 9 (0.50%) Microsoft Office
3 8 (0.44%) Adobe XD
4 6 (0.33%) Chatbot
5 4 (0.22%) Adobe Illustrator
5 4 (0.22%) Photoshop
6 2 (0.11%) FileZilla
6 2 (0.11%) Sketch
7 1 (0.055%) Microsoft PowerPoint
7 1 (0.055%) Microsoft Project
7 1 (0.055%) MicroStation
7 1 (0.055%) MS Visio
7 1 (0.055%) Notion
7 1 (0.055%) Spreadsheet
7 1 (0.055%) SPSS
Business Applications
1 30 (1.66%) Magento
2 15 (0.83%) Shopify
3 9 (0.50%) Elite 3E
3 9 (0.50%) Remedy ITSM
4 6 (0.33%) Payment Gateway
5 5 (0.28%) NetSuite
6 4 (0.22%) Salesforce CRM
7 3 (0.17%) iTrent
7 3 (0.17%) Maximo
8 2 (0.11%) Sparx Enterprise Architect
8 2 (0.11%) Unit4 Business World
8 2 (0.11%) Visualfiles
9 1 (0.055%) Dynamics CRM
9 1 (0.055%) Oracle EBS
9 1 (0.055%) Relativity
9 1 (0.055%) Sage X3
9 1 (0.055%) Veritas eDiscovery
Cloud Services
1 695 (38.53%) AWS
2 319 (17.68%) Azure
3 155 (8.59%) SaaS
4 129 (7.15%) GCP
5 128 (7.10%) GitHub
6 118 (6.54%) Serverless
7 85 (4.71%) AWS Lambda
8 79 (4.38%) Amazon S3
9 66 (3.66%) Amazon EC2
10 59 (3.27%) Power Platform
11 57 (3.16%) Microsoft 365
12 48 (2.66%) Azure DevOps
13 39 (2.16%) Amazon Kinesis
13 39 (2.16%) GitHub Actions
14 26 (1.44%) Azure Cosmos DB
15 24 (1.33%) Amazon ECS
16 23 (1.27%) Cloud Computing
17 22 (1.22%) Amazon SQS
18 21 (1.16%) PaaS
19 20 (1.11%) AWS CloudFormation
Communications & Networking
1 84 (4.66%) Firewall
2 55 (3.05%) DNS
3 47 (2.61%) TCP/IP
4 25 (1.39%) HTTP
5 23 (1.27%) Internet
5 23 (1.27%) SNMP
6 21 (1.16%) SSL
7 19 (1.05%) SSH
8 18 (1.00%) PBX
8 18 (1.00%) SAN
9 17 (0.94%) LAN
10 16 (0.89%) VoIP
11 14 (0.78%) VPN
12 11 (0.61%) DHCP
12 11 (0.61%) WAN
13 10 (0.55%) tcpdump
14 8 (0.44%) MQTT
14 8 (0.44%) Wi-Fi
14 8 (0.44%) WLAN
15 7 (0.39%) SMTP
Database & Business Intelligence
1 357 (19.79%) PostgreSQL
2 312 (17.29%) SQL Server
3 274 (15.19%) Relational Database
4 216 (11.97%) MongoDB
5 155 (8.59%) NoSQL
6 115 (6.37%) Redis
7 85 (4.71%) Amazon RDS
8 75 (4.16%) MariaDB
9 74 (4.10%) RDBMS
10 67 (3.71%) Data Warehouse
10 67 (3.71%) DynamoDB
11 66 (3.66%) Elasticsearch
12 56 (3.10%) Amazon Redshift
13 51 (2.83%) Power BI
14 38 (2.11%) Amazon Aurora
15 26 (1.44%) Tableau
16 22 (1.22%) Azure SQL Database
17 21 (1.16%) BigQuery
17 21 (1.16%) Oracle Database
18 19 (1.05%) Looker
Development Applications
1 376 (20.84%) Git
2 126 (6.98%) JIRA
3 96 (5.32%) Jenkins
4 54 (2.99%) Bitbucket
5 46 (2.55%) GitLab
6 35 (1.94%) Subversion
7 30 (1.66%) Postman
8 26 (1.44%) PHPUnit
9 23 (1.27%) Maven
10 18 (1.00%) webpack
11 17 (0.94%) Visual Studio
12 14 (0.78%) Eclipse
12 14 (0.78%) Team Foundation Server
13 12 (0.67%) TeamCity
14 10 (0.55%) CircleCI
14 10 (0.55%) GNU Toolchain
15 9 (0.50%) Gradle
15 9 (0.50%) Selenium
16 8 (0.44%) gulp
16 8 (0.44%) IntelliJ
General
1 366 (20.29%) Social Skills
2 180 (9.98%) Analytical Skills
3 163 (9.04%) Finance
4 94 (5.21%) Retail
5 74 (4.10%) Marketing
6 72 (3.99%) Games
7 64 (3.55%) Public Sector
8 62 (3.44%) Banking
9 52 (2.88%) Inclusion and Diversity
10 49 (2.72%) Telecoms
11 44 (2.44%) Law
12 42 (2.33%) Manufacturing
13 40 (2.22%) Legal
14 30 (1.66%) Tech for Good
15 20 (1.11%) Health Technology
16 17 (0.94%) Investment Banking
17 16 (0.89%) Publishing
18 14 (0.78%) German Language
18 14 (0.78%) Organisational Skills
19 12 (0.67%) Front Office
Job Titles
1 962 (53.33%) Developer
2 379 (21.01%) PHP Developer
3 374 (20.73%) Senior
4 238 (13.19%) Software Engineer
5 202 (11.20%) Senior Developer
6 173 (9.59%) Full Stack Developer
7 161 (8.92%) Lead
8 135 (7.48%) Software Developer
9 103 (5.71%) DBA
10 97 (5.38%) Web Developer
11 81 (4.49%) Support Engineer
12 66 (3.66%) Lead Developer
12 66 (3.66%) Senior PHP Developer
12 66 (3.66%) Senior Software Engineer
13 62 (3.44%) Java Engineer
14 56 (3.10%) Java Developer
15 54 (2.99%) Java Software Engineer
16 48 (2.66%) Full Stack Engineer
17 47 (2.61%) .NET Developer
18 46 (2.55%) Systems Engineer
Libraries, Frameworks & Software Standards
1 497 (27.55%) HTML
2 479 (26.55%) CSS
3 457 (25.33%) Laravel
4 330 (18.29%) React
5 232 (12.86%) Vue
6 225 (12.47%) Node.js
7 203 (11.25%) .NET
7 203 (11.25%) AngularJS
8 195 (10.81%) RESTful
9 175 (9.70%) jQuery
10 146 (8.09%) Symfony
11 142 (7.87%) LAMP
12 123 (6.82%) HTML5
13 117 (6.49%) REST
13 117 (6.49%) Web Services
14 97 (5.38%) Spring
15 96 (5.32%) Kafka
16 87 (4.82%) JSON
17 86 (4.77%) CSS3
18 84 (4.66%) Spring Boot
Miscellaneous
1 72 (3.99%) Greenfield Project
2 63 (3.49%) Cloud Native
3 54 (2.99%) Management Information System
4 51 (2.83%) Algorithms
5 45 (2.49%) IoT
6 39 (2.16%) Mobile App
7 38 (2.11%) Client/Server
7 38 (2.11%) Self-Motivation
8 36 (2.00%) Enterprise Software
9 35 (1.94%) Linux Command Line
10 34 (1.88%) Legacy Systems
11 29 (1.61%) Product Ownership
12 28 (1.55%) Onboarding
13 24 (1.33%) Data Centre
13 24 (1.33%) Distributed Systems
14 21 (1.16%) Clustering
14 21 (1.16%) Private Cloud
14 21 (1.16%) Replication
15 20 (1.11%) Data Structures
16 18 (1.00%) Public Cloud
Operating Systems
1 371 (20.57%) Linux
2 175 (9.70%) Windows
3 84 (4.66%) Unix
4 41 (2.27%) Ubuntu
4 41 (2.27%) Windows Server
5 25 (1.39%) Android
5 25 (1.39%) Windows 10
6 24 (1.33%) Apple iOS
6 24 (1.33%) Windows Server 2016
7 21 (1.16%) Mac OS
8 20 (1.11%) Red Hat Enterprise Linux
9 19 (1.05%) Windows Server 2019
10 15 (0.83%) CentOS
10 15 (0.83%) Debian
11 13 (0.72%) Windows Server 2012
12 12 (0.67%) Windows Server 2008
13 11 (0.61%) Windows 7
14 4 (0.22%) Rocky
15 3 (0.17%) AIX
15 3 (0.17%) Solaris
Processes & Methodologies
1 474 (26.27%) Agile
2 463 (25.67%) Problem-Solving
3 393 (21.78%) Software Engineering
4 367 (20.34%) Full Stack Development
5 231 (12.80%) DevOps
6 228 (12.64%) MVC
7 227 (12.58%) Web Development
8 226 (12.53%) Mentoring
9 225 (12.47%) OOP
10 221 (12.25%) CI/CD
11 214 (11.86%) Microservices
12 193 (10.70%) Computer Science
13 159 (8.81%) OO
14 133 (7.37%) User Experience
15 129 (7.15%) E-Commerce
15 129 (7.15%) SDLC
16 124 (6.87%) Test Automation
17 118 (6.54%) Design Patterns
18 106 (5.88%) Code Quality
19 105 (5.82%) Project Management
Programming Languages
1 749 (41.52%) PHP
2 683 (37.86%) JavaScript
3 522 (28.94%) SQL
4 306 (16.96%) Java
5 288 (15.96%) Python
6 251 (13.91%) C#
7 141 (7.82%) TypeScript
8 97 (5.38%) PowerShell
9 88 (4.88%) Bash
10 63 (3.49%) Perl
11 57 (3.16%) Go
12 39 (2.16%) Ruby
13 37 (2.05%) T-SQL
14 36 (2.00%) PL/SQL
15 34 (1.88%) Kotlin
16 32 (1.77%) C
17 22 (1.22%) C++
17 22 (1.22%) Groovy
17 22 (1.22%) R
18 14 (0.78%) VB
Qualifications
1 281 (15.58%) Degree
2 132 (7.32%) Computer Science Degree
3 52 (2.88%) Security Cleared
4 44 (2.44%) SC Cleared
5 35 (1.94%) Master's Degree
6 22 (1.22%) CCNA
6 22 (1.22%) Cisco Certification
7 15 (0.83%) AWS Certification
7 15 (0.83%) Azure Certification
8 10 (0.55%) Microsoft Certification
8 10 (0.55%) Network+ Certification
8 10 (0.55%) OCP
8 10 (0.55%) Oracle Certification
9 8 (0.44%) CompTIA Security+
10 7 (0.39%) DBS Check
11 5 (0.28%) MCSE
11 5 (0.28%) PMI Certification
11 5 (0.28%) Postgraduate
12 3 (0.17%) HND
13 2 (0.11%) VMware Certified Professional (VCP)
Quality Assurance & Compliance
1 65 (3.60%) QA
2 26 (1.44%) GDPR
3 21 (1.16%) SLA
4 9 (0.50%) Data Quality
4 9 (0.50%) HIPAA
5 5 (0.28%) Accessibility
6 4 (0.22%) ISO/IEC 27001
7 3 (0.17%) PCI DSS
8 1 (0.055%) ISO 9000
8 1 (0.055%) SOC 2
System Software
1 297 (16.46%) Docker
2 70 (3.88%) Active Directory
3 39 (2.16%) VMware ESXi
4 33 (1.83%) VMware Infrastructure
5 20 (1.11%) Hyper-V
6 8 (0.44%) XenApp
7 6 (0.33%) Citrix Hypervisor
8 4 (0.22%) vSphere
9 2 (0.11%) Varnish
9 2 (0.11%) Virtual Machines
10 1 (0.055%) ACF2
10 1 (0.055%) Dovecot
10 1 (0.055%) etcd
10 1 (0.055%) Firmware
10 1 (0.055%) IAG
10 1 (0.055%) Postfix
10 1 (0.055%) RACF
10 1 (0.055%) Shibboleth
10 1 (0.055%) VMware Server
Systems Management
1 186 (10.31%) Terraform
2 171 (9.48%) Kubernetes
3 75 (4.16%) Ansible
4 33 (1.83%) Puppet
5 29 (1.61%) Grafana
6 25 (1.39%) Nagios
7 18 (1.00%) vCenter Server
8 16 (0.89%) Microsoft Intune
8 16 (0.89%) Prometheus
9 13 (0.72%) HAProxy
9 13 (0.72%) Progress Chef
9 13 (0.72%) WMI
10 10 (0.55%) Graphite
11 8 (0.44%) EMC NetWorker
11 8 (0.44%) EMC VPLEX
11 8 (0.44%) SCCM
12 7 (0.39%) Foglight
12 7 (0.39%) Kibana
13 6 (0.33%) Data Guard
13 6 (0.33%) Red Hat Spacewalk
Vendors
1 190 (10.53%) Oracle
2 131 (7.26%) Microsoft
3 81 (4.49%) VMware
4 66 (3.66%) Google
5 31 (1.72%) Atlassian
6 24 (1.33%) Databricks
7 21 (1.16%) Red Hat
8 19 (1.05%) Palo Alto
9 18 (1.00%) EMC
10 17 (0.94%) Splunk
10 17 (0.94%) Veeam
11 16 (0.89%) Cisco
11 16 (0.89%) Twitter
12 15 (0.83%) HP
12 15 (0.83%) Remedy
13 14 (0.78%) Adobe
13 14 (0.78%) Facebook
13 14 (0.78%) Meraki
14 12 (0.67%) Salesforce
14 12 (0.67%) WooCommerce