GitHub Actions Jobs

GitHub Actions
UK

The table below provides summary statistics for permanent job vacancies requiring GitHub Actions skills. It includes a benchmarking guide to the annual salaries offered in vacancies that cited GitHub Actions over the 6 months leading up to 6 July 2025, comparing them to the same period in the previous two years.

6 months to
6 Jul 2025
Same period 2024 Same period 2023
Rank 518 642 607
Rank change year-on-year +124 -35 -75
Permanent jobs citing GitHub Actions 221 271 317
As % of all permanent jobs advertised in the UK 0.37% 0.25% 0.36%
As % of the Cloud Services category 1.35% 0.76% 0.84%
Number of salaries quoted 168 219 208
10th Percentile £51,250 £45,000 £52,520
25th Percentile £59,250 £50,000 £60,000
Median annual salary (50th Percentile) £75,000 £65,000 £76,000
Median % change year-on-year +15.38% -14.47% +12.59%
75th Percentile £84,063 £77,500 £97,500
90th Percentile £100,000 £96,250 £117,236
UK excluding London median annual salary £67,500 £65,000 £65,956
% change year-on-year +3.85% -1.45% +9.93%

All Cloud Skills
UK

GitHub Actions falls under the Cloud Services category. For comparison with the information above, the following table provides summary statistics for all permanent job vacancies requiring cloud computing skills.

Permanent vacancies with a requirement for cloud computing skills 16,332 35,536 37,545
As % of all permanent jobs advertised in the UK 27.37% 33.38% 42.28%
Number of salaries quoted 10,956 26,506 26,757
10th Percentile £30,625 £30,500 £33,750
25th Percentile £41,250 £41,250 £46,250
Median annual salary (50th Percentile) £60,000 £57,500 £62,500
Median % change year-on-year +4.35% -8.00% -
75th Percentile £81,250 £77,500 £83,750
90th Percentile £102,500 £96,250 £102,500
UK excluding London median annual salary £52,500 £51,300 £55,000
% change year-on-year +2.34% -6.73% +4.76%

GitHub Actions
Job Vacancy Trend

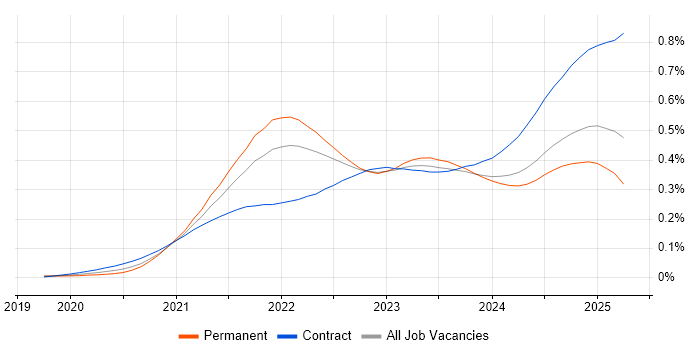
Job postings citing GitHub Actions as a proportion of all IT jobs advertised.

Job vacancy trend for GitHub Actions in the UK

GitHub Actions
Salary Trend

3-month moving average salary quoted in jobs citing GitHub Actions.

Salary trend for GitHub Actions in the UK

GitHub Actions
Salary Histogram

Salary distribution for jobs citing GitHub Actions over the 6 months to 6 July 2025.

Salary histogram for GitHub Actions in the UK

GitHub Actions
Top 16 Job Locations

The table below looks at the demand and provides a guide to the median salaries quoted in IT jobs citing GitHub Actions within the UK over the 6 months to 6 July 2025. The 'Rank Change' column provides an indication of the change in demand within each location based on the same 6 month period last year.

Location Rank Change
on Same Period
Last Year
Matching
Permanent
IT Job Ads
Median Salary
Past 6 Months
Median Salary
% Change
on Same Period
Last Year
Live
Jobs
England +102 196 £75,000 +15.38% 448
London +142 113 £80,000 +6.67% 253
UK excluding London +100 93 £67,500 +3.85% 245
Work from Home +112 88 £72,500 +11.54% 301
North of England -1 26 £68,500 +5.38% 102
South West +99 17 £65,000 -3.70% 21
Midlands +59 17 £67,500 +12.50% 16
South East +68 16 £70,000 - 43
West Midlands +54 15 £67,500 +12.50% 14
North West -3 11 £75,000 +15.38% 61
Scotland +98 10 £64,500 -31.84% 36
Yorkshire +16 10 £68,500 +0.74% 39
Wales - 9 £60,000 - 9
North East - 5 £57,500 - 3
East of England +28 4 £68,750 +5.77% 18
East Midlands +46 2 £56,250 +12.50% 2

GitHub Actions
Co-occurring Skills and Capabilities by Category

The follow tables expand on the table above by listing co-occurrences grouped by category. The same employment type, locality and period is covered with up to 20 co-occurrences shown in each of the following categories:

Application Platforms
1 5 (2.26%) CMS
2 4 (1.81%) Apache Airflow
2 4 (1.81%) BizTalk Server
2 4 (1.81%) Confluence
3 3 (1.36%) Headless CMS
3 3 (1.36%) IIS
3 3 (1.36%) SharePoint
4 2 (0.90%) Tomcat
4 2 (0.90%) WordPress
5 1 (0.45%) Apache Spark
5 1 (0.45%) Oracle Workflow
5 1 (0.45%) SAS
5 1 (0.45%) Sitefinity
Applications
1 1 (0.45%) Microsoft Office
Business Applications
1 4 (1.81%) Dynamics CRM
2 1 (0.45%) Shopify
Cloud Services
1 221 (100.00%) GitHub
2 131 (59.28%) Azure
3 100 (45.25%) AWS
4 97 (43.89%) Azure DevOps
5 43 (19.46%) Serverless
6 31 (14.03%) GCP
7 23 (10.41%) Amazon S3
8 22 (9.95%) AWS Lambda
8 22 (9.95%) SaaS
9 21 (9.50%) PaaS
10 18 (8.14%) Amazon ECS
10 18 (8.14%) Azure Data Factory
10 18 (8.14%) Azure Monitor
11 17 (7.69%) Amazon EC2
12 16 (7.24%) Datadog
13 15 (6.79%) npm
14 14 (6.33%) Amazon EKS
15 13 (5.88%) Azure Synapse Analytics
16 11 (4.98%) Amazon SQS
16 11 (4.98%) AWS CloudFormation
Communications & Networking
1 10 (4.52%) VPN
2 4 (1.81%) Firewall
2 4 (1.81%) MQTT
2 4 (1.81%) SMS
3 3 (1.36%) DNS
4 1 (0.45%) HbbTV
4 1 (0.45%) HTTP
4 1 (0.45%) Network Security
4 1 (0.45%) TCP/IP
Database & Business Intelligence
1 18 (8.14%) PostgreSQL
2 14 (6.33%) MySQL
3 12 (5.43%) Amazon RDS
3 12 (5.43%) Azure SQL Database
3 12 (5.43%) Relational Database
4 10 (4.52%) MongoDB
5 9 (4.07%) SQL Server
6 7 (3.17%) DynamoDB
6 7 (3.17%) NoSQL
6 7 (3.17%) Power BI
7 5 (2.26%) Amazon Aurora
8 4 (1.81%) Amazon Redshift
9 3 (1.36%) Data Warehouse
9 3 (1.36%) Redis
10 2 (0.90%) DocumentDB
10 2 (0.90%) Microsoft Analysis Services
11 1 (0.45%) Big Data
11 1 (0.45%) Delta Lake
11 1 (0.45%) MariaDB
11 1 (0.45%) Pinecone
Development Applications
1 39 (17.65%) Jenkins
2 38 (17.19%) Git
3 18 (8.14%) SonarQube
4 14 (6.33%) GitLab
5 13 (5.88%) JIRA
6 7 (3.17%) CircleCI
6 7 (3.17%) Octopus Deploy
6 7 (3.17%) Postman
6 7 (3.17%) TeamCity
7 6 (2.71%) Selenium
8 5 (2.26%) Artifactory
8 5 (2.26%) Visual Studio
8 5 (2.26%) webpack
9 4 (1.81%) Babel
9 4 (1.81%) Gradle
9 4 (1.81%) SQL Server Management Studio (SSMS)
9 4 (1.81%) Visual Studio Code
10 3 (1.36%) SpecFlow
11 2 (0.90%) Maven
11 2 (0.90%) Team Foundation Server
General
1 52 (23.53%) Social Skills
2 50 (22.62%) Finance
3 17 (7.69%) Law
3 17 (7.69%) Public Sector
4 14 (6.33%) Inclusion and Diversity
5 13 (5.88%) Analytical Skills
6 10 (4.52%) Marketing
7 7 (3.17%) Organisational Skills
8 6 (2.71%) Banking
8 6 (2.71%) Games
9 4 (1.81%) Automotive
9 4 (1.81%) Front Office
9 4 (1.81%) Legal
9 4 (1.81%) Pharmaceutical
9 4 (1.81%) Retail
10 3 (1.36%) Advertising
11 2 (0.90%) Publishing
12 1 (0.45%) Aerospace
12 1 (0.45%) Back Office
12 1 (0.45%) Financial Institution
Job Titles
1 58 (26.24%) DevOps Engineer
2 51 (23.08%) Senior
3 50 (22.62%) Lead
4 45 (20.36%) Software Engineer
5 43 (19.46%) Developer
6 20 (9.05%) Azure Engineer
6 20 (9.05%) Lead Software Engineer
7 18 (8.14%) Platform Engineer
8 14 (6.33%) Full-Stack Developer
9 11 (4.98%) .NET Software Engineer
9 11 (4.98%) C# Software Engineer
9 11 (4.98%) Senior Developer
9 11 (4.98%) Senior DevOps
9 11 (4.98%) Senior DevOps Engineer
9 11 (4.98%) Senior Software Engineer
10 10 (4.52%) Full-Stack Engineer
11 9 (4.07%) Cloud Platform Engineer
11 9 (4.07%) Full-Stack Software Engineer
12 8 (3.62%) Azure Platform Engineer
12 8 (3.62%) Backend Developer
Libraries, Frameworks & Software Standards
1 62 (28.05%) React
2 47 (21.27%) .NET
3 42 (19.00%) RESTful
4 28 (12.67%) AngularJS
5 23 (10.41%) GraphQL
5 23 (10.41%) Node.js
6 18 (8.14%) .NET Core
7 17 (7.69%) Kafka
8 14 (6.33%) JSON
9 12 (5.43%) HTML
9 12 (5.43%) REST
9 12 (5.43%) Spring
10 11 (4.98%) CSS
11 10 (4.52%) Spring Boot
11 10 (4.52%) XML
12 9 (4.07%) Django
13 8 (3.62%) Blazor
13 8 (3.62%) Micronaut
13 8 (3.62%) Quarkus
13 8 (3.62%) React Native
Miscellaneous
1 62 (28.05%) Cloud Native
2 18 (8.14%) Distributed Systems
3 12 (5.43%) Onboarding
4 9 (4.07%) Mobile App
4 9 (4.07%) Public Cloud
5 8 (3.62%) Distributed Applications
5 8 (3.62%) Legacy Systems
6 7 (3.17%) Client/Server
7 6 (2.71%) Greenfield Project
8 5 (2.26%) Management Information System
8 5 (2.26%) Product Ownership
9 4 (1.81%) Data Centre
9 4 (1.81%) Distributed Architecture
9 4 (1.81%) Life Science
9 4 (1.81%) Mobile Games
10 3 (1.36%) Linux Command Line
11 2 (0.90%) Data Structures
11 2 (0.90%) Enterprise Software
11 2 (0.90%) Marketing Technology
11 2 (0.90%) Virtual Team
Operating Systems
1 27 (12.22%) Linux
2 7 (3.17%) Windows
3 6 (2.71%) VMS
4 5 (2.26%) Apple iOS
4 5 (2.26%) Red Hat Enterprise Linux
5 3 (1.36%) Android
5 3 (1.36%) Windows Server
6 1 (0.45%) Ubuntu
Processes & Methodologies
1 189 (85.52%) CI/CD
2 142 (64.25%) DevOps
3 97 (43.89%) Software Engineering
4 91 (41.18%) Agile
5 69 (31.22%) Containerisation
6 68 (30.77%) Infrastructure as Code
7 50 (22.62%) Test Automation
8 46 (20.81%) Problem-Solving
9 44 (19.91%) Observability
10 41 (18.55%) Mentoring
11 37 (16.74%) Microservices
12 36 (16.29%) Platform Engineering
13 35 (15.84%) Full-Stack Development
13 35 (15.84%) Release Management
14 33 (14.93%) DevSecOps
15 29 (13.12%) Deployment Automation
15 29 (13.12%) Migration
16 25 (11.31%) Continuous Improvement
17 24 (10.86%) Infrastructure Automation
18 23 (10.41%) Software Delivery
Programming Languages
1 95 (42.99%) Python
2 45 (20.36%) Java
2 45 (20.36%) TypeScript
3 44 (19.91%) JavaScript
4 41 (18.55%) C#
5 40 (18.10%) SQL
6 31 (14.03%) PowerShell
7 28 (12.67%) Bash
8 20 (9.05%) Go
9 8 (3.62%) Kotlin
10 7 (3.17%) Shell Script
11 5 (2.26%) Kusto Query Language
11 5 (2.26%) Objective-C
11 5 (2.26%) Swift
12 4 (1.81%) Scala
13 3 (1.36%) Bicep
13 3 (1.36%) Ruby
14 2 (0.90%) Data Analysis Expressions
15 1 (0.45%) Dart
15 1 (0.45%) Rust
Qualifications
1 30 (13.57%) Degree
2 16 (7.24%) Computer Science Degree
2 16 (7.24%) Security Cleared
3 9 (4.07%) BPSS Clearance
4 8 (3.62%) Azure Certification
4 8 (3.62%) SC Cleared
5 5 (2.26%) Master's Degree
6 3 (1.36%) AWS Certification
7 2 (0.90%) AWS Certified Solutions Architect
7 2 (0.90%) ISTQB
8 1 (0.45%) ISTQB Foundation Certification
8 1 (0.45%) PhD
Quality Assurance & Compliance
1 19 (8.60%) QA
2 15 (6.79%) ISO/IEC 27001
3 8 (3.62%) PCI DSS
4 7 (3.17%) GDPR
5 5 (2.26%) Accessibility
5 5 (2.26%) NCSC
5 5 (2.26%) SOC 2
6 4 (1.81%) Data Quality
6 4 (1.81%) Sarbanes-Oxley
7 1 (0.45%) WCAG
System Software
1 93 (42.08%) Docker
2 15 (6.79%) VMware Infrastructure
3 9 (4.07%) Virtual Desktop
4 7 (3.17%) Virtual Machines
5 6 (2.71%) Active Directory
6 3 (1.36%) vSphere
7 1 (0.45%) Virtual Servers
Systems Management
1 104 (47.06%) Kubernetes
1 104 (47.06%) Terraform
2 33 (14.93%) Prometheus
3 22 (9.95%) Ansible
3 22 (9.95%) Grafana
4 14 (6.33%) Argo
5 9 (4.07%) Progress Chef
6 4 (1.81%) Packer
7 3 (1.36%) Puppet
8 1 (0.45%) Consul
8 1 (0.45%) Failover Clustering
8 1 (0.45%) Salt
Vendors
1 42 (19.00%) Microsoft
2 16 (7.24%) Databricks
2 16 (7.24%) VMware
3 14 (6.33%) Google
4 9 (4.07%) Citrix
5 5 (2.26%) Red Hat
6 4 (1.81%) New Relic
6 4 (1.81%) Salesforce
7 3 (1.36%) Guidewire
7 3 (1.36%) Informatica
7 3 (1.36%) OpenAI
7 3 (1.36%) Pega
8 1 (0.45%) Foundry
8 1 (0.45%) Oracle
8 1 (0.45%) Palantir
8 1 (0.45%) Palo Alto
8 1 (0.45%) Splunk