HTTP (Hypertext Transfer Protocol)
UK

The table below provides summary statistics for permanent job vacancies requiring HTTP skills. It includes a benchmarking guide to the annual salaries offered in vacancies that cited HTTP over the 6 months leading up to 8 November 2024, comparing them to the same period in the previous two years.

6 months to
8 Nov 2024
Same period 2023 Same period 2022
Rank 539 409 268
Rank change year-on-year -130 -141 +1
Permanent jobs citing HTTP 256 405 1,943
As % of all permanent jobs advertised in the UK 0.34% 0.71% 1.43%
As % of the Communications & Networking category 2.28% 4.69% 11.25%
Number of salaries quoted 135 224 616
10th Percentile £38,750 £35,000 £42,500
25th Percentile £52,500 £45,653 £51,250
Median annual salary (50th Percentile) £62,500 £60,000 £65,000
Median % change year-on-year +4.17% -7.69% +8.33%
75th Percentile £71,250 £76,563 £85,000
90th Percentile £90,750 £85,000 £96,250
UK excluding London median annual salary £65,000 £50,000 £57,500
% change year-on-year +30.00% -13.04% +7.02%

All Communications and Computer Networking Skills
UK

HTTP falls under the Communications and Computer Networking category. For comparison with the information above, the following table provides summary statistics for all permanent job vacancies requiring communications or computer networking skills.

Permanent vacancies with a requirement for communications or computer networking skills 11,214 8,637 17,267
As % of all permanent jobs advertised in the UK 14.85% 15.13% 12.73%
Number of salaries quoted 4,035 6,629 10,904
10th Percentile £30,000 £26,750 £28,750
25th Percentile £37,500 £34,250 £37,885
Median annual salary (50th Percentile) £53,000 £50,000 £52,500
Median % change year-on-year +6.00% -4.76% +5.00%
75th Percentile £70,000 £68,750 £72,000
90th Percentile £85,000 £85,000 £88,750
UK excluding London median annual salary £50,000 £45,000 £47,500
% change year-on-year +11.11% -5.26% +5.56%

HTTP
Job Vacancy Trend

Job postings citing HTTP as a proportion of all IT jobs advertised.
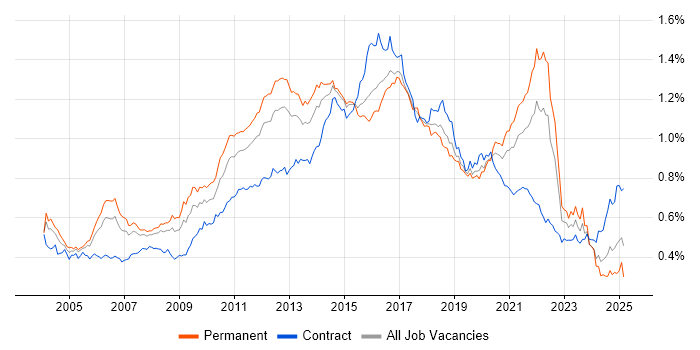
Job vacancy trend for HTTP in the UK

HTTP
Salary Trend

3-month moving average salary quoted in jobs citing HTTP.

Salary trend for HTTP in the UK

HTTP
Salary Histogram

Salary distribution for jobs citing HTTP over the 6 months to 8 November 2024.

Salary histogram for HTTP in the UK

HTTP
Top 16 Job Locations

The table below looks at the demand and provides a guide to the median salaries quoted in IT jobs citing HTTP within the UK over the 6 months to 8 November 2024. The 'Rank Change' column provides an indication of the change in demand within each location based on the same 6 month period last year.

Location Rank Change
on Same Period
Last Year
Matching
Permanent
IT Job Ads
Median Salary
Past 6 Months
Median Salary
% Change
on Same Period
Last Year
Live
Jobs
England -122 233 £62,500 +4.17% 36
UK excluding London -174 135 £65,000 +30.00% 21
Work from Home 0 120 £62,500 +2.04% 78
London +35 114 £62,500 -10.71% 18
South East -57 44 £62,500 +25.00% 4
South West -30 35 £67,500 +8.00% 1
East of England -44 14 £62,500 +78.57% 5
Midlands -89 14 £50,000 -7.41% 1
North of England -49 13 £55,000 -8.33% 7
West Midlands -51 12 £50,000 -4.16% 1
Wales -8 8 £60,522 +34.49% 1
Northern Ireland +21 7 £40,000 +6.67%
Yorkshire +18 7 - - 4
North West -57 6 £55,000 -8.33% 2
Scotland -10 2 - - 2
East Midlands -37 2 - -

HTTP
Co-occurring Skills and Capabilities by Category

The follow tables expand on the table above by listing co-occurrences grouped by category. The same employment type, locality and period is covered with up to 20 co-occurrences shown in each of the following categories:

Application Platforms
1 21 (8.20%) Apache Spark
2 10 (3.91%) Confluence
3 9 (3.52%) Microsoft Exchange
4 4 (1.56%) SharePoint
5 3 (1.17%) Apache
5 3 (1.17%) CMS
6 1 (0.39%) Drupal
6 1 (0.39%) IIS
6 1 (0.39%) MQSeries
6 1 (0.39%) nginx
6 1 (0.39%) Oracle HTTP Server
6 1 (0.39%) Tomcat
6 1 (0.39%) WebSphere
Applications
1 3 (1.17%) InfoPath
1 3 (1.17%) Microsoft Excel
1 3 (1.17%) Microsoft PowerPoint
Business Applications
1 2 (0.78%) SAP Business ByDesign
2 1 (0.39%) Maximo
Cloud Services
1 84 (32.81%) AWS
2 38 (14.84%) Azure
3 23 (8.98%) Serverless
4 18 (7.03%) AWS Lambda
5 12 (4.69%) SaaS
6 11 (4.30%) GCP
6 11 (4.30%) Microsoft 365
7 9 (3.52%) Amazon EC2
8 6 (2.34%) Cloud Computing
8 6 (2.34%) OpenShift
9 5 (1.95%) Entra ID
10 4 (1.56%) Amazon S3
11 3 (1.17%) Azure AKS
11 3 (1.17%) npm
11 3 (1.17%) OneDrive
12 2 (0.78%) Apigee
12 2 (0.78%) Azure Cosmos DB
12 2 (0.78%) Azure Monitor
12 2 (0.78%) Sentry
12 2 (0.78%) Virtual Private Cloud
Communications & Networking
1 82 (32.03%) TCP/IP
2 63 (24.61%) DNS
3 48 (18.75%) SMTP
4 45 (17.58%) Internet
5 27 (10.55%) VPN
5 27 (10.55%) WAN
6 25 (9.77%) Firewall
6 25 (9.77%) FTP
7 22 (8.59%) DHCP
8 18 (7.03%) HTTPS
9 17 (6.64%) BGP
9 17 (6.64%) LAN
10 15 (5.86%) 5G
11 12 (4.69%) Intrusion Detection
12 10 (3.91%) Ethernet
12 10 (3.91%) SD-WAN
12 10 (3.91%) SSL
13 8 (3.13%) SNMP
14 7 (2.73%) Radio Access Network
15 6 (2.34%) VLAN
Database & Business Intelligence
1 26 (10.16%) PostgreSQL
2 19 (7.42%) Relational Database
3 14 (5.47%) MySQL
4 10 (3.91%) SQL Server
5 8 (3.13%) Amazon RDS
6 5 (1.95%) NoSQL
7 4 (1.56%) Amazon QuickSight
8 3 (1.17%) Apache Cassandra
9 2 (0.78%) DynamoDB
9 2 (0.78%) SQLite
10 1 (0.39%) DB2
10 1 (0.39%) Elasticsearch
10 1 (0.39%) MariaDB
10 1 (0.39%) Metadata
10 1 (0.39%) RDBMS
Development Applications
1 32 (12.50%) Git
2 24 (9.38%) GitLab
3 15 (5.86%) Jenkins
4 14 (5.47%) JIRA
5 13 (5.08%) XCUITest
6 12 (4.69%) Cypress.io
7 10 (3.91%) Subversion
8 8 (3.13%) JUnit
8 8 (3.13%) Postman
9 5 (1.95%) Android Studio
9 5 (1.95%) Robolectric
10 4 (1.56%) Appium
10 4 (1.56%) Burp Suite
10 4 (1.56%) IntelliJ
10 4 (1.56%) Metasploit
10 4 (1.56%) REST Assured
10 4 (1.56%) Team Foundation Server
11 3 (1.17%) Gatling
11 3 (1.17%) Locust
11 3 (1.17%) Protractor
General
1 123 (48.05%) Social Skills
2 40 (15.63%) Analytical Skills
2 40 (15.63%) Finance
3 27 (10.55%) Games
3 27 (10.55%) Inclusion and Diversity
4 26 (10.16%) Retail
5 22 (8.59%) Advertising
6 19 (7.42%) Aerospace
6 19 (7.42%) Telecoms
7 16 (6.25%) Automotive
8 10 (3.91%) Legal
9 9 (3.52%) Mandarin Language
10 8 (3.13%) Electronics
10 8 (3.13%) Presentation Skills
11 7 (2.73%) Front Office
11 7 (2.73%) Manufacturing
11 7 (2.73%) Marketing
12 5 (1.95%) Documentation Skills
13 4 (1.56%) Public Sector
14 2 (0.78%) Influencing Skills
Job Titles
1 76 (29.69%) Senior
2 68 (26.56%) Software Engineer
3 38 (14.84%) Senior Software Engineer
4 34 (13.28%) Infrastructure Engineer
5 26 (10.16%) Lead
6 25 (9.77%) Developer
7 22 (8.59%) Analyst
8 17 (6.64%) Front-End Engineer (Client-Side Engineer)
9 15 (5.86%) Architect
10 12 (4.69%) Senior Infrastructure Engineer
10 12 (4.69%) Software Team Leader
10 12 (4.69%) Team Leader
11 11 (4.30%) Senior Front-End Engineer (Client-Side Engineer)
12 10 (3.91%) C++ Software Engineer
12 10 (3.91%) Embedded Engineer
12 10 (3.91%) SOC Analyst
13 9 (3.52%) Firmware Engineer
13 9 (3.52%) Network Engineer
13 9 (3.52%) Senior Firmware Engineer
13 9 (3.52%) Tester
Libraries, Frameworks & Software Standards
1 43 (16.80%) Web Services
2 42 (16.41%) REST
3 32 (12.50%) RESTful
4 28 (10.94%) HTML
4 28 (10.94%) JSON
5 26 (10.16%) Jest
5 26 (10.16%) Kafka
6 24 (9.38%) Django
6 24 (9.38%) React
7 23 (8.98%) LDAP
8 20 (7.81%) XML
9 17 (6.64%) Apollo GraphQL
9 17 (6.64%) Celery
9 17 (6.64%) GraphQL
9 17 (6.64%) Next.js
10 15 (5.86%) Node.js
11 13 (5.08%) CSS
12 11 (4.30%) Playwright
12 11 (4.30%) SOAP
13 10 (3.91%) .NET
Miscellaneous
1 25 (9.77%) Distributed Systems
2 21 (8.20%) Mobile App
3 17 (6.64%) Client/Server
4 16 (6.25%) Algorithms
5 14 (5.47%) Self-Motivation
6 11 (4.30%) Data Centre
7 10 (3.91%) Data Structures
7 10 (3.91%) IoT
7 10 (3.91%) Product Ownership
7 10 (3.91%) Security Operations Centre
8 9 (3.52%) GNSS
8 9 (3.52%) Linux Command Line
9 8 (3.13%) FPGA
9 8 (3.13%) MicroBlaze
9 8 (3.13%) Tandem
10 7 (2.73%) Derivative
10 7 (2.73%) Fixed Income
11 6 (2.34%) Virtual Team
12 4 (1.56%) Robotics
12 4 (1.56%) SCADA
Operating Systems
1 88 (34.38%) Linux
2 45 (17.58%) Windows
3 18 (7.03%) Apple iOS
4 15 (5.86%) Unix
5 14 (5.47%) Red Hat Enterprise Linux
6 12 (4.69%) Android
7 10 (3.91%) Windows Server
8 7 (2.73%) Debian
9 6 (2.34%) CentOS
10 5 (1.95%) Windows 10
11 4 (1.56%) Kali Linux
12 3 (1.17%) Windows Server 2012
12 3 (1.17%) Windows Server 2016
12 3 (1.17%) Windows Server 2019
13 2 (0.78%) Ubuntu
Processes & Methodologies
1 92 (35.94%) Agile
2 85 (33.20%) Software Engineering
3 72 (28.13%) Problem-Solving
4 61 (23.83%) Test Automation
5 60 (23.44%) Computer Science
6 51 (19.92%) DevOps
7 43 (16.80%) CI/CD
8 41 (16.02%) Infrastructure Engineering
8 41 (16.02%) Software Testing
9 32 (12.50%) Unit Testing
10 28 (10.94%) OO
11 27 (10.55%) Machine Learning
12 26 (10.16%) Cybersecurity
13 24 (9.38%) Infrastructure as Code
13 24 (9.38%) Requirements Analysis
14 21 (8.20%) Analytics
14 21 (8.20%) Performance Metrics
14 21 (8.20%) Programmatic Advertising
15 20 (7.81%) Full-Stack Development
16 17 (6.64%) Backends for Frontends
Programming Languages
1 89 (34.77%) Python
2 40 (15.63%) Java
3 35 (13.67%) C++
3 35 (13.67%) JavaScript
3 35 (13.67%) SQL
4 30 (11.72%) TypeScript
5 28 (10.94%) C
6 26 (10.16%) PowerShell
7 21 (8.20%) Scala
8 17 (6.64%) C#
9 15 (5.86%) Embedded C++
9 15 (5.86%) Swift
10 13 (5.08%) Bash
11 9 (3.52%) Kotlin
11 9 (3.52%) PHP
12 6 (2.34%) Perl
13 5 (1.95%) Shell Script
14 4 (1.56%) R
15 3 (1.17%) Embedded C
16 2 (0.78%) XAML
Qualifications
1 70 (27.34%) Degree
2 36 (14.06%) Security Cleared
3 27 (10.55%) SC Cleared
4 18 (7.03%) DV Cleared
5 17 (6.64%) DBS Check
6 16 (6.25%) Computer Science Degree
7 11 (4.30%) Cisco Certification
8 7 (2.73%) CCNP
9 6 (2.34%) CCNA
9 6 (2.34%) PhD
10 5 (1.95%) Master's Degree
10 5 (1.95%) OSCP
11 4 (1.56%) Azure Certification
11 4 (1.56%) CREST Certified
11 4 (1.56%) Numerate Degree
11 4 (1.56%) OSCE
12 3 (1.17%) CISSP
13 1 (0.39%) CCIE
13 1 (0.39%) CISM
13 1 (0.39%) GIAC
Quality Assurance & Compliance
1 17 (6.64%) QA
2 12 (4.69%) ISO 9001
3 7 (2.73%) Accessibility
4 4 (1.56%) SLA
5 3 (1.17%) GDPR
5 3 (1.17%) HIPAA
5 3 (1.17%) HL7
6 2 (0.78%) ISO/IEC 27001
6 2 (0.78%) NCSC
6 2 (0.78%) NIST
System Software
1 34 (13.28%) Docker
2 18 (7.03%) Active Directory
3 13 (5.08%) VMware Infrastructure
4 9 (3.52%) Embedded Firmware
4 9 (3.52%) Firmware
5 6 (2.34%) Hyper-V
6 2 (0.78%) Virtual Machines
6 2 (0.78%) VMware ESXi
7 1 (0.39%) BitLocker
7 1 (0.39%) Terminal Services
Systems Management
1 33 (12.89%) Kubernetes
2 23 (8.98%) Terraform
3 17 (6.64%) Consul
3 17 (6.64%) Packer
4 14 (5.47%) Puppet
5 12 (4.69%) Ansible
6 10 (3.91%) QRadar
7 5 (1.95%) Nessus
8 4 (1.56%) Active Directory Federation Services
8 4 (1.56%) Nmap
9 3 (1.17%) Single Sign-On
10 2 (0.78%) SCCM
10 2 (0.78%) vCenter Server
11 1 (0.39%) Failover Clustering
11 1 (0.39%) FortiGate
11 1 (0.39%) Grafana
11 1 (0.39%) Prometheus
11 1 (0.39%) Rancher
Vendors
1 64 (25.00%) Microsoft
2 36 (14.06%) Google
3 31 (12.11%) VMware
4 21 (8.20%) Apple
5 12 (4.69%) Splunk
6 7 (2.73%) Red Hat
7 6 (2.34%) MuleSoft
7 6 (2.34%) SAP
8 4 (1.56%) Qualys
8 4 (1.56%) SolarWinds
8 4 (1.56%) Zscaler
9 3 (1.17%) Oracle
10 2 (0.78%) ANSYS
10 2 (0.78%) Cisco
10 2 (0.78%) Parasoft
10 2 (0.78%) Salesforce
11 1 (0.39%) Atlassian
11 1 (0.39%) Fortinet
11 1 (0.39%) Renesas
11 1 (0.39%) Sophos