Redis
UK

The following table provides summary statistics for permanent job vacancies with a requirement for Redis skills. Included is a benchmarking guide to the salaries offered in vacancies that have cited Redis over the 6 months to 29 November 2023 with a comparison to the same period in the previous 2 years.

6 months to
29 Nov 2023
Same period 2022 Same period 2021
Rank 521 396 239
Rank change year-on-year -125 -157 +71
Permanent jobs citing Redis 215 1,047 2,045
As % of all permanent jobs advertised in the UK 0.40% 0.83% 1.58%
As % of the Database & Business Intelligence category 1.88% 3.54% 5.80%
Number of salaries quoted 185 521 795
10th Percentile £52,500 £47,500 £40,000
25th Percentile £58,775 £57,500 £50,000
Median annual salary (50th Percentile) £70,000 £80,000 £65,000
Median % change year-on-year -12.50% +23.08% +8.33%
75th Percentile £82,500 £92,500 £82,500
90th Percentile £97,500 £110,000 £95,750
UK excluding London median annual salary £64,500 £72,500 £57,500
% change year-on-year -11.03% +26.09% +9.52%

All Database and Business Intelligence Skills
UK

Redis is in the Databases and Business Intelligence category. The following table is for comparison with the above and provides summary statistics for all permanent job vacancies with a requirement for database or business intelligence skills.

Permanent vacancies with a requirement for database or business intelligence skills 11,464 29,535 35,248
As % of all permanent jobs advertised in the UK 21.19% 23.47% 27.31%
Number of salaries quoted 8,647 17,891 22,551
10th Percentile £37,000 £36,750 £35,250
25th Percentile £46,938 £46,250 £42,500
Median annual salary (50th Percentile) £60,000 £62,500 £57,500
Median % change year-on-year -4.00% +8.70% +4.55%
75th Percentile £80,000 £82,500 £77,500
90th Percentile £95,000 £100,000 £95,000
UK excluding London median annual salary £55,000 £55,000 £50,000
% change year-on-year - +10.00% +2.04%

Redis
Job Vacancy Trend

Job postings citing Redis as a proportion of all IT jobs advertised.
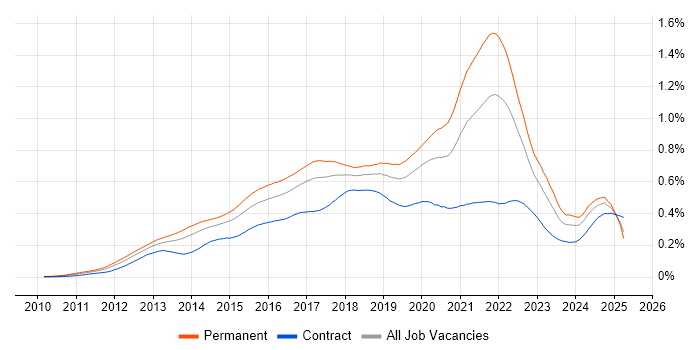
Job vacancy trend for Redis in the UK

Redis
Salary Trend

3-month moving average salary quoted in jobs citing Redis.

Salary trend for Redis in the UK

Redis
Salary Histogram

Salary distribution for jobs citing Redis over the 6 months to 29 November 2023.

Salary histogram for Redis in the UK

Redis
Top 16 Job Locations

The table below looks at the demand and provides a guide to the median salaries quoted in IT jobs citing Redis within the UK over the 6 months to 29 November 2023. The 'Rank Change' column provides an indication of the change in demand within each location based on the same 6 month period last year.

Location Rank Change
on Same Period
Last Year
Matching
Permanent
IT Job Ads
Median Salary
Past 6 Months
Median Salary
% Change
on Same Period
Last Year
Live
Jobs
England -115 173 £70,000 -17.65% 164
Work from Home -50 116 £65,000 -23.53% 112
London -49 106 £76,250 -15.28% 106
UK excluding London +43 91 £64,500 -11.03% 95
North of England +101 29 £60,000 -12.73% 35
South West +47 18 £62,500 -7.41% 5
North West +81 16 £55,000 -18.52% 17
Scotland +45 13 £65,000 +1.96% 6
Wales +19 11 £65,000 +13.04% 5
South East +47 10 £59,250 -18.28% 35
Yorkshire +88 8 £80,000 -3.03% 6
Northern Ireland +38 7 £70,000 +40.00% 2
North East +45 5 £65,000 +18.18% 12
Midlands +98 3 £64,500 -19.38% 5
West Midlands +95 2 £64,500 -24.12% 3
East Midlands +41 1 £60,000 -23.81% 2

Redis
Co-occurring Skills and Capabilities by Category

The follow tables expand on the table above by listing co-occurrences grouped by category. The same employment type, locality and period is covered with up to 20 co-occurrences shown in each of the following categories:

Application Platforms
1 17 (7.91%) nginx
2 9 (4.19%) Apache Spark
3 7 (3.26%) Apache
4 6 (2.79%) Apache Airflow
4 6 (2.79%) CMS
5 4 (1.86%) Luigi
6 3 (1.40%) Confluence
6 3 (1.40%) JBoss
6 3 (1.40%) Tomcat
7 2 (0.93%) IIS
7 2 (0.93%) Jetty
7 2 (0.93%) Moodle
7 2 (0.93%) NServiceBus
8 1 (0.47%) Drupal
8 1 (0.47%) WebLogic
8 1 (0.47%) WordPress
Business Applications
1 1 (0.47%) Magento
Cloud Services
1 131 (60.93%) AWS
2 98 (45.58%) Azure
3 65 (30.23%) GCP
4 45 (20.93%) Azure Service Bus
5 36 (16.74%) Amazon ECS
6 35 (16.28%) AWS CloudFormation
7 34 (15.81%) Cloud Computing
8 28 (13.02%) Serverless
9 27 (12.56%) dbt
9 27 (12.56%) Pulumi
10 25 (11.63%) Azure DevOps
11 23 (10.70%) SaaS
12 19 (8.84%) Amazon S3
13 17 (7.91%) AWS Lambda
13 17 (7.91%) Azure Cosmos DB
14 13 (6.05%) PaaS
15 10 (4.65%) Amazon EKS
15 10 (4.65%) AWS Step Functions
16 9 (4.19%) Amazon EC2
16 9 (4.19%) Sentry
Communications & Networking
1 24 (11.16%) TCP/IP
2 6 (2.79%) HTTP
3 4 (1.86%) Internet
4 2 (0.93%) Asterisk PBX
4 2 (0.93%) PBX
4 2 (0.93%) VoIP
5 1 (0.47%) ATM
5 1 (0.47%) DNS
5 1 (0.47%) Fibre Channel
5 1 (0.47%) Firewall
5 1 (0.47%) iSCSI
5 1 (0.47%) NAS
5 1 (0.47%) SAN
5 1 (0.47%) VLAN
5 1 (0.47%) VPN
Database & Business Intelligence
1 87 (40.47%) PostgreSQL
2 54 (25.12%) NoSQL
3 50 (23.26%) Elasticsearch
4 42 (19.53%) MySQL
5 36 (16.74%) MongoDB
6 22 (10.23%) SQL Server
7 20 (9.30%) Relational Database
8 19 (8.84%) Amazon RDS
9 12 (5.58%) Big Data
10 11 (5.12%) DynamoDB
11 9 (4.19%) Data Warehouse
12 7 (3.26%) Hadoop
12 7 (3.26%) Scylla
13 6 (2.79%) Data Lake
14 5 (2.33%) BigQuery
14 5 (2.33%) Tableau
15 4 (1.86%) Bigtable
15 4 (1.86%) CouchDB
15 4 (1.86%) Power BI
15 4 (1.86%) RethinkDB
Development Applications
1 30 (13.95%) Jenkins
2 17 (7.91%) Git
3 15 (6.98%) Maven
4 10 (4.65%) Cucumber
4 10 (4.65%) JUnit
5 9 (4.19%) JIRA
6 8 (3.72%) Gradle
7 7 (3.26%) MSBuild
7 7 (3.26%) Visual Studio
7 7 (3.26%) Visual Studio Code
8 6 (2.79%) Octopus Deploy
9 5 (2.33%) IntelliJ
9 5 (2.33%) Mocha
9 5 (2.33%) Selenium
9 5 (2.33%) Sinon.JS
9 5 (2.33%) WebDriver
10 4 (1.86%) GitLab
10 4 (1.86%) TeamCity
11 2 (0.93%) Subversion
11 2 (0.93%) Travis CI
General
1 43 (20.00%) Social Skills
2 35 (16.28%) Inclusion and Diversity
3 30 (13.95%) Finance
4 18 (8.37%) Analytical Skills
5 8 (3.72%) Banking
6 7 (3.26%) Public Sector
7 5 (2.33%) Games
7 5 (2.33%) Influencing Skills
7 5 (2.33%) Presentation Skills
8 3 (1.40%) Front Office
8 3 (1.40%) Marketing
8 3 (1.40%) Telecoms
9 1 (0.47%) Documentation Skills
9 1 (0.47%) Law
9 1 (0.47%) Mandarin Language
9 1 (0.47%) Publishing
9 1 (0.47%) Retail
9 1 (0.47%) Tech for Good
Job Titles
1 104 (48.37%) Developer
2 81 (37.67%) Senior
3 37 (17.21%) Senior Developer
4 34 (15.81%) Software Engineer
5 30 (13.95%) .NET Developer
6 20 (9.30%) Architect
6 20 (9.30%) Senior .NET Developer
7 18 (8.37%) Java Developer
7 18 (8.37%) Python Developer
7 18 (8.37%) Senior Software Engineer
8 15 (6.98%) Full Stack Developer
9 12 (5.58%) Lead
10 11 (5.12%) Site Engineer
10 11 (5.12%) Site Reliability Engineer
11 10 (4.65%) Solutions Architect
12 9 (4.19%) Azure Engineer
12 9 (4.19%) GCP Engineer
12 9 (4.19%) Ruby on Rails Developer
13 8 (3.72%) C# .NET Developer
13 8 (3.72%) GCP Software Engineer
Libraries, Frameworks & Software Standards
1 61 (28.37%) .NET
2 57 (26.51%) REST
3 53 (24.65%) Kafka
3 53 (24.65%) React
4 41 (19.07%) ASP.NET
5 40 (18.60%) .NET Framework
5 40 (18.60%) AngularJS
6 36 (16.74%) Node.js
7 35 (16.28%) CSS
8 34 (15.81%) Django
9 32 (14.88%) HTML
10 26 (12.09%) .NET Core
11 24 (11.16%) GraphQL
12 23 (10.70%) Spring
13 21 (9.77%) ASP.NET Web API
14 19 (8.84%) OAuth
15 17 (7.91%) LINQ
16 16 (7.44%) ASP.NET MVC
16 16 (7.44%) OAuth2
16 16 (7.44%) RESTful
Miscellaneous
1 43 (20.00%) Distributed Systems
2 31 (14.42%) Cloud Native
3 16 (7.44%) Foreign Exchange (FX)
4 15 (6.98%) Data Structures
5 13 (6.05%) Algorithms
6 12 (5.58%) Greenfield Project
7 9 (4.19%) Self-Motivation
8 7 (3.26%) Management Information System
9 6 (2.79%) Distributed Architecture
9 6 (2.79%) Legacy Systems
10 5 (2.33%) Virtual Team
11 4 (1.86%) Data Centre
11 4 (1.86%) Enterprise Software
11 4 (1.86%) Public Cloud
11 4 (1.86%) Reinsurance
12 3 (1.40%) Video\Live Streaming
13 2 (0.93%) Data Protection Act
13 2 (0.93%) Replication
13 2 (0.93%) W3C
13 2 (0.93%) Xbox
Operating Systems
1 53 (24.65%) Linux
2 25 (11.63%) Unix
3 9 (4.19%) Mac OS
4 5 (2.33%) Windows
5 2 (0.93%) CentOS
5 2 (0.93%) Ubuntu
6 1 (0.47%) Red Hat Enterprise Linux
6 1 (0.47%) Windows Server
Processes & Methodologies
1 93 (43.26%) Agile
2 87 (40.47%) DevOps
3 75 (34.88%) Software Engineering
4 69 (32.09%) CI/CD
5 64 (29.77%) Microservices
6 59 (27.44%) Continuous Integration
7 53 (24.65%) Scrum
8 41 (19.07%) Open Source
9 40 (18.60%) Problem-Solving
10 36 (16.74%) Containerisation
10 36 (16.74%) Design Patterns
11 31 (14.42%) Fintech
11 31 (14.42%) Observability
12 30 (13.95%) Clean Code
12 30 (13.95%) Full Stack Development
12 30 (13.95%) TDD
13 27 (12.56%) Infrastructure as Code
14 26 (12.09%) Continuous Delivery
14 26 (12.09%) Prototyping
14 26 (12.09%) Site Reliability Engineering
Programming Languages
1 77 (35.81%) Python
2 65 (30.23%) C#
3 62 (28.84%) SQL
4 58 (26.98%) JavaScript
5 56 (26.05%) Java
6 19 (8.84%) Go
7 17 (7.91%) C++
7 17 (7.91%) TypeScript
8 15 (6.98%) Bash
9 13 (6.05%) Ruby
10 10 (4.65%) PHP
11 8 (3.72%) PowerShell
12 7 (3.26%) Scala
13 6 (2.79%) Kusto Query Language
14 5 (2.33%) Kotlin
15 3 (1.40%) Perl
16 2 (0.93%) C
17 1 (0.47%) Clojure
17 1 (0.47%) F#
Qualifications
1 38 (17.67%) SC Cleared
1 38 (17.67%) Security Cleared
2 33 (15.35%) Degree
3 22 (10.23%) Computer Science Degree
4 6 (2.79%) Microsoft Certification
5 5 (2.33%) DV Cleared
6 1 (0.47%) Azure Certification
6 1 (0.47%) BPSS Clearance
6 1 (0.47%) CCA
Quality Assurance & Compliance
1 44 (20.47%) QA
2 7 (3.26%) SLA
3 6 (2.79%) ISO 9000
3 6 (2.79%) ISO/IEC 27001
3 6 (2.79%) PCI DSS
4 4 (1.86%) Data Quality
5 2 (0.93%) WAI
6 1 (0.47%) ISO 9001
6 1 (0.47%) WCAG
System Software
1 95 (44.19%) Docker
2 11 (5.12%) Active Directory
3 2 (0.93%) Kamailio
3 2 (0.93%) OpenSIPS
3 2 (0.93%) VMware Infrastructure
4 1 (0.47%) HDFS
4 1 (0.47%) NFS
4 1 (0.47%) Varnish
Systems Management
1 109 (50.70%) Kubernetes
2 39 (18.14%) Terraform
3 14 (6.51%) Grafana
4 9 (4.19%) Prometheus
5 5 (2.33%) Kibana
6 4 (1.86%) Ansible
7 2 (0.93%) MIIS
7 2 (0.93%) Puppet
8 1 (0.47%) Active Directory Federation Services
8 1 (0.47%) Apache Ranger
8 1 (0.47%) Hadoop YARN
8 1 (0.47%) Single Sign-On
8 1 (0.47%) ZABBIX
Vendors
1 56 (26.05%) Google
2 28 (13.02%) Microsoft
3 7 (3.26%) Dell
4 5 (2.33%) Databricks
5 4 (1.86%) Oracle
6 2 (0.93%) VMware
7 1 (0.47%) Cloudera
7 1 (0.47%) Confluent
7 1 (0.47%) EMC
7 1 (0.47%) Zend