System Administrator (Sysadmin)
UK

The median System Administrator (Sysadmin) salary in the UK is £42,500 per year according to job vacancies posted during the 6 months to 30 November 2023.

The first table below provides salary benchmarking and summary statistics including a comparison to same period in the previous 2 years.

6 months to
30 Nov 2023
Same period 2022 Same period 2021
Rank 452 591 624
Rank change year-on-year +139 +33 -178
Permanent jobs requiring a Systems Administrator 291 592 541
As % of all permanent jobs advertised in the UK 0.54% 0.47% 0.42%
As % of the Job Titles category 0.57% 0.49% 0.44%
Number of salaries quoted 237 389 455
10th Percentile £29,010 £30,600 £27,700
25th Percentile £35,000 £36,250 £32,500
Median annual salary (50th Percentile) £42,500 £48,000 £42,500
Median % change year-on-year -11.46% +12.94% -2.30%
75th Percentile £53,759 £58,750 £55,000
90th Percentile £68,750 £72,500 £64,750
UK excluding London median annual salary £42,500 £40,000 £40,000
% change year-on-year +6.25% - +6.67%

All Permanent IT Job Vacancies
UK

The following table is for comparison with the above and includes summary statistics for all permanent IT job vacancies. Most job vacancies include a discernible job title that can be normalized. As such, the figures in the second row provide an indication of the number of permanent jobs in our overall sample.

Permanent vacancies in the UK with a recognized job title 51,419 120,484 123,121
% of permanent jobs with a recognized job title 95.48% 95.34% 95.10%
Number of salaries quoted 37,696 75,234 84,392
10th Percentile £31,250 £32,750 £32,000
25th Percentile £42,500 £45,000 £42,500
Median annual salary (50th Percentile) £60,000 £60,000 £57,500
Median % change year-on-year - +4.35% +4.55%
75th Percentile £80,000 £81,250 £77,500
90th Percentile £97,500 £97,750 £95,000
UK excluding London median annual salary £52,500 £52,500 £50,000
% change year-on-year - +5.00% +5.26%

Systems Administrator
Job Vacancy Trend

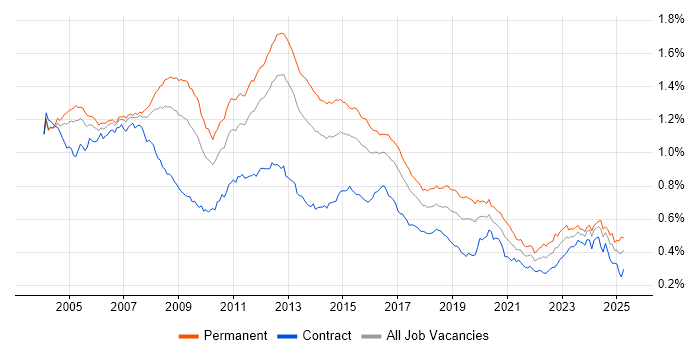
Job postings that featured Systems Administrator in the job title as a proportion of all IT jobs advertised.

Job vacancy trend for Systems Administrator in the UK

Systems Administrator
Salary Trend

3-month moving average salary quoted in jobs citing Systems Administrator.

Salary trend for Systems Administrator in the UK

Systems Administrator
Salary Histogram

Salary distribution for jobs citing Systems Administrator over the 6 months to 30 November 2023.

Salary histogram for Systems Administrator in the UK

Systems Administrator
Top 17 Job Locations

The table below looks at the demand and provides a guide to the median salaries quoted in IT jobs citing Systems Administrator within the UK over the 6 months to 30 November 2023. The 'Rank Change' column provides an indication of the change in demand within each location based on the same 6 month period last year.

Location Rank Change
on Same Period
Last Year
Matching
Permanent
IT Job Ads
Median Salary
Past 6 Months
Median Salary
% Change
on Same Period
Last Year
Live
Jobs
England +120 270 £42,500 -12.37% 104
UK excluding London +103 203 £42,500 +6.25% 82
Work from Home +106 95 £42,500 -15.00% 34
London +176 82 £45,000 -18.18% 30
Midlands +135 40 £38,000 -2.56% 7
South East +64 40 £42,500 +4.94% 29
North of England +148 38 £40,144 -10.79% 18
South West +21 35 £43,250 -3.89% 13
East of England +137 33 £57,500 +48.44% 13
West Midlands +146 27 £40,000 +2.56% 3
North West +106 20 £44,263 +4.15% 12
Yorkshire +87 17 £36,500 -16.57% 4
East Midlands +51 15 £36,500 -17.05% 4
Scotland +27 9 £50,000 +42.86% 6
Wales +19 7 £39,500 +12.86%
North East +40 1 £34,581 -23.15% 3
Channel Islands - 1 £55,000 -

Systems Administrator Skill Set
Top 30 Co-occurring Skills and Capabilities

For the 6 months to 30 November 2023, Systems Administrator job roles required the following skills and capabilities in order of popularity. The figures indicate the absolute number co-occurrences and as a proportion of all permanent job ads featuring Systems Administrator in the job title.

1 148 (50.86%) Windows
2 101 (34.71%) Active Directory
3 94 (32.30%) Social Skills
4 90 (30.93%) Linux
4 90 (30.93%) VMware
5 82 (28.18%) Microsoft
6 79 (27.15%) Azure
7 75 (25.77%) Microsoft 365
7 75 (25.77%) Problem-Solving
8 74 (25.43%) DNS
9 70 (24.05%) Windows Server
10 69 (23.71%) Degree
11 68 (23.37%) VMware Infrastructure
12 60 (20.62%) DHCP
13 55 (18.90%) PowerShell
14 53 (18.21%) AWS
15 50 (17.18%) SQL
16 48 (16.49%) Firewall
17 43 (14.78%) TCP/IP
18 41 (14.09%) Python
19 40 (13.75%) Unix
19 40 (13.75%) VPN
19 40 (13.75%) LAN
20 37 (12.71%) Disaster Recovery
21 36 (12.37%) Security Cleared
22 35 (12.03%) Entra ID
23 31 (10.65%) Microsoft Intune
24 29 (9.97%) Bash
25 28 (9.62%) Customer Service
25 28 (9.62%) WAN

Systems Administrator Skill Set
Co-occurring Skills and Capabilities by Category

The follow tables expand on the table above by listing co-occurrences grouped by category. The same employment type, locality and period is covered with up to 20 co-occurrences shown in each of the following categories:

Application Platforms
1 20 (6.87%) SharePoint
2 12 (4.12%) Apache
2 12 (4.12%) MS Exchange
3 7 (2.41%) Site Server
4 6 (2.06%) Tomcat
5 5 (1.72%) Confluence
5 5 (1.72%) IIS
6 2 (0.69%) nginx
7 1 (0.34%) Apache Solr
7 1 (0.34%) CMS
7 1 (0.34%) Drupal
7 1 (0.34%) JBoss
7 1 (0.34%) OpenStack
7 1 (0.34%) WebLogic
Applications
1 18 (6.19%) Microsoft Office
2 15 (5.15%) Microsoft Excel
3 5 (1.72%) Microsoft PowerPoint
4 4 (1.37%) AutoCAD
4 4 (1.37%) Trello
Business Applications
1 8 (2.75%) ResourceLink
2 5 (1.72%) Dynamics CRM
3 2 (0.69%) Oracle Applications
4 1 (0.34%) iTrent
4 1 (0.34%) Northgate Housing
4 1 (0.34%) Remedy ITSM
Cloud Services
1 79 (27.15%) Azure
2 75 (25.77%) Microsoft 365
3 53 (18.21%) AWS
4 35 (12.03%) Entra ID
5 14 (4.81%) GCP
5 14 (4.81%) Power Platform
6 8 (2.75%) Dynamics 365
7 7 (2.41%) Amazon EC2
8 5 (1.72%) Power Automate
8 5 (1.72%) SaaS
9 4 (1.37%) Azure Storage
9 4 (1.37%) Cloud Computing
9 4 (1.37%) Dropbox
9 4 (1.37%) GitHub
9 4 (1.37%) PowerApps
10 3 (1.03%) Amazon CloudWatch
10 3 (1.03%) Azure DevOps
10 3 (1.03%) Virtual Private Cloud
10 3 (1.03%) WhatsApp
11 2 (0.69%) AWS OpsWorks
Communications & Networking
1 74 (25.43%) DNS
2 60 (20.62%) DHCP
3 48 (16.49%) Firewall
4 43 (14.78%) TCP/IP
5 40 (13.75%) LAN
5 40 (13.75%) VPN
6 28 (9.62%) WAN
7 24 (8.25%) VLAN
8 12 (4.12%) NAS
9 11 (3.78%) SAN
10 9 (3.09%) VoIP
11 7 (2.41%) iSCSI
12 6 (2.06%) HTTP
12 6 (2.06%) Internet
12 6 (2.06%) Kerberos
12 6 (2.06%) Wi-Fi
13 5 (1.72%) NetScaler
13 5 (1.72%) SMTP
13 5 (1.72%) VSAN
13 5 (1.72%) Wireless
Database & Business Intelligence
1 19 (6.53%) SQL Server
2 12 (4.12%) Amazon RDS
2 12 (4.12%) MySQL
3 5 (1.72%) Oracle Database
3 5 (1.72%) Power BI
4 4 (1.37%) Metadata
5 3 (1.03%) Crystal Reports
5 3 (1.03%) Data Lake
5 3 (1.03%) NoSQL
5 3 (1.03%) PostgreSQL
6 2 (0.69%) Relational Database
7 1 (0.34%) Elasticsearch
7 1 (0.34%) MongoDB
7 1 (0.34%) MS Access
7 1 (0.34%) Power Query
Development Applications
1 11 (3.78%) JIRA
2 10 (3.44%) Git
3 5 (1.72%) GitLab
4 4 (1.37%) Jenkins
5 3 (1.03%) Vagrant
6 2 (0.69%) Oracle Forms
General
1 94 (32.30%) Social Skills
2 23 (7.90%) Finance
3 21 (7.22%) Analytical Skills
4 11 (3.78%) Organisational Skills
5 9 (3.09%) Banking
6 8 (2.75%) Manufacturing
6 8 (2.75%) Presentation Skills
6 8 (2.75%) Public Sector
7 6 (2.06%) Documentation Skills
7 6 (2.06%) Legal
8 5 (1.72%) Automotive
8 5 (1.72%) Inclusion and Diversity
9 4 (1.37%) Marketing
9 4 (1.37%) Telecoms
10 3 (1.03%) Law
10 3 (1.03%) Publishing
10 3 (1.03%) Retail
11 2 (0.69%) Aerospace
11 2 (0.69%) Pharmaceutical
12 1 (0.34%) Games
Libraries, Frameworks & Software Standards
1 7 (2.41%) HTML
1 7 (2.41%) LDAP
2 5 (1.72%) LAMP
3 3 (1.03%) 802.1X
3 3 (1.03%) EDI
4 2 (0.69%) .NET
4 2 (0.69%) Middleware
4 2 (0.69%) RabbitMQ
4 2 (0.69%) SAML
5 1 (0.34%) ARM Templates
5 1 (0.34%) ASP.NET
5 1 (0.34%) Elastic Stack
5 1 (0.34%) Web Services
5 1 (0.34%) WSH
5 1 (0.34%) YAML
Miscellaneous
1 14 (4.81%) Virtual Team
2 12 (4.12%) Management Information System
3 10 (3.44%) Self-Motivation
4 8 (2.75%) Onboarding
5 7 (2.41%) Data Centre
6 6 (2.06%) Life Science
7 5 (1.72%) Clustering
7 5 (1.72%) Reference Data
7 5 (1.72%) Replication
8 4 (1.37%) Wiki
9 3 (1.03%) Hybrid Cloud
9 3 (1.03%) Private Cloud
9 3 (1.03%) Renewable Energy
10 2 (0.69%) Data Protection Act
10 2 (0.69%) Driving Licence
10 2 (0.69%) Housing Association
10 2 (0.69%) Linux Command Line
10 2 (0.69%) Mobile App
10 2 (0.69%) PKI
10 2 (0.69%) Reinsurance
Operating Systems
1 148 (50.86%) Windows
2 90 (30.93%) Linux
3 70 (24.05%) Windows Server
4 40 (13.75%) Unix
5 26 (8.93%) Red Hat Enterprise Linux
6 22 (7.56%) Windows Server 2016
7 21 (7.22%) Windows Server 2019
8 20 (6.87%) CentOS
9 17 (5.84%) Ubuntu
10 15 (5.15%) Windows 10
11 10 (3.44%) Mac OS
11 10 (3.44%) Solaris
11 10 (3.44%) Windows Server 2012
12 8 (2.75%) Debian
13 7 (2.41%) Apple iOS
14 4 (1.37%) Windows 7
15 3 (1.03%) Android
15 3 (1.03%) Mac OS X
16 2 (0.69%) CoreOS
17 1 (0.34%) Rocky
Processes & Methodologies
1 75 (25.77%) Problem-Solving
2 37 (12.71%) Disaster Recovery
3 28 (9.62%) Customer Service
4 24 (8.25%) ITIL
5 23 (7.90%) Patch Management
6 19 (6.53%) Computer Science
7 18 (6.19%) Task Automation
7 18 (6.19%) Time Management
8 17 (5.84%) Change Management
9 16 (5.50%) Technology Transformation
10 15 (5.15%) High Availability
11 14 (4.81%) Customer Requirements
11 14 (4.81%) Test Strategy
12 13 (4.47%) DevOps
12 13 (4.47%) ERP
12 13 (4.47%) Infrastructure Engineering
13 12 (4.12%) Configuration Management
13 12 (4.12%) Performance Tuning
14 11 (3.78%) Continuous Improvement
14 11 (3.78%) Migration
Programming Languages
1 55 (18.90%) PowerShell
2 50 (17.18%) SQL
3 41 (14.09%) Python
4 29 (9.97%) Bash
5 16 (5.50%) Shell Script
6 14 (4.81%) Perl
7 11 (3.78%) PHP
8 4 (1.37%) C#
9 3 (1.03%) C++
9 3 (1.03%) Go
9 3 (1.03%) Java
10 1 (0.34%) AWK
10 1 (0.34%) C
10 1 (0.34%) DataFlex
10 1 (0.34%) Ruby
10 1 (0.34%) VBA
10 1 (0.34%) VBScript
Qualifications
1 69 (23.71%) Degree
2 36 (12.37%) Security Cleared
3 18 (6.19%) SC Cleared
4 14 (4.81%) CompTIA Security+
5 10 (3.44%) Computer Science Degree
5 10 (3.44%) DBS Check
6 8 (2.75%) Microsoft Certification
7 4 (1.37%) Azure Certification
7 4 (1.37%) DV Cleared
7 4 (1.37%) HNC
7 4 (1.37%) MCSE
8 3 (1.03%) CCNA
8 3 (1.03%) Cisco Certification
9 2 (0.69%) SANS
10 1 (0.34%) AWS Certification
10 1 (0.34%) CCNP
10 1 (0.34%) CISM
10 1 (0.34%) ITIL Foundation Certificate
10 1 (0.34%) LPIC
Quality Assurance & Compliance
1 8 (2.75%) Cyber Essentials
1 8 (2.75%) ISO/IEC 27001
2 7 (2.41%) GDPR
3 4 (1.37%) SLA
4 3 (1.03%) Cyber Essentials PLUS
5 1 (0.34%) NCSC
5 1 (0.34%) PCI DSS
System Software
1 101 (34.71%) Active Directory
2 68 (23.37%) VMware Infrastructure
3 27 (9.28%) Hyper-V
4 14 (4.81%) Firmware
5 12 (4.12%) Virtual Machines
6 11 (3.78%) Docker
7 10 (3.44%) vSphere
8 7 (2.41%) VMware NSX
9 5 (1.72%) NFS
9 5 (1.72%) Virtual Servers
10 3 (1.03%) Citrix Hypervisor
10 3 (1.03%) LXC
11 2 (0.69%) KVM
11 2 (0.69%) Shibboleth
11 2 (0.69%) Terminal Services
11 2 (0.69%) VMware ESXi
12 1 (0.34%) Microsoft App-V
12 1 (0.34%) Varnish
Systems Management
1 31 (10.65%) Microsoft Intune
2 25 (8.59%) SCCM
3 19 (6.53%) Ansible
4 16 (5.50%) Puppet
5 13 (4.47%) Terraform
6 7 (2.41%) Progress Chef
7 6 (2.06%) Jamf Pro
7 6 (2.06%) Kubernetes
8 5 (1.72%) Active Directory Federation Services
8 5 (1.72%) Nagios
9 4 (1.37%) EMC NetWorker
9 4 (1.37%) Single Sign-On
10 3 (1.03%) Cacti
10 3 (1.03%) SCOM
10 3 (1.03%) vCenter Server
10 3 (1.03%) ZABBIX
11 2 (0.69%) FortiGate
11 2 (0.69%) HAProxy
11 2 (0.69%) WSUS
11 2 (0.69%) yum
Vendors
1 90 (30.93%) VMware
2 82 (28.18%) Microsoft
3 27 (9.28%) Red Hat
4 23 (7.90%) Oracle
5 17 (5.84%) SolarWinds
6 12 (4.12%) Cisco
7 9 (3.09%) Google
7 9 (3.09%) Juniper
8 7 (2.41%) Aruba
8 7 (2.41%) Citrix
9 6 (2.06%) HP
9 6 (2.06%) NetApp
10 5 (1.72%) Centrify
10 5 (1.72%) EMC
11 4 (1.37%) Civica
11 4 (1.37%) Isilon
11 4 (1.37%) Sage
11 4 (1.37%) Splunk
12 3 (1.03%) Apple
12 3 (1.03%) Dell