Distributed Systems
UK

The table below looks at the prevalence of the term Distributed Systems in permanent job vacancies. Included is a benchmarking guide to the salaries offered in vacancies that have cited Distributed Systems over the 6 months to 27 April 2024 with a comparison to the same period over the previous 2 years.

6 months to
27 Apr 2024
Same period 2023 Same period 2022
Rank 422 384 208
Rank change year-on-year -38 -176 +53
Permanent jobs citing Distributed Systems 568 886 3,041
As % of all permanent jobs advertised in the UK 0.58% 0.85% 1.97%
As % of the Miscellaneous category 1.63% 1.97% 4.19%
Number of salaries quoted 372 427 672
10th Percentile £45,000 £58,765 £53,750
25th Percentile £60,000 £72,500 £68,750
Median annual salary (50th Percentile) £82,500 £87,500 £85,000
Median % change year-on-year -5.71% +2.94% +13.33%
75th Percentile £115,000 £108,750 £105,000
90th Percentile £145,000 £125,000 £120,000
UK excluding London median annual salary £65,000 £70,000 £72,500
% change year-on-year -7.14% -3.45% +11.54%

All Generic Skills
UK

Distributed Systems is in the General and Transferable Skills category. The following table is for comparison with the above and provides summary statistics for all permanent job vacancies with a requirement for generic IT skills.

Permanent vacancies with a requirement for generic IT skills 34,768 44,861 72,647
As % of all permanent jobs advertised in the UK 35.46% 42.86% 47.13%
Number of salaries quoted 22,918 24,128 34,106
10th Percentile £28,000 £35,107 £34,500
25th Percentile £38,000 £46,250 £45,607
Median annual salary (50th Percentile) £55,000 £65,000 £62,500
Median % change year-on-year -15.38% +4.00% +4.17%
75th Percentile £75,000 £86,250 £83,750
90th Percentile £97,500 £107,500 £102,500
UK excluding London median annual salary £50,000 £55,000 £52,500
% change year-on-year -9.09% +4.76% +5.00%

Distributed Systems
Job Vacancy Trend

Job postings citing Distributed Systems as a proportion of all IT jobs advertised.
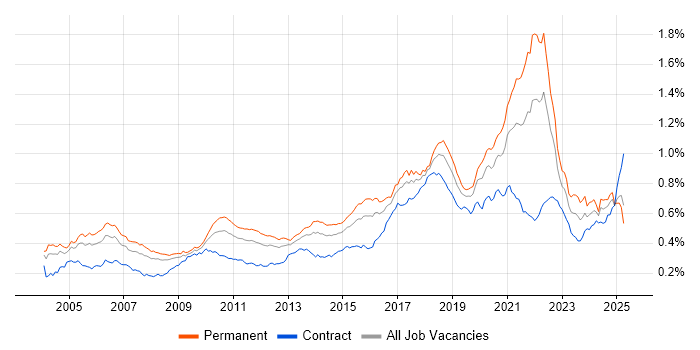
Job vacancy trend for Distributed Systems in the UK

Distributed Systems
Salary Trend

3-month moving average salary quoted in jobs citing Distributed Systems.

Salary trend for Distributed Systems in the UK

Distributed Systems
Salary Histogram

Salary distribution for jobs citing Distributed Systems over the 6 months to 27 April 2024.

Salary histogram for Distributed Systems in the UK

Distributed Systems
Top 17 Job Locations

The table below looks at the demand and provides a guide to the median salaries quoted in IT jobs citing Distributed Systems within the UK over the 6 months to 27 April 2024. The 'Rank Change' column provides an indication of the change in demand within each location based on the same 6 month period last year.

Location Rank Change
on Same Period
Last Year
Matching
Permanent
IT Job Ads
Median Salary
Past 6 Months
Median Salary
% Change
on Same Period
Last Year
Live
Jobs
England -40 482 £82,500 -5.71% 150
UK excluding London +106 313 £65,000 -7.14% 68
London -62 256 £95,000 +2.70% 99
Work from Home -69 174 £82,500 -2.94% 83
South East +77 120 £65,000 -16.13% 12
Scotland -28 56 £50,000 -25.93% 17
North of England +71 53 £68,000 -2.86% 17
Midlands +20 46 £58,550 -6.32% 4
West Midlands +33 38 £54,650 -12.56% 3
North West +27 29 £80,000 +14.29% 7
Yorkshire +97 22 £68,000 -20.00% 9
East of England +1 18 £120,000 +50.00% 10
South West -12 12 £62,500 +19.05% 5
East Midlands -9 8 £87,500 +45.83% 1
Northern Ireland - 7 £100,000 - 2
Wales +11 2 - - 1
North East -1 2 £75,000 +15.38% 1

Distributed Systems
Co-occurring Skills and Capabilities by Category

The follow tables expand on the table above by listing co-occurrences grouped by category. The same employment type, locality and period is covered with up to 20 co-occurrences shown in each of the following categories:

Application Platforms
1 38 (6.69%) OpenStack
2 30 (5.28%) Apache Spark
3 26 (4.58%) IIS
4 14 (2.46%) Apache
4 14 (2.46%) Confluence
5 11 (1.94%) JBoss
6 10 (1.76%) Apache Airflow
6 10 (1.76%) Red Hat Fuse
7 4 (0.70%) CMS
7 4 (0.70%) MQSeries
8 3 (0.53%) Ethereum
8 3 (0.53%) Hyperledger
9 2 (0.35%) Jupyter
10 1 (0.18%) Adobe Experience Manager
10 1 (0.18%) Headless CMS
Applications
1 1 (0.18%) Microsoft Office
1 1 (0.18%) MS Visio
1 1 (0.18%) Simulink
Business Applications
1 1 (0.18%) Salesforce CRM
1 1 (0.18%) SAP S/4HANA
Cloud Services
1 256 (45.07%) AWS
2 188 (33.10%) Azure
3 96 (16.90%) Serverless
4 62 (10.92%) Azure DevOps
5 54 (9.51%) GCP
6 49 (8.63%) Amazon EKS
7 48 (8.45%) AWS Lambda
8 46 (8.10%) Amazon ECS
9 44 (7.75%) GitHub
10 40 (7.04%) IBM Cloud
11 29 (5.11%) GitHub Actions
12 27 (4.75%) Cloud Computing
13 24 (4.23%) Amazon Kinesis
14 23 (4.05%) AWS CloudFormation
15 20 (3.52%) Amazon EC2
15 20 (3.52%) Amazon S3
16 19 (3.35%) Datadog
17 18 (3.17%) Amazon SQS
17 18 (3.17%) SaaS
18 17 (2.99%) PaaS
Communications & Networking
1 26 (4.58%) WAN
2 14 (2.46%) Network Security
3 10 (1.76%) HTTP
4 9 (1.58%) DNS
4 9 (1.58%) Firewall
5 1 (0.18%) Software-Defined Networking
Database & Business Intelligence
1 87 (15.32%) NoSQL
2 69 (12.15%) PostgreSQL
3 61 (10.74%) Relational Database
4 40 (7.04%) SQL Server
5 28 (4.93%) Data Warehouse
5 28 (4.93%) DynamoDB
6 25 (4.40%) Big Data
7 24 (4.23%) MySQL
8 19 (3.35%) Hadoop
9 16 (2.82%) OLAP
10 15 (2.64%) Apache Hive
11 13 (2.29%) Data Lake
11 13 (2.29%) Flink
12 12 (2.11%) Amazon RDS
12 12 (2.11%) InfluxDB
13 9 (1.58%) BigQuery
14 8 (1.41%) Azure SQL Database
14 8 (1.41%) CockroachDB
14 8 (1.41%) Parquet
14 8 (1.41%) RDBMS
Development Applications
1 100 (17.61%) Git
2 99 (17.43%) Jenkins
3 29 (5.11%) CircleCI
4 27 (4.75%) JIRA
5 21 (3.70%) Subversion
6 18 (3.17%) Sonatype Nexus
7 17 (2.99%) JUnit
8 15 (2.64%) SonarQube
9 14 (2.46%) GitLab
10 11 (1.94%) Bitbucket
10 11 (1.94%) Visual Studio
11 10 (1.76%) IntelliJ
12 8 (1.41%) Jaeger
13 6 (1.06%) Crashlytics
14 5 (0.88%) Cucumber
14 5 (0.88%) JMeter
14 5 (0.88%) LabVIEW
14 5 (0.88%) Mockito
15 3 (0.53%) TeamCity
16 2 (0.35%) Artifactory
General
1 139 (24.47%) Social Skills
2 116 (20.42%) Finance
3 109 (19.19%) Public Sector
4 78 (13.73%) Inclusion and Diversity
5 58 (10.21%) Law
6 47 (8.27%) Banking
7 35 (6.16%) Marketing
8 31 (5.46%) Analytical Skills
9 21 (3.70%) Electronics
10 19 (3.35%) Legal
10 19 (3.35%) Organisational Skills
11 18 (3.17%) Front Office
12 17 (2.99%) Financial Institution
13 15 (2.64%) Games
14 14 (2.46%) Investment Banking
14 14 (2.46%) Retail
15 8 (1.41%) Presentation Skills
15 8 (1.41%) Retail Banking
15 8 (1.41%) Tech for Good
16 7 (1.23%) Telecoms
Job Titles
1 151 (26.58%) Developer
2 127 (22.36%) Software Engineer
3 108 (19.01%) Senior
4 94 (16.55%) Lead
5 68 (11.97%) Java Developer
6 50 (8.80%) Cloud Engineer
7 43 (7.57%) Lead Software Engineer
8 42 (7.39%) Senior Software Engineer
9 39 (6.87%) Architect
10 33 (5.81%) DevOps Engineer
11 31 (5.46%) Senior Developer
12 28 (4.93%) Full Stack Developer
12 28 (4.93%) Software Developer
13 27 (4.75%) Systems Engineer
14 23 (4.05%) Software Manager
15 22 (3.87%) Full Stack Java Developer
16 20 (3.52%) Cloud Native Engineer
16 20 (3.52%) Cloud Software Engineer
16 20 (3.52%) Data Engineer
16 20 (3.52%) SC Cleared Java Developer
Libraries, Frameworks & Software Standards
1 80 (14.08%) .NET
2 72 (12.68%) Web Services
3 71 (12.50%) Node.js
3 71 (12.50%) REST
4 69 (12.15%) AngularJS
5 68 (11.97%) Spring
6 65 (11.44%) React
7 63 (11.09%) Spring Boot
8 57 (10.04%) RESTful
9 52 (9.15%) Elastic Stack
10 51 (8.98%) Kafka
11 43 (7.57%) Apache Camel
12 35 (6.16%) JSON
13 31 (5.46%) XML
14 28 (4.93%) .NET Core
15 27 (4.75%) OpenTelemetry
16 24 (4.23%) HTML
17 20 (3.52%) .NET Framework
17 20 (3.52%) CSS
18 17 (2.99%) Hibernate
Miscellaneous
1 91 (16.02%) Cloud Native
2 64 (11.27%) Public Cloud
3 49 (8.63%) Blockchain
4 46 (8.10%) Hybrid Cloud
5 36 (6.34%) Legacy Code
6 31 (5.46%) Algorithms
7 30 (5.28%) Greenfield Project
8 26 (4.58%) Clustering
9 21 (3.70%) Management Information System
10 17 (2.99%) Hedge funds
11 16 (2.82%) Data Structures
11 16 (2.82%) IoT
12 13 (2.29%) Foreign Exchange (FX)
12 13 (2.29%) Robotics
13 12 (2.11%) Blog
13 12 (2.11%) Enterprise Software
13 12 (2.11%) Self-Motivation
13 12 (2.11%) Virtual Team
14 11 (1.94%) Distributed Applications
14 11 (1.94%) RISC-V
Operating Systems
1 152 (26.76%) Linux
2 42 (7.39%) Windows
3 40 (7.04%) Alpine Linux
3 40 (7.04%) CentOS
3 40 (7.04%) Debian
4 20 (3.52%) Windows 10
5 11 (1.94%) Ubuntu
6 8 (1.41%) Android
6 8 (1.41%) Apple iOS
7 4 (0.70%) VMS
8 3 (0.53%) Unix
9 2 (0.35%) Embedded Linux
Processes & Methodologies
1 253 (44.54%) Software Engineering
2 222 (39.08%) Agile
3 214 (37.68%) CI/CD
4 201 (35.39%) DevOps
5 183 (32.22%) Microservices
6 103 (18.13%) Full Stack Development
7 81 (14.26%) Artificial Intelligence
8 79 (13.91%) TDD
9 76 (13.38%) Containerisation
10 74 (13.03%) Computer Science
11 73 (12.85%) SDLC
12 72 (12.68%) Problem-Solving
13 71 (12.50%) Scrum
14 69 (12.15%) Kanban
15 67 (11.80%) Continuous Delivery
16 66 (11.62%) Analytics
17 61 (10.74%) Data Science
18 54 (9.51%) Machine Learning
19 53 (9.33%) BDD
20 51 (8.98%) Mentoring
Programming Languages
1 216 (38.03%) Java
2 128 (22.54%) SQL
3 123 (21.65%) Python
4 122 (21.48%) JavaScript
5 113 (19.89%) C#
6 80 (14.08%) Go
7 69 (12.15%) C++
8 63 (11.09%) TypeScript
9 60 (10.56%) C
10 48 (8.45%) Rust
11 34 (5.99%) Scala
12 22 (3.87%) F#
13 19 (3.35%) PowerShell
14 18 (3.17%) Bash
14 18 (3.17%) Shell Script
15 15 (2.64%) Haskell
16 14 (2.46%) Clojure
16 14 (2.46%) Kotlin
17 11 (1.94%) Embedded C
18 8 (1.41%) Perl
Qualifications
1 86 (15.14%) Degree
2 68 (11.97%) Security Cleared
3 56 (9.86%) Azure Certification
4 51 (8.98%) Computer Science Degree
5 47 (8.27%) Microsoft Certification
6 40 (7.04%) MCSA
6 40 (7.04%) MCSE
7 37 (6.51%) SC Cleared
8 25 (4.40%) Master's Degree
9 14 (2.46%) AWS Certification
10 9 (1.58%) PhD
11 7 (1.23%) CISSP
11 7 (1.23%) GIAC
12 6 (1.06%) CISM
12 6 (1.06%) SANS
13 5 (0.88%) BPSS Clearance
14 4 (0.70%) AWS Certified Solutions Architect
15 1 (0.18%) DBS Check
15 1 (0.18%) HNC
15 1 (0.18%) HND
Quality Assurance & Compliance
1 10 (1.76%) PCI DSS
2 8 (1.41%) GDPR
2 8 (1.41%) HIPAA
3 7 (1.23%) ISO/IEC 27001
4 6 (1.06%) COBIT
4 6 (1.06%) Data Quality
4 6 (1.06%) NIST
4 6 (1.06%) Web Application Security Consortium
5 4 (0.70%) Accessibility
5 4 (0.70%) QA
6 3 (0.53%) ISO 9000
7 1 (0.18%) California Consumer Privacy Act
System Software
1 206 (36.27%) Docker
2 26 (4.58%) VMware NSX
3 25 (4.40%) Hyper-V
4 8 (1.41%) HDFS
Systems Management
1 256 (45.07%) Kubernetes
2 116 (20.42%) Terraform
3 85 (14.96%) Ansible
4 38 (6.69%) Grafana
5 37 (6.51%) Prometheus
6 14 (2.46%) Packer
7 9 (1.58%) Kibana
7 9 (1.58%) Progress Chef
8 8 (1.41%) Kiali
9 7 (1.23%) Puppet
10 6 (1.06%) Computer Emergency Response Teams
11 5 (0.88%) Salt
12 2 (0.35%) Argo
13 1 (0.18%) Consul
13 1 (0.18%) Rancher
Vendors
1 62 (10.92%) Microsoft
2 42 (7.39%) IBM
3 41 (7.22%) Red Hat
4 38 (6.69%) WSO2
5 32 (5.63%) Splunk
6 27 (4.75%) Dynatrace
7 26 (4.58%) VMware
8 17 (2.99%) Google
9 14 (2.46%) Databricks
10 12 (2.11%) Atlassian
11 10 (1.76%) AppDynamics
12 8 (1.41%) Cloudera
12 8 (1.41%) TIBCO
13 6 (1.06%) Amplitude
13 6 (1.06%) SAP
14 4 (0.70%) Solace
15 3 (0.53%) CrowdStrike
15 3 (0.53%) Oracle
16 2 (0.35%) NVIDIA
16 2 (0.35%) Thales