MongoDB
UK

The following table provides summary statistics for permanent job vacancies with a requirement for MongoDB skills. Included is a benchmarking guide to the salaries offered in vacancies that have cited MongoDB over the 6 months to 10 December 2023 with a comparison to the same period in the previous 2 years.

6 months to
10 Dec 2023
Same period 2022 Same period 2021
Rank 267 240 155
Rank change year-on-year -27 -85 -20
Permanent jobs citing MongoDB 651 1,901 3,179
As % of all permanent jobs advertised in the UK 1.25% 1.56% 2.50%
As % of the Database & Business Intelligence category 5.81% 6.69% 9.26%
Number of salaries quoted 468 1,120 1,690
10th Percentile £43,750 £42,375 £42,500
25th Percentile £50,639 £53,750 £51,250
Median annual salary (50th Percentile) £65,000 £70,000 £67,500
Median % change year-on-year -7.14% +3.70% +8.00%
75th Percentile £85,000 £91,250 £85,000
90th Percentile £105,000 £105,000 £100,000
UK excluding London median annual salary £60,000 £60,000 £55,500
% change year-on-year - +8.11% +5.71%

All Database and Business Intelligence Skills
UK

MongoDB is in the Databases and Business Intelligence category. The following table is for comparison with the above and provides summary statistics for all permanent job vacancies with a requirement for database or business intelligence skills.

Permanent vacancies with a requirement for database or business intelligence skills 11,214 28,399 34,324
As % of all permanent jobs advertised in the UK 21.45% 23.23% 27.01%
Number of salaries quoted 8,322 17,485 22,575
10th Percentile £36,750 £36,750 £35,457
25th Percentile £46,875 £46,250 £42,625
Median annual salary (50th Percentile) £60,000 £62,500 £58,500
Median % change year-on-year -4.00% +6.84% +6.36%
75th Percentile £80,000 £82,500 £77,500
90th Percentile £95,000 £100,000 £95,000
UK excluding London median annual salary £55,000 £55,000 £50,000
% change year-on-year - +10.00% +2.04%

MongoDB
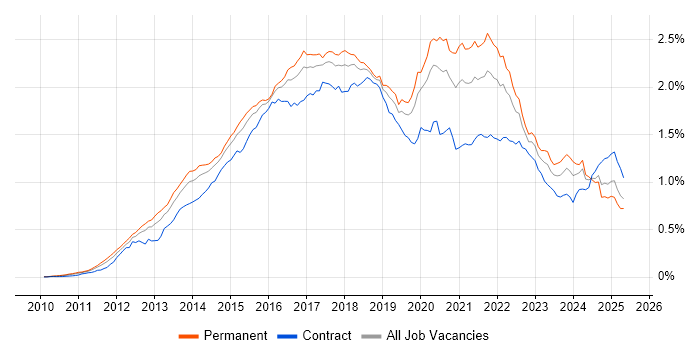
Job Vacancy Trend

Job postings citing MongoDB as a proportion of all IT jobs advertised.

Job vacancy trend for MongoDB in the UK

MongoDB
Salary Trend

3-month moving average salary quoted in jobs citing MongoDB.

Salary trend for MongoDB in the UK

MongoDB
Salary Histogram

Salary distribution for jobs citing MongoDB over the 6 months to 10 December 2023.

Salary histogram for MongoDB in the UK

MongoDB
Top 17 Job Locations

The table below looks at the demand and provides a guide to the median salaries quoted in IT jobs citing MongoDB within the UK over the 6 months to 10 December 2023. The 'Rank Change' column provides an indication of the change in demand within each location based on the same 6 month period last year.

Location Rank Change
on Same Period
Last Year
Matching
Permanent
IT Job Ads
Median Salary
Past 6 Months
Median Salary
% Change
on Same Period
Last Year
Live
Jobs
England -33 529 £65,000 -7.14% 269
UK excluding London +48 359 £60,000 - 169
Work from Home -10 323 £65,000 - 185
London -77 218 £85,000 - 125
North of England +89 104 £60,000 - 46
North West +67 66 £61,000 +1.67% 27
South East +77 65 £52,500 -19.23% 51
South West +16 65 £56,250 +7.14% 19
Scotland +15 48 £56,318 -13.36% 10
Midlands +62 38 £60,000 +6.23% 20
Yorkshire +79 33 £51,500 -6.36% 15
West Midlands +64 25 £55,000 -2.62% 13
East of England +99 22 £60,000 -7.69% 21
East Midlands +45 13 £65,000 - 7
Wales +9 11 £45,000 -21.74% 3
Northern Ireland +25 6 £70,000 +40.00% 2
North East +45 5 £57,500 +4.55% 4

MongoDB
Co-occurring Skills and Capabilities by Category

The follow tables expand on the table above by listing co-occurrences grouped by category. The same employment type, locality and period is covered with up to 20 co-occurrences shown in each of the following categories:

Application Platforms
1 26 (3.99%) Confluence
2 21 (3.23%) nginx
3 15 (2.30%) Apache
3 15 (2.30%) SharePoint
4 14 (2.15%) Apache Spark
4 14 (2.15%) MS Exchange
5 9 (1.38%) CMS
5 9 (1.38%) Tomcat
6 8 (1.23%) Apache Airflow
6 8 (1.23%) IIS
7 7 (1.08%) Apache Solr
7 7 (1.08%) Drupal
8 4 (0.61%) Luigi
9 3 (0.46%) NServiceBus
9 3 (0.46%) Oracle SOA Suite
9 3 (0.46%) Tornado
10 2 (0.31%) JBoss
10 2 (0.31%) Jetty
10 2 (0.31%) Oracle Workflow
10 2 (0.31%) WebLogic
Applications
1 1 (0.15%) Chatbot
1 1 (0.15%) SOLIDWORKS
Business Applications
1 1 (0.15%) Magento
1 1 (0.15%) SAP Business One
1 1 (0.15%) Shopify
Cloud Services
1 324 (49.77%) AWS
2 220 (33.79%) Azure
3 67 (10.29%) GCP
4 55 (8.45%) Serverless
5 50 (7.68%) SaaS
6 44 (6.76%) AWS Lambda
7 42 (6.45%) Azure DevOps
8 40 (6.14%) OpenShift
9 27 (4.15%) Amazon S3
10 25 (3.84%) Azure Cosmos DB
11 21 (3.23%) Amazon SQS
12 19 (2.92%) Amazon EC2
12 19 (2.92%) Amazon ECS
13 15 (2.30%) GitHub
14 13 (2.00%) AWS CodeCommit
14 13 (2.00%) Azure Service Bus
14 13 (2.00%) BlazeMeter
14 13 (2.00%) PaaS
14 13 (2.00%) Power Platform
15 12 (1.84%) Route 53
Communications & Networking
1 21 (3.23%) AMQP
2 12 (1.84%) Firewall
3 11 (1.69%) HTTP
4 8 (1.23%) DNS
5 6 (0.92%) DSL
6 5 (0.77%) FTP
7 4 (0.61%) RFID
7 4 (0.61%) VPN
8 3 (0.46%) Internet
8 3 (0.46%) SNMP
8 3 (0.46%) TCP/IP
8 3 (0.46%) tcpdump
9 2 (0.31%) DHCP
9 2 (0.31%) IPv6
9 2 (0.31%) LAN
9 2 (0.31%) WAN
10 1 (0.15%) 3G
10 1 (0.15%) Multicast
10 1 (0.15%) Reverse Proxy
Database & Business Intelligence
1 175 (26.88%) PostgreSQL
2 156 (23.96%) MySQL
3 132 (20.28%) NoSQL
4 119 (18.28%) Elasticsearch
5 78 (11.98%) SQL Server
6 52 (7.99%) Hadoop
7 48 (7.37%) Relational Database
8 40 (6.14%) Redis
9 32 (4.92%) Apache Cassandra
10 31 (4.76%) Big Data
11 27 (4.15%) Metadata
12 25 (3.84%) DynamoDB
13 21 (3.23%) Data Lake
14 19 (2.92%) BigQuery
15 18 (2.76%) Oracle Database
16 16 (2.46%) Amazon RDS
16 16 (2.46%) Data Warehouse
17 14 (2.15%) Tableau
18 13 (2.00%) Amazon Redshift
19 12 (1.84%) Azure SQL Database
Development Applications
1 127 (19.51%) Git
2 103 (15.82%) Jenkins
3 58 (8.91%) Cucumber
4 47 (7.22%) Selenium
5 44 (6.76%) Cypress.io
6 40 (6.14%) Maven
7 34 (5.22%) JIRA
8 29 (4.45%) GitLab
9 25 (3.84%) JUnit
10 20 (3.07%) JMeter
11 17 (2.61%) Postman
12 16 (2.46%) Mocha
13 15 (2.30%) webpack
14 13 (2.00%) REST Assured
15 12 (1.84%) ClearCase
15 12 (1.84%) eggPlant
15 12 (1.84%) Mockito
15 12 (1.84%) SoapUI
15 12 (1.84%) The Grinder
16 11 (1.69%) Bitbucket
General
1 187 (28.73%) Finance
2 104 (15.98%) Analytical Skills
3 102 (15.67%) Inclusion and Diversity
4 93 (14.29%) Social Skills
5 64 (9.83%) Banking
6 32 (4.92%) Law
7 30 (4.61%) Games
8 28 (4.30%) Marketing
9 23 (3.53%) Aerospace
10 20 (3.07%) Public Sector
11 16 (2.46%) Automotive
12 15 (2.30%) Financial Institution
13 10 (1.54%) Back Office
14 9 (1.38%) Retail
15 7 (1.08%) Publishing
15 7 (1.08%) Telecoms
16 6 (0.92%) Investment Banking
17 5 (0.77%) Front Office
17 5 (0.77%) Legal
17 5 (0.77%) Tech for Good
Job Titles
1 233 (35.79%) Developer
2 161 (24.73%) Senior
3 150 (23.04%) Software Engineer
4 73 (11.21%) Lead
5 61 (9.37%) Java Developer
6 49 (7.53%) Full Stack Engineer
7 48 (7.37%) Senior Developer
8 41 (6.30%) Full Stack Software Engineer
9 40 (6.14%) Full Stack Developer
10 39 (5.99%) Senior Software Engineer
11 37 (5.68%) .NET Developer
12 31 (4.76%) PHP Developer
13 30 (4.61%) Architect
13 30 (4.61%) DBA
13 30 (4.61%) DevOps Engineer
13 30 (4.61%) Software Developer
14 29 (4.45%) Data Engineer
15 27 (4.15%) Administrator
16 26 (3.99%) Java Engineer
16 26 (3.99%) Lead Software Engineer
Libraries, Frameworks & Software Standards
1 208 (31.95%) React
2 174 (26.73%) HTML
3 159 (24.42%) Node.js
4 146 (22.43%) AngularJS
5 142 (21.81%) CSS
6 102 (15.67%) .NET
7 99 (15.21%) RESTful
8 91 (13.98%) Spring
9 77 (11.83%) Express.js
9 77 (11.83%) MERN Stack
10 72 (11.06%) Kafka
11 61 (9.37%) JSON
12 55 (8.45%) MEAN Stack
13 52 (7.99%) RabbitMQ
14 51 (7.83%) HTML5
15 49 (7.53%) Vue
16 45 (6.91%) Spring Boot
17 39 (5.99%) REST
18 33 (5.07%) .NET Core
18 33 (5.07%) .NET Framework
Miscellaneous
1 66 (10.14%) Product Ownership
2 55 (8.45%) Cloud Native
3 30 (4.61%) Distributed Systems
4 26 (3.99%) Cyberattack
5 23 (3.53%) Self-Motivation
6 21 (3.23%) Management Information System
7 16 (2.46%) Reference Data
8 11 (1.69%) Data Structures
8 11 (1.69%) Greenfield Project
8 11 (1.69%) Public Cloud
9 10 (1.54%) Mobile App
10 9 (1.38%) Algorithms
11 8 (1.23%) Hedge funds
12 7 (1.08%) Hackathon
13 6 (0.92%) Educational Technology
13 6 (0.92%) Legacy Systems
14 5 (0.77%) Data Protection Act
14 5 (0.77%) Virtual Team
15 4 (0.61%) Clustering
15 4 (0.61%) Replication
Operating Systems
1 93 (14.29%) Linux
2 50 (7.68%) Windows
3 30 (4.61%) Unix
4 29 (4.45%) CentOS
5 28 (4.30%) Windows Server 2019
6 23 (3.53%) Windows Server 2012
6 23 (3.53%) Windows Server 2016
7 8 (1.23%) Ubuntu
8 7 (1.08%) Windows 10
9 4 (0.61%) Android
9 4 (0.61%) Apple iOS
10 2 (0.31%) Red Hat Enterprise Linux
10 2 (0.31%) Windows Server
Processes & Methodologies
1 309 (47.47%) Agile
2 228 (35.02%) Software Engineering
3 203 (31.18%) DevOps
4 161 (24.73%) Microservices
5 125 (19.20%) CI/CD
6 110 (16.90%) Full Stack Development
7 104 (15.98%) Problem-Solving
8 101 (15.51%) Test Automation
9 98 (15.05%) Mentoring
10 94 (14.44%) Continuous Integration
11 76 (11.67%) SDLC
12 75 (11.52%) Scrum
13 74 (11.37%) Design Patterns
14 67 (10.29%) API Development
15 61 (9.37%) Continuous Delivery
16 50 (7.68%) Artificial Intelligence
17 48 (7.37%) Data Modelling
18 47 (7.22%) Roadmaps
18 47 (7.22%) TDD
19 45 (6.91%) User Experience
Programming Languages
1 272 (41.78%) SQL
2 246 (37.79%) Java
3 221 (33.95%) JavaScript
4 163 (25.04%) Python
5 116 (17.82%) C#
6 69 (10.60%) TypeScript
7 64 (9.83%) PHP
8 61 (9.37%) Bash
8 61 (9.37%) PowerShell
9 48 (7.37%) C++
10 26 (3.99%) Go
11 21 (3.23%) Groovy
11 21 (3.23%) Shell Script
12 20 (3.07%) Perl
13 17 (2.61%) T-SQL
14 16 (2.46%) Scala
15 14 (2.15%) C
16 13 (2.00%) PL/SQL
17 12 (1.84%) Tcl
18 10 (1.54%) Kotlin
Qualifications
1 107 (16.44%) Security Cleared
2 59 (9.06%) Degree
3 51 (7.83%) DV Cleared
4 28 (4.30%) Computer Science Degree
5 23 (3.53%) SC Cleared
6 14 (2.15%) AWS Certification
6 14 (2.15%) CCNA
6 14 (2.15%) Cisco Certification
7 8 (1.23%) BPSS Clearance
8 7 (1.08%) Master's Degree
9 6 (0.92%) Azure Certification
10 4 (0.61%) CISM
10 4 (0.61%) CISSP
11 3 (0.46%) ITIL Certification
11 3 (0.46%) MCSE
11 3 (0.46%) Microsoft Certification
12 2 (0.31%) DBS Check
12 2 (0.31%) OCP
12 2 (0.31%) Oracle Certification
13 1 (0.15%) AWS Certified Solutions Architect
Quality Assurance & Compliance
1 33 (5.07%) QA
2 10 (1.54%) Accessibility
3 9 (1.38%) SLA
4 2 (0.31%) ISO/IEC 27001
4 2 (0.31%) WCAG
5 1 (0.15%) Data Quality
5 1 (0.15%) ISO 9001
System Software
1 192 (29.49%) Docker
2 27 (4.15%) Active Directory
3 11 (1.69%) VMware Infrastructure
4 4 (0.61%) Apache ZooKeeper
4 4 (0.61%) Ceph
5 3 (0.46%) Oracle RAC
5 3 (0.46%) Virtual Machines
5 3 (0.46%) VMware ESXi
6 1 (0.15%) Apache Flume
6 1 (0.15%) KVM
6 1 (0.15%) Varnish
Systems Management
1 183 (28.11%) Kubernetes
2 58 (8.91%) Terraform
3 36 (5.53%) Ansible
4 12 (1.84%) Grafana
5 10 (1.54%) HP Quality Center
6 9 (1.38%) Puppet
7 7 (1.08%) MIIS
7 7 (1.08%) Prometheus
8 5 (0.77%) Cobbler
8 5 (0.77%) ZABBIX
9 4 (0.61%) Nagios
9 4 (0.61%) Progress Chef
10 3 (0.46%) Data Guard
10 3 (0.46%) Oracle RMAN
10 3 (0.46%) Single Sign-On
10 3 (0.46%) vCenter Server
11 2 (0.31%) Docker Swarm
11 2 (0.31%) HAProxy
11 2 (0.31%) Istio
11 2 (0.31%) Kustomize
Vendors
1 119 (18.28%) Oracle
2 51 (7.83%) Microsoft
3 29 (4.45%) Red Hat
4 28 (4.30%) Google
5 14 (2.15%) Cisco
6 12 (1.84%) Databricks
6 12 (1.84%) MKS
7 11 (1.69%) VMware
8 10 (1.54%) HP
8 10 (1.54%) Splunk
8 10 (1.54%) Sun
9 7 (1.08%) Alteryx
10 6 (0.92%) Cognos
10 6 (0.92%) Sybase
11 5 (0.77%) New Relic
12 3 (0.46%) Dynatrace
12 3 (0.46%) Okta
12 3 (0.46%) Samsung
12 3 (0.46%) SAP
12 3 (0.46%) Solace