SQL Server Integration Services Jobs

Microsoft SQL Server Integration Services (SSIS)
UK

The following table provides summary statistics for permanent job vacancies with a requirement for SQL Server Integration Services skills. Included is a benchmarking guide to the salaries offered in vacancies that have cited SQL Server Integration Services over the 6 months to 10 December 2023 with a comparison to the same period in the previous 2 years.

6 months to
10 Dec 2023
Same period 2022 Same period 2021
Rank 274 266 208
Rank change year-on-year -8 -58 -44
Permanent jobs citing SQL Server Integration Services 629 1,695 2,380
As % of all permanent jobs advertised in the UK 1.20% 1.39% 1.87%
As % of the Database & Business Intelligence category 5.61% 5.97% 6.93%
Number of salaries quoted 568 1,421 1,983
10th Percentile £36,095 £40,000 £36,750
25th Percentile £46,250 £47,000 £42,500
Median annual salary (50th Percentile) £57,500 £57,500 £53,000
Median % change year-on-year - +8.49% +6.00%
75th Percentile £72,500 £75,000 £67,500
90th Percentile £87,500 £87,500 £77,500
UK excluding London median annual salary £47,500 £52,000 £47,500
% change year-on-year -8.65% +9.47% +2.15%

All Database and Business Intelligence Skills
UK

SQL Server Integration Services is in the Databases and Business Intelligence category. The following table is for comparison with the above and provides summary statistics for all permanent job vacancies with a requirement for database or business intelligence skills.

Permanent vacancies with a requirement for database or business intelligence skills 11,214 28,399 34,324
As % of all permanent jobs advertised in the UK 21.45% 23.23% 27.01%
Number of salaries quoted 8,322 17,485 22,575
10th Percentile £36,750 £36,750 £35,457
25th Percentile £46,875 £46,250 £42,625
Median annual salary (50th Percentile) £60,000 £62,500 £58,500
Median % change year-on-year -4.00% +6.84% +6.36%
75th Percentile £80,000 £82,500 £77,500
90th Percentile £95,000 £100,000 £95,000
UK excluding London median annual salary £55,000 £55,000 £50,000
% change year-on-year - +10.00% +2.04%

SQL Server Integration Services
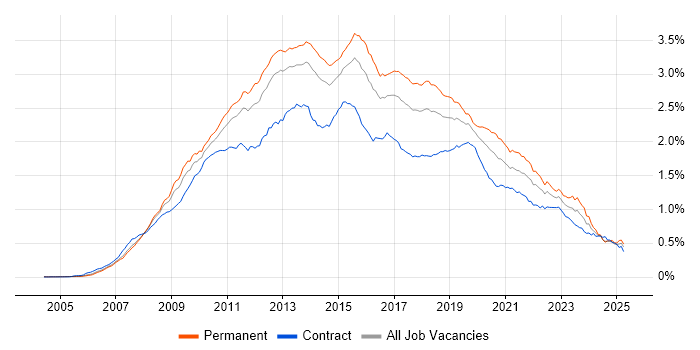
Job Vacancy Trend

Job postings citing SQL Server Integration Services as a proportion of all IT jobs advertised.

Job vacancy trend for SQL Server Integration Services in the UK

SQL Server Integration Services
Salary Trend

3-month moving average salary quoted in jobs citing SQL Server Integration Services.

Salary trend for SQL Server Integration Services in the UK

SQL Server Integration Services
Salary Histogram

Salary distribution for jobs citing SQL Server Integration Services over the 6 months to 10 December 2023.

Salary histogram for SQL Server Integration Services in the UK

SQL Server Integration Services
Top 16 Job Locations

The table below looks at the demand and provides a guide to the median salaries quoted in IT jobs citing SQL Server Integration Services within the UK over the 6 months to 10 December 2023. The 'Rank Change' column provides an indication of the change in demand within each location based on the same 6 month period last year.

Location Rank Change
on Same Period
Last Year
Matching
Permanent
IT Job Ads
Median Salary
Past 6 Months
Median Salary
% Change
on Same Period
Last Year
Live
Jobs
England -3 561 £57,500 -4.17% 195
UK excluding London -10 340 £47,500 -8.65% 123
Work from Home 0 277 £55,000 -4.35% 121
London +10 258 £70,000 +3.70% 77
North of England +10 99 £47,500 -8.65% 44
Midlands +69 80 £47,500 -9.52% 28
South East +50 53 £52,500 +5.00% 20
North West +25 52 £45,000 -5.26% 26
South West +36 49 £52,500 +7.69% 11
West Midlands +72 46 £46,750 -8.78% 16
Yorkshire +37 45 £48,750 -15.22% 9
Scotland +43 34 £40,000 -4.76% 11
East Midlands +42 34 £47,500 -13.64% 12
East of England +67 16 £55,000 - 7
Wales -28 11 £45,000 -10.00% 2
North East +25 2 £57,500 +4.55% 9

SQL Server Integration Services
Co-occurring Skills and Capabilities by Category

The follow tables expand on the table above by listing co-occurrences grouped by category. The same employment type, locality and period is covered with up to 20 co-occurrences shown in each of the following categories:

Application Platforms
1 40 (6.36%) IIS
2 33 (5.25%) SharePoint
3 7 (1.11%) Confluence
4 6 (0.95%) Tomcat
5 3 (0.48%) Apache
5 3 (0.48%) Mendix
6 1 (0.16%) Apache Spark
6 1 (0.16%) CMS
Applications
1 73 (11.61%) Microsoft Excel
2 53 (8.43%) Microsoft Office
3 2 (0.32%) Microsoft PowerPoint
3 2 (0.32%) MS Visio
4 1 (0.16%) Microsoft Project
Business Applications
1 57 (9.06%) Dynamics CRM
2 13 (2.07%) BusinessWorks
3 9 (1.43%) Shopify
4 5 (0.79%) NetSuite
4 5 (0.79%) Unit4 Business World
5 4 (0.64%) Dynamics NAV
6 3 (0.48%) Dynamics AX
7 2 (0.32%) Scribe Insight
8 1 (0.16%) Elite 3E
8 1 (0.16%) iTrent
8 1 (0.16%) Oracle EBS
Cloud Services
1 311 (49.44%) Azure
2 302 (48.01%) Power Platform
3 102 (16.22%) Azure Data Factory
4 73 (11.61%) Azure DevOps
5 48 (7.63%) PowerApps
6 45 (7.15%) AWS
7 40 (6.36%) Power Automate
8 35 (5.56%) Azure Synapse Analytics
9 34 (5.41%) Dynamics 365
10 30 (4.77%) Azure Logic Apps
11 22 (3.50%) Serverless
12 17 (2.70%) Microsoft 365
13 16 (2.54%) Azure Service Bus
14 14 (2.23%) Azure Functions
14 14 (2.23%) GCP
14 14 (2.23%) Snowflake
15 11 (1.75%) SaaS
16 7 (1.11%) Azure Event Grid
16 7 (1.11%) GitHub
17 6 (0.95%) Azure Cosmos DB
Communications & Networking
1 11 (1.75%) Internet
2 8 (1.27%) VPN
3 5 (0.79%) Firewall
3 5 (0.79%) iSCSI
3 5 (0.79%) Network Security
4 3 (0.48%) DNS
4 3 (0.48%) FTP
5 2 (0.32%) BGP
6 1 (0.16%) BIG-IP
6 1 (0.16%) DHCP
6 1 (0.16%) Intranet
6 1 (0.16%) SSL
6 1 (0.16%) TCP/IP
Database & Business Intelligence
1 429 (68.20%) SQL Server
2 325 (51.67%) SQL Server Reporting Services
3 277 (44.04%) Power BI
4 231 (36.72%) Data Warehouse
5 155 (24.64%) SQL Server Analysis Services
6 74 (11.76%) Azure SQL Database
7 55 (8.74%) Data Lake
8 44 (7.00%) Relational Database
9 39 (6.20%) Tableau
10 32 (5.09%) Microsoft Analysis Services
11 21 (3.34%) Power Query
12 18 (2.86%) MySQL
13 15 (2.38%) Azure SQL Data Warehouse
13 15 (2.38%) Oracle Database
13 15 (2.38%) RDBMS
14 12 (1.91%) OLAP
15 11 (1.75%) Enterprise Data Warehouse
15 11 (1.75%) Star Schema
16 10 (1.59%) Spark SQL
17 9 (1.43%) PostgreSQL
Development Applications
1 48 (7.63%) SQL Server Management Studio (SSMS)
2 43 (6.84%) Git
3 42 (6.68%) Visual Studio
4 21 (3.34%) JIRA
5 20 (3.18%) Team Foundation Server
6 17 (2.70%) Postman
7 9 (1.43%) Jenkins
8 8 (1.27%) Selenium
9 7 (1.11%) Bitbucket
10 6 (0.95%) SoapUI
10 6 (0.95%) TeamCity
11 3 (0.48%) Visual Studio Team System
12 2 (0.32%) Eclipse
12 2 (0.32%) Maven
12 2 (0.32%) Octopus Deploy
12 2 (0.32%) Oracle APEX
13 1 (0.16%) ESLint
13 1 (0.16%) git-flow
13 1 (0.16%) Subversion
13 1 (0.16%) Visual Studio Code
General
1 189 (30.05%) Finance
2 134 (21.30%) Social Skills
3 86 (13.67%) Analytical Skills
4 57 (9.06%) Retail
5 54 (8.59%) Banking
6 37 (5.88%) Law
7 31 (4.93%) Public Sector
8 30 (4.77%) Inclusion and Diversity
9 27 (4.29%) Marketing
10 19 (3.02%) Documentation Skills
11 18 (2.86%) Legal
12 10 (1.59%) Manufacturing
13 9 (1.43%) Corporate Banking
13 9 (1.43%) Telecoms
14 7 (1.11%) Back Office
14 7 (1.11%) Billing
14 7 (1.11%) Social Housing
15 6 (0.95%) Financial Institution
16 5 (0.79%) Private Banking
17 4 (0.64%) Retail Banking
Job Titles
1 266 (42.29%) Developer
2 108 (17.17%) Data Engineer
3 102 (16.22%) Analyst
4 95 (15.10%) Senior
5 82 (13.04%) Business Intelligence Developer
6 58 (9.22%) SQL Developer
7 42 (6.68%) Lead
8 41 (6.52%) Power BI Developer
9 39 (6.20%) DBA
10 36 (5.72%) Senior Analyst
11 31 (4.93%) Data Analyst
11 31 (4.93%) Senior Developer
12 30 (4.77%) SQL DBA
13 24 (3.82%) Support Analyst
14 22 (3.50%) .NET Developer
15 21 (3.34%) Business Intelligence Analyst
16 20 (3.18%) Administrator
16 20 (3.18%) Azure Developer
17 19 (3.02%) Consultant
17 19 (3.02%) Full Stack Developer
Libraries, Frameworks & Software Standards
1 117 (18.60%) .NET
2 41 (6.52%) JSON
3 40 (6.36%) HTML
4 39 (6.20%) Web Services
5 37 (5.88%) ASP.NET
6 36 (5.72%) XML
7 35 (5.56%) REST
8 33 (5.25%) CSS
9 29 (4.61%) AngularJS
10 27 (4.29%) .NET Framework
10 27 (4.29%) SOAP
11 22 (3.50%) jQuery
12 19 (3.02%) Node.js
13 17 (2.70%) Entity Framework
13 17 (2.70%) MDX
13 17 (2.70%) Middleware
13 17 (2.70%) RESTful
14 16 (2.54%) HTML5
15 15 (2.38%) .NET Core
15 15 (2.38%) PySpark
Miscellaneous
1 43 (6.84%) Data Structures
2 24 (3.82%) Product Ownership
3 23 (3.66%) Management Information System
4 21 (3.34%) Low-Code
5 20 (3.18%) Clustering
5 20 (3.18%) Self-Motivation
6 19 (3.02%) Replication
7 18 (2.86%) Legacy Systems
8 8 (1.27%) Data Centre
8 8 (1.27%) Enterprise Software
8 8 (1.27%) IoT
9 7 (1.11%) Cloud Native
9 7 (1.11%) Onboarding
10 6 (0.95%) Fixed Income
10 6 (0.95%) Hedge funds
10 6 (0.95%) Housing Association
10 6 (0.95%) Public Cloud
10 6 (0.95%) Reinsurance
11 5 (0.79%) Greenfield Project
12 4 (0.64%) Pricing Data
Operating Systems
1 57 (9.06%) Windows
2 21 (3.34%) Windows Server
3 8 (1.27%) Linux
4 2 (0.32%) Unix
5 1 (0.16%) VMS
5 1 (0.16%) Windows Server 2016
5 1 (0.16%) Windows Server 2019
Processes & Methodologies
1 348 (55.33%) Business Intelligence
2 254 (40.38%) ETL
3 169 (26.87%) Agile
4 141 (22.42%) Analytics
5 122 (19.40%) Data Modelling
6 117 (18.60%) DevOps
7 109 (17.33%) Visualisation
8 89 (14.15%) Problem-Solving
9 82 (13.04%) Data Analysis
9 82 (13.04%) Migration
10 80 (12.72%) CRM
11 68 (10.81%) Data Integration
12 56 (8.90%) Data Science
12 56 (8.90%) Decision-Making
13 55 (8.74%) Data Engineering
14 54 (8.59%) Data Pipeline
14 54 (8.59%) Scrum
15 46 (7.31%) CI/CD
16 45 (7.15%) Customer Service
17 44 (7.00%) Mentoring
Programming Languages
1 521 (82.83%) SQL
2 262 (41.65%) T-SQL
3 151 (24.01%) C#
4 80 (12.72%) JavaScript
4 80 (12.72%) Python
5 60 (9.54%) Data Analysis Expressions
5 60 (9.54%) PowerShell
6 29 (4.61%) PL/SQL
7 15 (2.38%) Java
8 14 (2.23%) R
8 14 (2.23%) VBA
9 9 (1.43%) TypeScript
10 8 (1.27%) VBScript
11 6 (0.95%) VB.NET
12 5 (0.79%) VB
12 5 (0.79%) XPath
13 4 (0.64%) XMLA
14 3 (0.48%) Bash
15 2 (0.32%) Perl
15 2 (0.32%) PHP
Qualifications
1 105 (16.69%) Degree
2 21 (3.34%) Microsoft Certification
3 18 (2.86%) Computer Science Degree
4 16 (2.54%) Master's Degree
5 15 (2.38%) Security Cleared
6 12 (1.91%) Azure Certification
7 9 (1.43%) SC Cleared
8 8 (1.27%) ITIL Foundation Certificate
9 6 (0.95%) MCSA
9 6 (0.95%) MCSE
10 5 (0.79%) PRINCE2 Practitioner
11 3 (0.48%) BPSS Clearance
11 3 (0.48%) DBS Check
12 2 (0.32%) DV Cleared
12 2 (0.32%) ISTQB
13 1 (0.16%) HNC
13 1 (0.16%) HND
13 1 (0.16%) ITIL Certification
13 1 (0.16%) MCITP
13 1 (0.16%) MCTS
Quality Assurance & Compliance
1 45 (7.15%) Data Quality
2 17 (2.70%) QA
3 13 (2.07%) SLA
4 10 (1.59%) ISO/IEC 27001
5 5 (0.79%) Accessibility
6 4 (0.64%) GDPR
7 3 (0.48%) PMO
8 1 (0.16%) HIPAA
8 1 (0.16%) HL7
8 1 (0.16%) PCI DSS
8 1 (0.16%) Sarbanes-Oxley
System Software
1 20 (3.18%) Active Directory
2 4 (0.64%) VMware Infrastructure
3 3 (0.48%) Docker
3 3 (0.48%) Hyper-V
4 2 (0.32%) Virtual Machines
4 2 (0.32%) VMware ESXi
Systems Management
1 13 (2.07%) Kubernetes
2 9 (1.43%) Microsoft Clustering
3 4 (0.64%) Failover Clustering
3 4 (0.64%) Foglight
3 4 (0.64%) Terraform
4 2 (0.32%) Nagios
4 2 (0.32%) Norton AntiVirus
4 2 (0.32%) Oracle RMAN
4 2 (0.32%) Progress Chef
4 2 (0.32%) Puppet
5 1 (0.16%) Ansible
5 1 (0.16%) Single Sign-On
Vendors
1 285 (45.31%) Microsoft
2 60 (9.54%) Oracle
3 43 (6.84%) Databricks
4 21 (3.34%) Teradata
5 16 (2.54%) SAP
6 13 (2.07%) TIBCO
7 11 (1.75%) Alteryx
7 11 (1.75%) ServiceNow
8 9 (1.43%) Intapp
9 7 (1.11%) Google
10 6 (0.95%) Aderant
10 6 (0.95%) Charles River
10 6 (0.95%) Computacenter
10 6 (0.95%) NEC
10 6 (0.95%) VMware
11 5 (0.79%) Hyperion
11 5 (0.79%) Xero
12 4 (0.64%) Dell
12 4 (0.64%) Software AG
12 4 (0.64%) webMethods