Event-Driven
UK
The table below provides summary statistics for permanent job vacancies requiring Event-Driven skills. It includes a benchmarking guide to the annual salaries offered in vacancies that cited Event-Driven over the 6 months leading up to 30 April 2025, comparing them to the same period in the previous two years.
| 6 months to 30 Apr 2025 |
Same period 2024 | Same period 2023 | |
|---|---|---|---|
| Rank | 353 | 553 | 399 |
| Rank change year-on-year | +200 | -154 | -145 |
| Permanent jobs citing Event-Driven | 392 | 359 | 855 |
| As % of all permanent jobs advertised in the UK | 0.75% | 0.37% | 0.82% |
| As % of the Processes & Methodologies category | 0.81% | 0.42% | 0.86% |
| Number of salaries quoted | 311 | 286 | 525 |
| 10th Percentile | £52,500 | £53,750 | £56,088 |
| 25th Percentile | £60,000 | £62,500 | £67,500 |
| Median annual salary (50th Percentile) | £80,000 | £77,250 | £85,000 |
| Median % change year-on-year | +3.56% | -9.12% | +9.68% |
| 75th Percentile | £95,000 | £100,064 | £107,500 |
| 90th Percentile | £117,500 | £115,000 | £135,000 |
| UK excluding London median annual salary | £78,810 | £75,000 | £80,000 |
| % change year-on-year | +5.08% | -6.25% | +23.08% |
All Process and Methodology Skills
UK
Event-Driven falls under the Processes and Methodologies category. For comparison with the information above, the following table provides summary statistics for all permanent job vacancies requiring process or methodology skills.
| Permanent vacancies with a requirement for process or methodology skills | 48,641 | 84,574 | 99,457 |
| As % of all permanent jobs advertised in the UK | 93.26% | 86.00% | 95.63% |
| Number of salaries quoted | 26,531 | 59,798 | 58,397 |
| 10th Percentile | £30,580 | £29,000 | £34,000 |
| 25th Percentile | £42,500 | £40,000 | £45,000 |
| Median annual salary (50th Percentile) | £57,500 | £55,000 | £61,500 |
| Median % change year-on-year | +4.55% | -10.57% | +2.50% |
| 75th Percentile | £76,250 | £72,500 | £82,500 |
| 90th Percentile | £98,750 | £92,500 | £100,000 |
| UK excluding London median annual salary | £52,500 | £50,000 | £55,000 |
| % change year-on-year | +5.00% | -9.09% | +4.76% |
Event-Driven
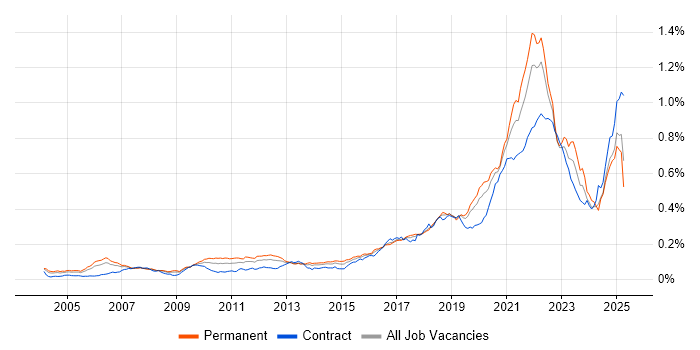
Job Vacancy Trend
Job postings citing Event-Driven as a proportion of all IT jobs advertised.

Event-Driven
Salary Trend
3-month moving average salary quoted in jobs citing Event-Driven.
Event-Driven
Salary Histogram
Salary distribution for jobs citing Event-Driven over the 6 months to 30 April 2025.
Event-Driven
Top 16 Job Locations
The table below looks at the demand and provides a guide to the median salaries quoted in IT jobs citing Event-Driven within the UK over the 6 months to 30 April 2025. The 'Rank Change' column provides an indication of the change in demand within each location based on the same 6 month period last year.
| Location | Rank Change on Same Period Last Year |
Matching Permanent IT Job Ads |
Median Salary Past 6 Months |
Median Salary % Change on Same Period Last Year |
Live Jobs |
|---|---|---|---|---|---|
| England | +195 | 364 | £82,500 | +3.13% | 380 |
| UK excluding London | +204 | 236 | £78,810 | +5.08% | 230 |
| Work from Home | +202 | 226 | £75,000 | -6.25% | 254 |
| London | +138 | 150 | £90,000 | -1.37% | 215 |
| South East | +154 | 70 | £82,500 | -8.33% | 73 |
| North of England | +70 | 69 | £78,810 | +5.08% | 93 |
| North West | +29 | 50 | £78,155 | +7.80% | 66 |
| South West | +121 | 36 | £78,810 | +8.70% | 16 |
| East of England | +84 | 28 | £85,000 | +7.94% | 9 |
| Scotland | +130 | 19 | £64,000 | -31.02% | 13 |
| Yorkshire | +67 | 17 | £97,500 | +5.09% | 21 |
| Midlands | +15 | 10 | £75,000 | +7.14% | 26 |
| West Midlands | +12 | 6 | £75,000 | +7.14% | 13 |
| East Midlands | +42 | 4 | £70,000 | +1.82% | 10 |
| Wales | +38 | 4 | £50,000 | +17.65% | 3 |
| North East | +45 | 2 | £64,908 | +47.10% | 6 |
Event-Driven
Co-occurring Skills and Capabilities by Category
The follow tables expand on the table above by listing co-occurrences grouped by category. The same employment type, locality and period is covered with up to 20 co-occurrences shown in each of the following categories:
|
|
||||||||||||||||||||||||||||||||||||||||||||||||||||||||||||||||||||||||||||||||||||||||||||||||||||||||||||||||||||||||||||||
|
|
||||||||||||||||||||||||||||||||||||||||||||||||||||||||||||||||||||||||||||||||||||||||||||||||||||||||||||||||||||||||||||||
|
|
||||||||||||||||||||||||||||||||||||||||||||||||||||||||||||||||||||||||||||||||||||||||||||||||||||||||||||||||||||||||||||||
|
|
||||||||||||||||||||||||||||||||||||||||||||||||||||||||||||||||||||||||||||||||||||||||||||||||||||||||||||||||||||||||||||||
|
|
||||||||||||||||||||||||||||||||||||||||||||||||||||||||||||||||||||||||||||||||||||||||||||||||||||||||||||||||||||||||||||||
|
|
||||||||||||||||||||||||||||||||||||||||||||||||||||||||||||||||||||||||||||||||||||||||||||||||||||||||||||||||||||||||||||||
|
|
||||||||||||||||||||||||||||||||||||||||||||||||||||||||||||||||||||||||||||||||||||||||||||||||||||||||||||||||||||||||||||||
|
|
||||||||||||||||||||||||||||||||||||||||||||||||||||||||||||||||||||||||||||||||||||||||||||||||||||||||||||||||||||||||||||||
|
|
||||||||||||||||||||||||||||||||||||||||||||||||||||||||||||||||||||||||||||||||||||||||||||||||||||||||||||||||||||||||||||||
|
|||||||||||||||||||||||||||||||||||||||||||||||||||||||||||||||||||||||||||||||||||||||||||||||||||||||||||||||||||||||||||||||
