Order to Cash Jobs

Order to Cash (O2C)
UK

The table below provides summary statistics for permanent job vacancies requiring Order to Cash skills. It includes a benchmarking guide to the annual salaries offered in vacancies that cited Order to Cash over the 6 months leading up to 30 May 2025, comparing them to the same period in the previous two years.

6 months to
30 May 2025
Same period 2024 Same period 2023
Rank 655 814 837
Rank change year-on-year +159 +23 +258
Permanent jobs citing Order to Cash 54 98 125
As % of all permanent jobs advertised in the UK 0.097% 0.095% 0.13%
As % of the Processes & Methodologies category 0.10% 0.11% 0.13%
Number of salaries quoted 40 49 68
10th Percentile £45,000 £47,500 £55,625
25th Percentile £50,625 £48,000 £60,000
Median annual salary (50th Percentile) £63,500 £65,000 £65,000
Median % change year-on-year -2.31% - +23.81%
75th Percentile £80,625 £73,750 £70,000
90th Percentile £95,500 £105,000 £79,875
UK excluding London median annual salary £57,500 £55,000 £65,000
% change year-on-year +4.55% -15.38% +36.84%

All Process and Methodology Skills
UK

Order to Cash falls under the Processes and Methodologies category. For comparison with the information above, the following table provides summary statistics for all permanent job vacancies requiring process or methodology skills.

Permanent vacancies with a requirement for process or methodology skills 51,902 86,889 92,846
As % of all permanent jobs advertised in the UK 93.67% 84.13% 95.56%
Number of salaries quoted 25,611 60,763 54,796
10th Percentile £28,822 £29,250 £34,000
25th Percentile £41,250 £40,000 £45,000
Median annual salary (50th Percentile) £57,443 £55,000 £60,899
Median % change year-on-year +4.44% -9.69% +1.50%
75th Percentile £75,000 £72,500 £81,250
90th Percentile £97,500 £92,500 £100,000
UK excluding London median annual salary £51,574 £50,000 £55,000
% change year-on-year +3.15% -9.09% +4.76%

Order to Cash
Job Vacancy Trend

Job postings citing Order to Cash as a proportion of all IT jobs advertised.
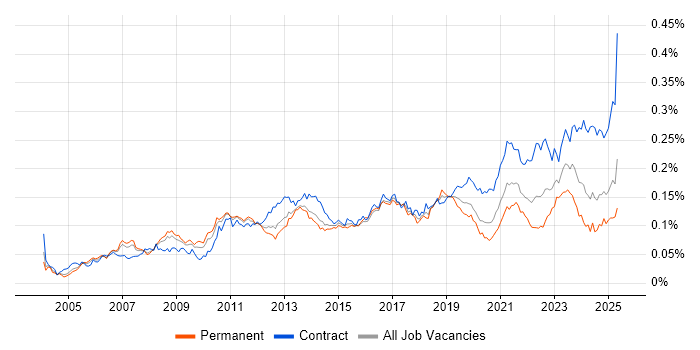
Job vacancy trend for Order to Cash in the UK

Order to Cash
Salary Trend

3-month moving average salary quoted in jobs citing Order to Cash.

Salary trend for Order to Cash in the UK

Order to Cash
Salary Histogram

Salary distribution for jobs citing Order to Cash over the 6 months to 30 May 2025.

Salary histogram for Order to Cash in the UK

Order to Cash
Top 9 Job Locations

The table below looks at the demand and provides a guide to the median salaries quoted in IT jobs citing Order to Cash within the UK over the 6 months to 30 May 2025. The 'Rank Change' column provides an indication of the change in demand within each location based on the same 6 month period last year.

Location Rank Change
on Same Period
Last Year
Matching
Permanent
IT Job Ads
Median Salary
Past 6 Months
Median Salary
% Change
on Same Period
Last Year
Live
Jobs
England +127 53 £62,500 -5.66% 201
UK excluding London +157 26 £57,500 +4.55% 190
London +111 19 £75,000 -11.76% 34
Work from Home +102 12 £70,000 -9.68% 104
Midlands +85 11 £45,000 -10.00% 41
South East +56 10 £65,000 -3.70% 59
West Midlands +55 8 £45,000 -10.00% 20
South West - 5 £60,000 - 19
East Midlands - 3 - - 19

Order to Cash
Co-occurring Skills and Capabilities by Category

The follow tables expand on the table above by listing co-occurrences grouped by category. The same employment type, locality and period is covered with up to 20 co-occurrences shown in each of the following categories:

Application Platforms
1 1 (1.85%) Oracle Workflow
Applications
1 5 (9.26%) Microsoft Excel
2 3 (5.56%) Maya
2 3 (5.56%) Microsoft Office
2 3 (5.56%) Microsoft PowerPoint
Business Applications
1 21 (38.89%) SAP S/4HANA
2 14 (25.93%) NetSuite
3 6 (11.11%) Dynamics AX
3 6 (11.11%) SAP FI
4 5 (9.26%) SAP CO
4 5 (9.26%) SAP FI/CO
4 5 (9.26%) SAP IBP
5 4 (7.41%) Oracle Procure-to-Pay
5 4 (7.41%) SAP FSCM
5 4 (7.41%) SAP SCM
5 4 (7.41%) SAP SD
6 3 (5.56%) Dynamics CRM
6 3 (5.56%) Oracle Assets
6 3 (5.56%) Oracle ERP
6 3 (5.56%) Oracle Financials
6 3 (5.56%) Oracle General Ledger
6 3 (5.56%) Oracle Payables
6 3 (5.56%) Oracle Receivables
6 3 (5.56%) SAP IS-U
7 2 (3.70%) Oracle Cash Management
Cloud Services
1 13 (24.07%) Dynamics 365
2 3 (5.56%) Azure
2 3 (5.56%) Azure DevOps
2 3 (5.56%) OCI
3 2 (3.70%) SaaS
4 1 (1.85%) AWS
4 1 (1.85%) SAP Commerce Cloud
Database & Business Intelligence
1 3 (5.56%) SAP BW
2 1 (1.85%) Oracle Reports
Development Applications
1 3 (5.56%) JIRA
2 1 (1.85%) Jenkins
2 1 (1.85%) Oracle Forms
General
1 42 (77.78%) Finance
2 25 (46.30%) Social Skills
3 21 (38.89%) Analytical Skills
4 10 (18.52%) Law
5 8 (14.81%) Manufacturing
6 4 (7.41%) Presentation Skills
6 4 (7.41%) Retail
7 3 (5.56%) Documentation Skills
7 3 (5.56%) Games
7 3 (5.56%) German Language
7 3 (5.56%) Organisational Skills
8 2 (3.70%) Billing
8 2 (3.70%) Inclusion and Diversity
9 1 (1.85%) Back Office
9 1 (1.85%) Banking
9 1 (1.85%) Dutch Language
9 1 (1.85%) French Language
Job Titles
1 28 (51.85%) Consultant
2 16 (29.63%) Analyst
3 14 (25.93%) Financial Analyst
4 13 (24.07%) Business Analyst
4 13 (24.07%) SAP Consultant
4 13 (24.07%) Systems Analyst
5 12 (22.22%) CRM Analyst
5 12 (22.22%) CRM Business Analyst
5 12 (22.22%) CRM Systems Analyst
5 12 (22.22%) Finance Business Analyst
5 12 (22.22%) Finance Systems Analyst
5 12 (22.22%) Financial Business Analyst
6 11 (20.37%) Dynamics 365 Consultant
6 11 (20.37%) Functional Consultant
7 9 (16.67%) Senior
8 8 (14.81%) Senior Consultant
8 8 (14.81%) Senior SAP Consultant
9 5 (9.26%) SAP Financial Consultant
9 5 (9.26%) Senior SAP Financial Consultant
10 3 (5.56%) Senior IT Consultant
Libraries, Frameworks & Software Standards
1 3 (5.56%) EDI
1 3 (5.56%) SAP Fiori
2 2 (3.70%) Middleware
2 2 (3.70%) SAP XI
3 1 (1.85%) EDIFACT
3 1 (1.85%) Node.js
3 1 (1.85%) Oracle Fusion
Miscellaneous
1 12 (22.22%) Legacy Systems
1 12 (22.22%) Taxonomies
2 5 (9.26%) Management Information System
3 4 (7.41%) Enterprise Software
4 2 (3.70%) Onboarding
5 1 (1.85%) Data Protection Act
5 1 (1.85%) Foreign Exchange (FX)
5 1 (1.85%) Greenfield Project
5 1 (1.85%) IoT
5 1 (1.85%) Product Ownership
5 1 (1.85%) Virtual Team
Operating Systems
1 3 (5.56%) Windows
Processes & Methodologies
1 37 (68.52%) Procure-to-Pay
2 24 (44.44%) ERP
3 22 (40.74%) Record to Report
4 21 (38.89%) Requirements Gathering
5 19 (35.19%) Problem-Solving
6 17 (31.48%) Agile
6 17 (31.48%) Process Improvement
6 17 (31.48%) Project Management
7 16 (29.63%) Business Transformation
7 16 (29.63%) CRM
8 15 (27.78%) Decision-Making
8 15 (27.78%) Logistics
8 15 (27.78%) Roadmaps
8 15 (27.78%) Thought Leadership
9 14 (25.93%) Stakeholder Management
10 12 (22.22%) Analytical Thinking
10 12 (22.22%) Backlog Management
10 12 (22.22%) Change Management
10 12 (22.22%) Product Roadmap
10 12 (22.22%) Scenario Testing
Programming Languages
1 2 (3.70%) SQL
1 2 (3.70%) X++
2 1 (1.85%) ABAP
2 1 (1.85%) JavaScript
2 1 (1.85%) PL/SQL
2 1 (1.85%) TypeScript
Qualifications
1 9 (16.67%) Degree
2 7 (12.96%) Microsoft Certification
3 5 (9.26%) MCP
4 4 (7.41%) Security Cleared
5 2 (3.70%) ACCA
5 2 (3.70%) CIMA
5 2 (3.70%) PMI Certification
5 2 (3.70%) PMP
6 1 (1.85%) Master's Degree
6 1 (1.85%) SAP Certification
6 1 (1.85%) SC Cleared
Quality Assurance & Compliance
1 6 (11.11%) QA
2 1 (1.85%) GRC
Systems Management
1 1 (1.85%) Grafana
1 1 (1.85%) Prometheus
Vendors
1 27 (50.00%) SAP
2 17 (31.48%) Microsoft
3 13 (24.07%) Salesforce
4 5 (9.26%) Oracle
5 3 (5.56%) Intel
6 2 (3.70%) ServiceNow
7 1 (1.85%) Ariba
7 1 (1.85%) Atlassian