Logistics
UK

The following table provides summary statistics for permanent job vacancies with a requirement for Logistics skills. Included is a benchmarking guide to the salaries offered in vacancies that have cited Logistics over the 6 months to 28 November 2023 with a comparison to the same period in the previous 2 years.

6 months to
28 Nov 2023
Same period 2022 Same period 2021
Rank 299 280 290
Rank change year-on-year -19 +10 +30
Permanent jobs citing Logistics 563 1,649 1,620
As % of all permanent jobs advertised in the UK 1.04% 1.31% 1.26%
As % of the Processes & Methodologies category 1.10% 1.37% 1.32%
Number of salaries quoted 413 814 844
10th Percentile £34,000 £29,500 £30,000
25th Percentile £43,500 £40,000 £38,750
Median annual salary (50th Percentile) £60,000 £55,000 £52,500
Median % change year-on-year +9.09% +4.76% -
75th Percentile £86,250 £72,500 £67,500
90th Percentile £95,000 £87,500 £81,250
UK excluding London median annual salary £55,000 £52,500 £51,000
% change year-on-year +4.76% +2.94% +7.37%

All Process and Methodology Skills
UK

Logistics is in the Processes and Methodologies category. The following table is for comparison with the above and provides summary statistics for all permanent job vacancies with a requirement for process or methodology skills.

Permanent vacancies with a requirement for process or methodology skills 51,121 120,104 122,523
As % of all permanent jobs advertised in the UK 94.09% 95.72% 95.43%
Number of salaries quoted 36,956 73,203 81,032
10th Percentile £32,500 £34,313 £32,500
25th Percentile £43,750 £45,000 £42,500
Median annual salary (50th Percentile) £60,000 £60,000 £59,000
Median % change year-on-year - +1.69% +7.27%
75th Percentile £80,000 £81,250 £77,500
90th Percentile £98,750 £100,000 £95,000
UK excluding London median annual salary £52,500 £53,000 £50,000
% change year-on-year -0.94% +6.00% +4.17%

Logistics
Job Vacancy Trend

Job postings citing Logistics as a proportion of all IT jobs advertised.
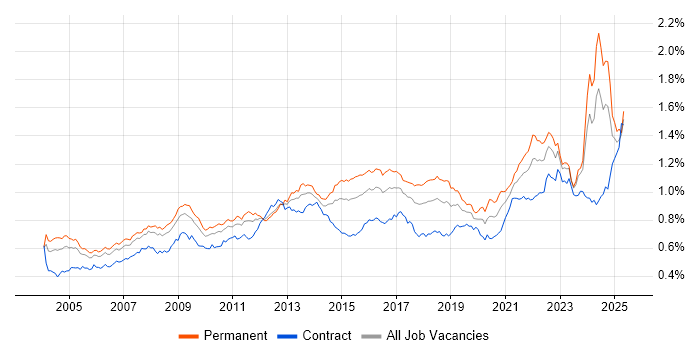
Job vacancy trend for Logistics in the UK

Logistics
Salary Trend

3-month moving average salary quoted in jobs citing Logistics.

Salary trend for Logistics in the UK

Logistics
Salary Histogram

Salary distribution for jobs citing Logistics over the 6 months to 28 November 2023.

Salary histogram for Logistics in the UK

Logistics
Top 17 Job Locations

The table below looks at the demand and provides a guide to the median salaries quoted in IT jobs citing Logistics within the UK over the 6 months to 28 November 2023. The 'Rank Change' column provides an indication of the change in demand within each location based on the same 6 month period last year.

Location Rank Change
on Same Period
Last Year
Matching
Permanent
IT Job Ads
Median Salary
Past 6 Months
Median Salary
% Change
on Same Period
Last Year
Live
Jobs
England -16 507 £60,000 +9.09% 728
UK excluding London -70 330 £55,000 +4.76% 524
Work from Home -30 196 £65,000 +15.04% 225
London +83 188 £70,000 +7.69% 233
Midlands +7 109 £60,000 +14.29% 139
South East +9 63 £58,500 +17.00% 136
East Midlands -15 62 £60,000 +14.29% 58
North of England -55 50 £55,000 - 122
East of England +64 46 £45,000 -2.70% 59
West Midlands +40 46 £53,750 +2.38% 81
Scotland -2 31 £55,000 +12.24% 22
North West -17 26 £60,000 -7.69% 85
South West -20 23 £55,000 +22.22% 52
Yorkshire +33 22 £50,000 -4.76% 31
Wales +11 6 £30,000 -65.22% 8
Northern Ireland +26 4 £29,993 -29.43% 6
North East +12 2 £50,000 +17.65% 8

Logistics
Co-occurring Skills and Capabilities by Category

The follow tables expand on the table above by listing co-occurrences grouped by category. The same employment type, locality and period is covered with up to 20 co-occurrences shown in each of the following categories:

Application Platforms
1 12 (2.13%) SharePoint
2 11 (1.95%) NServiceBus
3 4 (0.71%) Confluence
4 3 (0.53%) MS Exchange
5 2 (0.36%) Apache
5 2 (0.36%) Apache Airflow
5 2 (0.36%) SAS
6 1 (0.18%) Apache Pulsar
Applications
1 58 (10.30%) Microsoft Excel
2 30 (5.33%) Microsoft Office
3 17 (3.02%) Microsoft PowerPoint
4 11 (1.95%) Microsoft Project
5 8 (1.42%) InDesign
5 8 (1.42%) Photoshop
6 7 (1.24%) AutoCAD
6 7 (1.24%) MS Visio
7 1 (0.18%) Adobe XD
7 1 (0.18%) Sketch
7 1 (0.18%) Spreadsheet
Business Applications
1 68 (12.08%) SAP S/4HANA
2 43 (7.64%) SAP SCM
3 33 (5.86%) SAP ERP
4 12 (2.13%) Payment Gateway
4 12 (2.13%) SAP EWM
4 12 (2.13%) SAP MM
5 11 (1.95%) SAP SD
6 9 (1.60%) SAP WM
7 6 (1.07%) NetSuite
7 6 (1.07%) SAP FI
7 6 (1.07%) SAP PM
7 6 (1.07%) SAP PP
8 5 (0.89%) SAP CO
8 5 (0.89%) SAP FI/CO
9 4 (0.71%) SAP LE
9 4 (0.71%) SAP Oil and Gas
10 3 (0.53%) SAP IBP
10 3 (0.53%) SAP QM
11 1 (0.18%) Epicor Tropos
11 1 (0.18%) SAP MDG
Cloud Services
1 93 (16.52%) Azure
2 58 (10.30%) Power Platform
3 53 (9.41%) AWS
4 23 (4.09%) Microsoft 365
5 18 (3.20%) PowerApps
6 17 (3.02%) SaaS
7 15 (2.66%) Entra ID
8 14 (2.49%) Azure Logic Apps
9 13 (2.31%) GCP
9 13 (2.31%) Serverless
10 11 (1.95%) Azure Cosmos DB
11 10 (1.78%) Cloud Computing
12 8 (1.42%) Dynamics 365
12 8 (1.42%) Power Automate
13 7 (1.24%) Azure DevOps
13 7 (1.24%) GitHub
13 7 (1.24%) WhatsApp
14 6 (1.07%) PaaS
14 6 (1.07%) SuccessFactors
15 5 (0.89%) Azure Functions
Communications & Networking
1 19 (3.37%) Wireless
2 18 (3.20%) LAN
2 18 (3.20%) WAN
3 17 (3.02%) Firewall
4 16 (2.84%) DNS
5 15 (2.66%) DHCP
6 12 (2.13%) VPN
7 8 (1.42%) TCP/IP
8 7 (1.24%) Bluetooth
8 7 (1.24%) Internet
9 6 (1.07%) SAN
10 5 (0.89%) VLAN
11 4 (0.71%) Network Security
11 4 (0.71%) VoIP
11 4 (0.71%) WLAN
12 3 (0.53%) BGP
12 3 (0.53%) Intranet
12 3 (0.53%) MPLS
12 3 (0.53%) OSPF
12 3 (0.53%) Wi-Fi
Database & Business Intelligence
1 48 (8.53%) Power BI
2 44 (7.82%) SQL Server
3 15 (2.66%) SQL Server Reporting Services
3 15 (2.66%) Tableau
4 14 (2.49%) NoSQL
5 11 (1.95%) Event Store
5 11 (1.95%) RavenDB
6 7 (1.24%) Relational Database
7 5 (0.89%) Data Mining
7 5 (0.89%) MS Access
7 5 (0.89%) SQL Server Integration Services
8 4 (0.71%) Apache Cassandra
8 4 (0.71%) BigQuery
8 4 (0.71%) Data Warehouse
8 4 (0.71%) Elasticsearch
8 4 (0.71%) GIS
8 4 (0.71%) PostgreSQL
8 4 (0.71%) Power Query
9 3 (0.53%) Azure SQL Database
9 3 (0.53%) Big Data
Development Applications
1 25 (4.44%) Visual Studio
2 17 (3.02%) Git
3 11 (1.95%) JIRA
3 11 (1.95%) Mercurial
3 11 (1.95%) SpecFlow
4 3 (0.53%) Subversion
5 2 (0.36%) Postman
5 2 (0.36%) REST Assured
5 2 (0.36%) Selenium
6 1 (0.18%) Appium
6 1 (0.18%) Cucumber
6 1 (0.18%) Eclipse
6 1 (0.18%) JMeter
6 1 (0.18%) LabVIEW
6 1 (0.18%) Locust
6 1 (0.18%) SoapUI
6 1 (0.18%) TestRail
6 1 (0.18%) Visual Studio Team System
General
1 149 (26.47%) Social Skills
2 127 (22.56%) Finance
3 110 (19.54%) Retail
4 98 (17.41%) Manufacturing
5 81 (14.39%) Analytical Skills
6 56 (9.95%) Automotive
7 41 (7.28%) Aerospace
8 39 (6.93%) Public Sector
9 32 (5.68%) Aviation
9 32 (5.68%) Marketing
10 24 (4.26%) Law
11 22 (3.91%) Banking
12 21 (3.73%) Inclusion and Diversity
13 20 (3.55%) Telecoms
14 18 (3.20%) Publishing
15 17 (3.02%) Presentation Skills
16 16 (2.84%) Military
17 13 (2.31%) Organisational Skills
18 10 (1.78%) Legal
19 9 (1.60%) Advertising
Job Titles
1 95 (16.87%) Analyst
2 74 (13.14%) Senior
3 73 (12.97%) Consultant
4 69 (12.26%) Developer
5 54 (9.59%) SAP Consultant
6 42 (7.46%) Lead
7 39 (6.93%) Business Manager
8 34 (6.04%) Architect
9 31 (5.51%) Development Manager
10 29 (5.15%) Business Development Manager
11 28 (4.97%) SAP S/4HANA Consultant
12 27 (4.80%) Business Analyst
13 23 (4.09%) Project Manager
14 22 (3.91%) .NET Developer
14 22 (3.91%) Solutions Architect
15 21 (3.73%) Senior Analyst
16 20 (3.55%) Logistics Consultant
16 20 (3.55%) Senior Manager
17 19 (3.37%) SAP Logistics Consultant
18 18 (3.20%) C# Developer
Libraries, Frameworks & Software Standards
1 51 (9.06%) .NET
2 27 (4.80%) React
3 26 (4.62%) EDI
4 17 (3.02%) Next.js
5 16 (2.84%) Node.js
6 15 (2.66%) ASP.NET Web API
6 15 (2.66%) HTML
7 12 (2.13%) .NET Framework
7 12 (2.13%) CSS
7 12 (2.13%) XML
8 11 (1.95%) Apache Cordova
9 9 (1.60%) JSON
10 8 (1.42%) SAP Fiori
10 8 (1.42%) SAPUI5
11 7 (1.24%) Entity Framework
11 7 (1.24%) REST
11 7 (1.24%) Vue
12 6 (1.07%) Kafka
13 5 (0.89%) RESTful
13 5 (0.89%) WCF
Miscellaneous
1 48 (8.53%) Onboarding
2 36 (6.39%) Low-Code
3 35 (6.22%) Greenfield Project
4 25 (4.44%) FMCG
5 22 (3.91%) Management Information System
6 18 (3.20%) Virtual Team
7 15 (2.66%) Life Science
8 13 (2.31%) Mobile App
9 9 (1.60%) Enterprise Software
9 9 (1.60%) IoT
9 9 (1.60%) Self-Motivation
10 8 (1.42%) Hybrid Cloud
10 8 (1.42%) Marketing Technology
11 7 (1.24%) Data Structures
11 7 (1.24%) Smart Meter
12 6 (1.07%) Data Centre
12 6 (1.07%) Private Cloud
12 6 (1.07%) Security Operations Centre
13 5 (0.89%) Cloud Native
13 5 (0.89%) Cyber Threat
Operating Systems
1 39 (6.93%) Windows
2 15 (2.66%) Windows Server
3 12 (2.13%) Linux
4 11 (1.95%) Windows 10
5 6 (1.07%) Unix
6 3 (0.53%) Windows 7
6 3 (0.53%) Windows Server 2008
6 3 (0.53%) Windows Server 2019
7 2 (0.36%) Android
7 2 (0.36%) Apple iOS
7 2 (0.36%) CentOS
7 2 (0.36%) OpenBSD
8 1 (0.18%) Windows Server 2012
8 1 (0.18%) Windows Server 2016
Processes & Methodologies
1 105 (18.65%) Problem-Solving
2 98 (17.41%) Agile
3 76 (13.50%) ERP
4 69 (12.26%) Project Management
5 56 (9.95%) Analytics
6 54 (9.59%) Supply Chain Management
7 53 (9.41%) DevOps
8 49 (8.70%) Stakeholder Management
9 45 (7.99%) Business Intelligence
10 43 (7.64%) Process Improvement
11 42 (7.46%) Artificial Intelligence
11 42 (7.46%) Business Development
11 42 (7.46%) Roadmaps
12 38 (6.75%) Presales
12 38 (6.75%) Project Delivery
13 36 (6.39%) Continuous Improvement
14 35 (6.22%) Microservices
15 34 (6.04%) Service Delivery
16 33 (5.86%) Digital Transformation Programme
17 31 (5.51%) Software Engineering
Programming Languages
1 101 (17.94%) SQL
2 69 (12.26%) C#
3 36 (6.39%) JavaScript
4 31 (5.51%) Python
5 26 (4.62%) PowerShell
6 19 (3.37%) TypeScript
7 8 (1.42%) Bicep
8 7 (1.24%) Java
8 7 (1.24%) VBA
9 6 (1.07%) C++
10 4 (0.71%) R
10 4 (0.71%) Shell Script
10 4 (0.71%) VB.NET
11 3 (0.53%) Bash
11 3 (0.53%) Go
11 3 (0.53%) PL/SQL
11 3 (0.53%) T-SQL
12 2 (0.36%) C
12 2 (0.36%) Swift
13 1 (0.18%) RPG
Qualifications
1 97 (17.23%) Degree
2 36 (6.39%) Security Cleared
3 30 (5.33%) SC Cleared
4 19 (3.37%) Master's Degree
5 9 (1.60%) DV Cleared
6 8 (1.42%) BPSS Clearance
6 8 (1.42%) PMI Certification
7 7 (1.24%) Computer Science Degree
7 7 (1.24%) PMP
8 6 (1.07%) DBS Check
8 6 (1.07%) Microsoft Certification
9 4 (0.71%) Azure Certification
9 4 (0.71%) PRINCE2 Certification
9 4 (0.71%) SAP Certification
10 3 (0.53%) CCNP
10 3 (0.53%) Cisco Certification
10 3 (0.53%) ISTQB
11 2 (0.36%) CCNA
11 2 (0.36%) MCSE
11 2 (0.36%) Postgraduate
Quality Assurance & Compliance
1 20 (3.55%) GDPR
2 19 (3.37%) ISO/IEC 27001
3 15 (2.66%) QA
4 13 (2.31%) NIST
5 10 (1.78%) Def Stans
5 10 (1.78%) Sarbanes-Oxley
5 10 (1.78%) SLA
6 7 (1.24%) Cyber Essentials
7 6 (1.07%) NCSC
8 5 (0.89%) COBIT
8 5 (0.89%) PMO
9 4 (0.71%) ISA99
10 2 (0.36%) Accessibility
10 2 (0.36%) Data Quality
11 1 (0.18%) Actionable Recommendations
11 1 (0.18%) ISO 9001
11 1 (0.18%) NEBOSH
System Software
1 21 (3.73%) Active Directory
2 15 (2.66%) Docker
2 15 (2.66%) VMware Infrastructure
3 12 (2.13%) vSphere
4 6 (1.07%) Hyper-V
5 3 (0.53%) BitLocker
5 3 (0.53%) Virtual Machines
5 3 (0.53%) VMware Server
6 2 (0.36%) Firmware
6 2 (0.36%) Postfix
Systems Management
1 17 (3.02%) Terraform
2 15 (2.66%) Kubernetes
3 10 (1.78%) Microsoft Intune
4 8 (1.42%) Ansible
5 6 (1.07%) SCCM
6 2 (0.36%) Puppet
7 1 (0.18%) Jamf Pro
7 1 (0.18%) WSUS
Vendors
1 132 (23.45%) SAP
2 97 (17.23%) Microsoft
3 27 (4.80%) VMware
4 19 (3.37%) Cisco
5 18 (3.20%) Salesforce
6 15 (2.66%) Oracle
7 14 (2.49%) Xamarin
8 9 (1.60%) Adobe
9 8 (1.42%) Fortinet
9 8 (1.42%) Meraki
10 6 (1.07%) Dell
10 6 (1.07%) IBM
10 6 (1.07%) Workday
11 5 (0.89%) Citrix
11 5 (0.89%) HubSpot
11 5 (0.89%) Sophos
12 4 (0.71%) CheckPoint
12 4 (0.71%) Concur
12 4 (0.71%) Google
13 3 (0.53%) Ariba