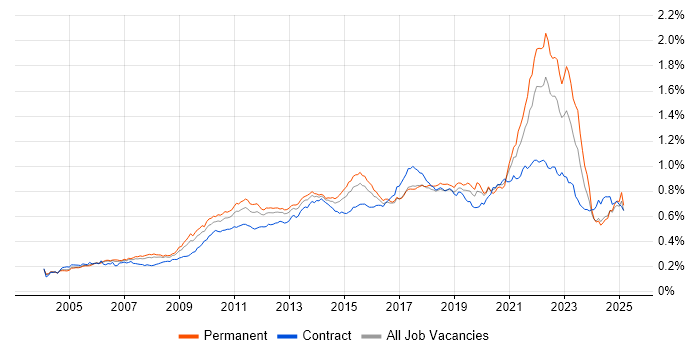
Virtual Team (including Distributed Team, Remote Team, Dispersed Team)
UK

The table below looks at the prevalence of the term Virtual Team in permanent job vacancies. Included is a benchmarking guide to the salaries offered in vacancies that have cited Virtual Team over the 6 months to 10 December 2023 with a comparison to the same period over the previous 2 years.

6 months to
10 Dec 2023
Same period 2022 Same period 2021
Rank 253 224 247
Rank change year-on-year -29 +23 +134
Permanent jobs citing Virtual Team 704 2,078 1,900
As % of all permanent jobs advertised in the UK 1.35% 1.70% 1.50%
As % of the Miscellaneous category 3.66% 3.96% 3.41%
Number of salaries quoted 387 729 1,013
10th Percentile £46,250 £44,500 £42,500
25th Percentile £56,250 £55,000 £50,000
Median annual salary (50th Percentile) £60,000 £70,000 £70,000
Median % change year-on-year -14.29% - +7.69%
75th Percentile £80,000 £90,000 £90,000
90th Percentile £97,290 £100,000 £105,000
UK excluding London median annual salary £60,000 £62,500 £65,000
% change year-on-year -4.00% -3.85% +23.81%

All Generic Skills
UK

Virtual Team is in the General and Transferable Skills category. The following table is for comparison with the above and provides summary statistics for all permanent job vacancies with a requirement for generic IT skills.

Permanent vacancies with a requirement for generic IT skills 19,243 52,473 55,657
As % of all permanent jobs advertised in the UK 36.81% 42.93% 43.80%
Number of salaries quoted 14,017 29,568 33,811
10th Percentile £32,756 £34,996 £33,750
25th Percentile £45,000 £46,250 £45,000
Median annual salary (50th Percentile) £62,500 £64,750 £60,000
Median % change year-on-year -3.47% +7.92% -
75th Percentile £83,750 £85,000 £82,500
90th Percentile £107,500 £105,000 £100,000
UK excluding London median annual salary £55,000 £55,000 £50,000
% change year-on-year - +10.00% -

Virtual Team
Job Vacancy Trend

Job postings citing Virtual Team as a proportion of all IT jobs advertised.

Job vacancy trend for Virtual Team in the UK

Virtual Team
Salary Trend

3-month moving average salary quoted in jobs citing Virtual Team.

Salary trend for Virtual Team in the UK

Virtual Team
Salary Histogram

Salary distribution for jobs citing Virtual Team over the 6 months to 10 December 2023.

Salary histogram for Virtual Team in the UK

Virtual Team
Top 17 Job Locations

The table below looks at the demand and provides a guide to the median salaries quoted in IT jobs citing Virtual Team within the UK over the 6 months to 10 December 2023. The 'Rank Change' column provides an indication of the change in demand within each location based on the same 6 month period last year.

Location Rank Change
on Same Period
Last Year
Matching
Permanent
IT Job Ads
Median Salary
Past 6 Months
Median Salary
% Change
on Same Period
Last Year
Live
Jobs
England -15 591 £60,000 -11.11% 258
UK excluding London -15 412 £60,000 -4.00% 127
Work from Home +12 304 £70,000 - 147
London -6 237 £75,000 - 149
North of England +50 106 £60,000 -4.00% 27
Midlands +114 72 £60,000 +14.29% 18
North West +85 59 £60,000 -7.69% 18
East of England +43 55 £60,000 -7.69% 9
Scotland -48 52 £60,000 -7.34% 10
South West +59 49 £60,000 -4.00% 13
West Midlands +123 47 £55,000 - 15
South East -59 47 £60,000 -7.69% 47
Yorkshire +10 40 £60,000 - 5
East Midlands +37 24 £60,000 +14.29% 3
Wales -22 23 £52,500 -24.80% 2
Northern Ireland +33 8 - - 2
North East +33 7 £60,000 -40.00% 4

Virtual Team
Co-occurring Skills and Capabilities by Category

The follow tables expand on the table above by listing co-occurrences grouped by category. The same employment type, locality and period is covered with up to 20 co-occurrences shown in each of the following categories:

Application Platforms
1 10 (1.42%) NServiceBus
2 7 (0.99%) Confluence
2 7 (0.99%) SharePoint
3 6 (0.85%) Adobe Experience Manager
3 6 (0.85%) CMS
3 6 (0.85%) MS Exchange
4 5 (0.71%) nginx
5 3 (0.43%) SAS
6 2 (0.28%) Apache
6 2 (0.28%) IIS
7 1 (0.14%) Apache Airflow
7 1 (0.14%) Apache Spark
7 1 (0.14%) Drupal
7 1 (0.14%) Oracle Workflow
7 1 (0.14%) TPMS
Applications
1 11 (1.56%) Microsoft Excel
2 8 (1.14%) Microsoft PowerPoint
3 6 (0.85%) Microsoft Office
4 3 (0.43%) MS Visio
5 2 (0.28%) Campfire
6 1 (0.14%) AutoCAD
6 1 (0.14%) Microsoft Project
6 1 (0.14%) Revit
6 1 (0.14%) SketchUp
6 1 (0.14%) Spreadsheet
6 1 (0.14%) Trello
Business Applications
1 49 (6.96%) Endur
2 13 (1.85%) SAP S/4HANA
3 8 (1.14%) SAP SCM
4 6 (0.85%) OpenLink RightAngle
5 5 (0.71%) Infor M3
5 5 (0.71%) Sage X3
5 5 (0.71%) SAP CRM
5 5 (0.71%) SAP CX
5 5 (0.71%) SAP GTS
5 5 (0.71%) SAP SD
5 5 (0.71%) SAP WM
6 4 (0.57%) SAP MM
6 4 (0.57%) SAP PM
7 3 (0.43%) ReMetrica
8 2 (0.28%) Dynamics CRM
8 2 (0.28%) Oracle Assets
8 2 (0.28%) Workday HCM
9 1 (0.14%) NetSuite
9 1 (0.14%) Oracle EBS R12
9 1 (0.14%) SAP ERP
Cloud Services
1 178 (25.28%) Azure
2 72 (10.23%) SaaS
3 64 (9.09%) AWS
4 60 (8.52%) PaaS
5 53 (7.53%) IaaS
6 42 (5.97%) GCP
7 41 (5.82%) Azure DevOps
8 26 (3.69%) Microsoft 365
9 18 (2.56%) GitHub
10 16 (2.27%) Datadog
11 15 (2.13%) Power Platform
12 14 (1.99%) Serverless
13 12 (1.70%) Azure Cosmos DB
14 10 (1.42%) GitHub Actions
15 9 (1.28%) Amazon CloudWatch
15 9 (1.28%) Azure Monitor
16 8 (1.14%) Entra ID
17 7 (0.99%) AWS Lambda
17 7 (0.99%) Azure AKS
18 6 (0.85%) dbt
Communications & Networking
1 51 (7.24%) SAN
2 28 (3.98%) DNS
3 24 (3.41%) Firewall
4 22 (3.13%) DHCP
5 17 (2.41%) WAN
6 13 (1.85%) Network Security
6 13 (1.85%) VPN
7 10 (1.42%) BGP
7 10 (1.42%) LAN
7 10 (1.42%) MPLS
7 10 (1.42%) OSPF
8 9 (1.28%) VXLAN
9 8 (1.14%) Multicast
9 8 (1.14%) VoIP
10 7 (0.99%) Cisco IOS
10 7 (0.99%) HTTP
10 7 (0.99%) NX-OS
10 7 (0.99%) SNMP
11 6 (0.85%) Junos
11 6 (0.85%) Spanning Tree
Database & Business Intelligence
1 121 (17.19%) SQL Server
2 55 (7.81%) Relational Database
3 49 (6.96%) RDBMS
4 13 (1.85%) Power BI
5 11 (1.56%) MySQL
6 10 (1.42%) Azure SQL Database
6 10 (1.42%) Event Store
6 10 (1.42%) RavenDB
7 9 (1.28%) Metadata
8 8 (1.14%) Data Warehouse
9 7 (0.99%) Amazon Redshift
9 7 (0.99%) DynamoDB
10 6 (0.85%) Jackrabbit
10 6 (0.85%) Redis
11 5 (0.71%) MongoDB
11 5 (0.71%) NoSQL
11 5 (0.71%) PostgreSQL
12 4 (0.57%) Big Data
12 4 (0.57%) Data Lake
13 3 (0.43%) SQL Server Integration Services
Development Applications
1 37 (5.26%) Git
2 28 (3.98%) Jenkins
3 21 (2.98%) Sonatype Nexus
4 17 (2.41%) GitLab
5 14 (1.99%) JIRA
6 12 (1.70%) Maven
7 10 (1.42%) Cucumber
7 10 (1.42%) Cypress.io
7 10 (1.42%) Mercurial
7 10 (1.42%) SpecFlow
7 10 (1.42%) Visual Studio
8 7 (0.99%) Artifactory
9 6 (0.85%) CircleCI
9 6 (0.85%) git-flow
10 4 (0.57%) Spinnaker
11 2 (0.28%) gulp
11 2 (0.28%) Selenium
11 2 (0.28%) SonarQube
11 2 (0.28%) Team Foundation Server
12 1 (0.14%) Visual Studio Team System
General
1 201 (28.55%) Social Skills
2 115 (16.34%) Finance
3 76 (10.80%) Games
4 71 (10.09%) Presentation Skills
5 57 (8.10%) Organisational Skills
6 43 (6.11%) Analytical Skills
7 42 (5.97%) Banking
8 38 (5.40%) Influencing Skills
9 29 (4.12%) Inclusion and Diversity
10 26 (3.69%) Manufacturing
11 24 (3.41%) Marketing
12 18 (2.56%) Telecoms
13 15 (2.13%) Esports
14 14 (1.99%) Law
15 13 (1.85%) Financial Institution
16 11 (1.56%) Public Sector
17 9 (1.28%) Aerospace
17 9 (1.28%) Retail
18 7 (0.99%) Back Office
19 6 (0.85%) Publishing
Job Titles
1 280 (39.77%) Senior
2 143 (20.31%) Project Manager
3 116 (16.48%) Senior Manager
4 106 (15.06%) Senior Project Manager
5 88 (12.50%) Architect
6 56 (7.95%) Infrastructure Engineer
7 55 (7.81%) Infrastructure Architect
8 50 (7.10%) Senior Infrastructure Engineer
9 41 (5.82%) Lead
10 38 (5.40%) Developer
11 33 (4.69%) Systems Engineer
12 27 (3.84%) Service Manager
13 22 (3.13%) Software Engineer
14 21 (2.98%) IT Manager
14 21 (2.98%) Network Engineer
15 20 (2.84%) Development Manager
16 19 (2.70%) Software Manager
17 18 (2.56%) Senior Developer
18 17 (2.41%) Administrator
18 17 (2.41%) Consultant
Libraries, Frameworks & Software Standards
1 45 (6.39%) .NET
2 35 (4.97%) React
3 25 (3.55%) RESTful
4 24 (3.41%) AngularJS
5 23 (3.27%) Node.js
6 18 (2.56%) HTML
7 16 (2.27%) Express.js
8 15 (2.13%) SOAP
9 12 (1.70%) CSS
10 11 (1.56%) .NET Framework
11 10 (1.42%) Apache Cordova
11 10 (1.42%) Jest
11 10 (1.42%) Spring Boot
12 8 (1.14%) JSON
12 8 (1.14%) REST
12 8 (1.14%) SAPUI5
13 7 (0.99%) HTML5
13 7 (0.99%) Vue
13 7 (0.99%) Web Services
13 7 (0.99%) YAML
Miscellaneous
1 124 (17.61%) Management Information System
2 54 (7.67%) Private Cloud
3 50 (7.10%) Public Cloud
3 50 (7.10%) Self-Motivation
4 49 (6.96%) Swaptions
5 31 (4.40%) Product Ownership
6 30 (4.26%) Cloud Native
7 19 (2.70%) Data Centre
8 14 (1.99%) Blackberry
9 13 (1.85%) Onboarding
10 12 (1.70%) Mobile App
10 12 (1.70%) Sports Betting
11 11 (1.56%) Enterprise Software
12 10 (1.42%) Data Structures
13 8 (1.14%) IoT
14 7 (0.99%) Legacy Applications
14 7 (0.99%) Team-Oriented Environment
15 6 (0.85%) Legacy Systems
16 5 (0.71%) Distributed Applications
16 5 (0.71%) PKI
Operating Systems
1 178 (25.28%) Windows
2 92 (13.07%) Linux
3 29 (4.12%) Windows Server
4 10 (1.42%) Mac OS
5 9 (1.28%) Ubuntu
6 4 (0.57%) Android
6 4 (0.57%) Apple iOS
6 4 (0.57%) VMS
6 4 (0.57%) Windows 10
7 3 (0.43%) Windows Server 2003
7 3 (0.43%) Windows Server 2019
8 2 (0.28%) Unix
8 2 (0.28%) Windows Server 2012
9 1 (0.14%) Windows 7
9 1 (0.14%) Windows 8
9 1 (0.14%) Windows Server 2016
Processes & Methodologies
1 296 (42.05%) Agile
2 222 (31.53%) Project Management
3 195 (27.70%) SDLC
4 179 (25.43%) Project Delivery
5 164 (23.30%) Problem-Solving
6 156 (22.16%) Scrum
7 155 (22.02%) Computer Science
8 126 (17.90%) Migration
9 117 (16.62%) ERP
10 111 (15.77%) PRINCE2
11 108 (15.34%) Roadmaps
12 99 (14.06%) Actionable Insight
13 96 (13.64%) Mentoring
14 89 (12.64%) DevOps
14 89 (12.64%) Technology Transformation
15 81 (11.51%) Virtual Team Management
16 71 (10.09%) Containerisation
17 69 (9.80%) Infrastructure as Code
18 67 (9.52%) ITIL
19 65 (9.23%) Data Science
Programming Languages
1 90 (12.78%) SQL
2 75 (10.65%) Java
3 65 (9.23%) JavaScript
4 58 (8.24%) Python
5 51 (7.24%) PowerShell
6 49 (6.96%) VB
7 27 (3.84%) C#
8 23 (3.27%) Bash
9 20 (2.84%) TypeScript
10 10 (1.42%) PHP
11 9 (1.28%) Search Processing Language
12 7 (0.99%) Bicep
13 6 (0.85%) Shell Script
14 4 (0.57%) Go
14 4 (0.57%) Groovy
15 3 (0.43%) R
15 3 (0.43%) Tcl
15 3 (0.43%) T-SQL
16 2 (0.28%) Perl
16 2 (0.28%) Ruby
Qualifications
1 214 (30.40%) Degree
2 120 (17.05%) Computer Science Degree
3 90 (12.78%) Security Cleared
4 73 (10.37%) SC Cleared
5 30 (4.26%) Cisco Certification
6 28 (3.98%) CompTIA Security+
7 17 (2.41%) CISSP
8 15 (2.13%) Microsoft Certification
9 14 (1.99%) (ISC)2 CCSP
9 14 (1.99%) AWS Certification
9 14 (1.99%) Master's Degree
10 13 (1.85%) CCSP
11 12 (1.70%) CCNA
12 10 (1.42%) Azure Certification
12 10 (1.42%) BPSS Clearance
12 10 (1.42%) DBS Check
13 7 (0.99%) AWS Certified DevOps Engineer
13 7 (0.99%) AWS Certified SysOps Administrator
13 7 (0.99%) CWNA
13 7 (0.99%) ITIL Certification
Quality Assurance & Compliance
1 31 (4.40%) QA
2 17 (2.41%) SLA
3 8 (1.14%) PMO
4 4 (0.57%) ISO/IEC 27001
4 4 (0.57%) PCI DSS
5 3 (0.43%) COBIT
5 3 (0.43%) ISO 14001
5 3 (0.43%) ISO 9001
5 3 (0.43%) NIST
6 2 (0.28%) Data Quality
7 1 (0.14%) Accessibility
7 1 (0.14%) ISO 26262
System Software
1 92 (13.07%) Active Directory
2 59 (8.38%) Docker
3 48 (6.82%) VMware Infrastructure
4 5 (0.71%) Hyper-V
4 5 (0.71%) VMware ESXi
5 4 (0.57%) Virtual Desktop
5 4 (0.57%) Virtual Machines
6 2 (0.28%) BitLocker
7 1 (0.14%) XenApp
Systems Management
1 81 (11.51%) Terraform
2 72 (10.23%) Ansible
3 50 (7.10%) Kubernetes
4 24 (3.41%) SCCM
5 9 (1.28%) Argo
6 7 (0.99%) Packer
7 4 (0.57%) Grafana
7 4 (0.57%) Microsoft Intune
7 4 (0.57%) Progress Chef
7 4 (0.57%) Puppet
8 3 (0.43%) SCOM
9 2 (0.28%) Nessus
9 2 (0.28%) SolarWinds Orion
9 2 (0.28%) WSUS
10 1 (0.14%) Backup Exec
10 1 (0.14%) Jamf Pro
10 1 (0.14%) Salt
10 1 (0.14%) vRealize
10 1 (0.14%) vRealize Orchestrator
10 1 (0.14%) VxRail
Vendors
1 110 (15.63%) Salesforce
2 106 (15.06%) NEC
3 93 (13.21%) Oracle
4 73 (10.37%) Microsoft
5 51 (7.24%) VMware
6 49 (6.96%) OpenLink
6 49 (6.96%) Sybase
6 49 (6.96%) TIBCO
7 26 (3.69%) Cisco
8 22 (3.13%) SAP
9 18 (2.56%) SolarWinds
10 16 (2.27%) Splunk
11 14 (1.99%) MobileIron
11 14 (1.99%) Red Hat
11 14 (1.99%) Samsung
12 12 (1.70%) Dell
13 11 (1.56%) Google
14 10 (1.42%) Juniper
14 10 (1.42%) Xamarin
15 9 (1.28%) New Relic