Analytical Thinking Jobs

Analytical Thinking
UK

The table below provides summary statistics for permanent job vacancies requiring Analytical Thinking skills. It includes a benchmarking guide to the annual salaries offered in vacancies that cited Analytical Thinking over the 6 months leading up to 8 December 2024, comparing them to the same period in the previous two years.

6 months to
8 Dec 2024
Same period 2023 Same period 2022
Rank 397 458 434
Rank change year-on-year +61 -24 +54
Permanent jobs citing Analytical Thinking 418 286 891
As % of all permanent jobs advertised in the UK 0.60% 0.54% 0.73%
As % of the Processes & Methodologies category 0.68% 0.57% 0.76%
Number of salaries quoted 219 179 496
10th Percentile £35,920 £26,850 £33,750
25th Percentile £48,144 £42,500 £40,000
Median annual salary (50th Percentile) £67,500 £52,500 £55,000
Median % change year-on-year +28.57% -4.55% +10.00%
75th Percentile £77,500 £67,070 £70,000
90th Percentile £110,000 £77,750 £80,000
UK excluding London median annual salary £67,500 £47,500 £50,238
% change year-on-year +42.11% -5.45% +9.12%

All Process and Methodology Skills
UK

Analytical Thinking falls under the Processes and Methodologies category. For comparison with the information above, the following table provides summary statistics for all permanent job vacancies requiring process or methodology skills.

Permanent vacancies with a requirement for process or methodology skills 61,487 49,863 117,613
As % of all permanent jobs advertised in the UK 88.65% 94.11% 95.75%
Number of salaries quoted 28,400 36,022 72,003
10th Percentile £35,000 £32,500 £34,700
25th Percentile £45,000 £43,750 £45,000
Median annual salary (50th Percentile) £60,000 £60,000 £61,000
Median % change year-on-year - -1.64% +1.67%
75th Percentile £78,750 £80,000 £82,500
90th Percentile £97,500 £99,680 £100,000
UK excluding London median annual salary £54,714 £52,500 £53,500
% change year-on-year +4.22% -1.87% +7.00%

Analytical Thinking
Job Vacancy Trend

Job postings citing Analytical Thinking as a proportion of all IT jobs advertised.
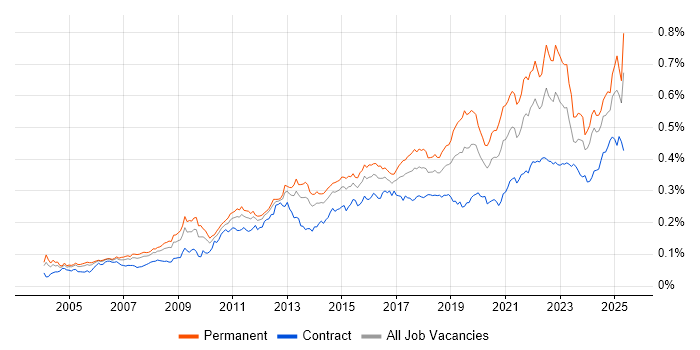
Job vacancy trend for Analytical Thinking in the UK

Analytical Thinking
Salary Trend

3-month moving average salary quoted in jobs citing Analytical Thinking.

Salary trend for Analytical Thinking in the UK

Analytical Thinking
Salary Histogram

Salary distribution for jobs citing Analytical Thinking over the 6 months to 8 December 2024.

Salary histogram for Analytical Thinking in the UK

Analytical Thinking
Top 18 Job Locations

The table below looks at the demand and provides a guide to the median salaries quoted in IT jobs citing Analytical Thinking within the UK over the 6 months to 8 December 2024. The 'Rank Change' column provides an indication of the change in demand within each location based on the same 6 month period last year.

Location Rank Change
on Same Period
Last Year
Matching
Permanent
IT Job Ads
Median Salary
Past 6 Months
Median Salary
% Change
on Same Period
Last Year
Live
Jobs
England +38 339 £67,500 +14.56% 180
Work from Home +66 275 £67,500 +35.00% 128
UK excluding London +4 254 £67,500 +42.11% 99
London +45 143 £69,500 +11.20% 92
North of England -3 68 £67,500 +3.85% 25
South West +35 53 £67,500 +14.89% 11
Scotland +22 50 £55,000 +22.22% 9
North West -24 35 £67,500 +14.56% 20
South East -48 29 £66,000 +38.95% 22
Midlands -48 28 £67,500 +54.29% 22
West Midlands -25 24 £66,250 +61.36% 12
Yorkshire +14 20 £60,000 -7.69% 1
North East - 13 £36,128 - 4
East of England -58 9 £67,500 +50.00% 7
Isle of Man -2 7 £25,000 -44.44%
Channel Islands - 7 £25,000 -
East Midlands -46 4 £67,500 +54.29% 10
Wales +18 3 £67,500 +56.98% 2

Analytical Thinking
Co-occurring Skills and Capabilities by Category

The follow tables expand on the table above by listing co-occurrences grouped by category. The same employment type, locality and period is covered with up to 20 co-occurrences shown in each of the following categories:

Application Platforms
1 11 (2.63%) Microsoft Exchange
2 7 (1.67%) SharePoint
3 5 (1.20%) Apache Airflow
3 5 (1.20%) Apache Spark
4 2 (0.48%) Apache
4 2 (0.48%) Confluence
4 2 (0.48%) Ethereum
Applications
1 25 (5.98%) Microsoft Excel
2 14 (3.35%) Microsoft Office
3 6 (1.44%) MS Visio
4 4 (0.96%) Microsoft PowerPoint
5 2 (0.48%) Photoshop
5 2 (0.48%) Spreadsheet
6 1 (0.24%) Microsoft Project
Business Applications
1 8 (1.91%) Dynamics AX
2 6 (1.44%) SAP S/4HANA
3 4 (0.96%) Adobe Campaign
3 4 (0.96%) Salesforce CRM
3 4 (0.96%) SAP MM
3 4 (0.96%) SAP SD
3 4 (0.96%) SAP WM
4 3 (0.72%) SAP APO
4 3 (0.72%) SAP EWM
4 3 (0.72%) SAP IBP
4 3 (0.72%) SAP PP
4 3 (0.72%) SAP PP-PI
4 3 (0.72%) SAP SCM
4 3 (0.72%) SAP Travel Management
5 2 (0.48%) Sage X3
6 1 (0.24%) Dynamics CRM
6 1 (0.24%) NetSuite
Cloud Services
1 63 (15.07%) Azure
2 37 (8.85%) AWS
3 34 (8.13%) Microsoft 365
4 30 (7.18%) Power Platform
5 17 (4.07%) Cloud Computing
6 13 (3.11%) GCP
6 13 (3.11%) IaaS
6 13 (3.11%) PaaS
7 12 (2.87%) Snowflake
8 10 (2.39%) Dynamics 365
9 8 (1.91%) Azure Synapse Analytics
9 8 (1.91%) GitHub
9 8 (1.91%) SaaS
10 6 (1.44%) OneDrive
11 5 (1.20%) Azure DevOps
11 5 (1.20%) Google Analytics
11 5 (1.20%) PowerApps
12 4 (0.96%) Alation
12 4 (0.96%) Azure Data Factory
12 4 (0.96%) dbt
Communications & Networking
1 38 (9.09%) Broadband
2 19 (4.55%) Firewall
3 18 (4.31%) Wi-Fi
4 13 (3.11%) DHCP
4 13 (3.11%) DNS
5 11 (2.63%) LAN
5 11 (2.63%) VPN
5 11 (2.63%) WAN
6 8 (1.91%) Network Security
7 7 (1.67%) Intrusion Detection
8 6 (1.44%) BGP
8 6 (1.44%) Cisco ISE
8 6 (1.44%) EIGRP
8 6 (1.44%) MPLS
8 6 (1.44%) OSPF
8 6 (1.44%) SD-WAN
9 4 (0.96%) SAN
9 4 (0.96%) VLAN
10 2 (0.48%) TCP/IP
11 1 (0.24%) Ethernet
Database & Business Intelligence
1 26 (6.22%) Power BI
2 21 (5.02%) Data Warehouse
3 20 (4.78%) SQL Server
4 15 (3.59%) Big Data
4 15 (3.59%) Tableau
5 8 (1.91%) Amazon Redshift
6 7 (1.67%) Crystal Reports
7 5 (1.20%) DB2
7 5 (1.20%) NoSQL
8 4 (0.96%) Apache Hive
8 4 (0.96%) BigQuery
8 4 (0.96%) Data Lake
8 4 (0.96%) Data Vault
8 4 (0.96%) Enterprise Data Warehouse
8 4 (0.96%) Hadoop
8 4 (0.96%) Metadata
8 4 (0.96%) MySQL
8 4 (0.96%) Relational Database
8 4 (0.96%) Snowflake Schema
9 2 (0.48%) MariaDB
Development Applications
1 42 (10.05%) JIRA
2 11 (2.63%) Jenkins
3 7 (1.67%) Git
4 4 (0.96%) Terragrunt
5 2 (0.48%) AppScan
5 2 (0.48%) Atlassian Bamboo
5 2 (0.48%) gulp
5 2 (0.48%) Jasmine
5 2 (0.48%) Selenium
5 2 (0.48%) SonarQube
6 1 (0.24%) Eclipse
6 1 (0.24%) Maven
6 1 (0.24%) Rational Performance Tester
General
1 418 (100.00%) Analytical Skills
2 245 (58.61%) Social Skills
3 69 (16.51%) Finance
4 33 (7.89%) Pharmaceutical
5 23 (5.50%) Manufacturing
5 23 (5.50%) Retail
6 22 (5.26%) Presentation Skills
7 17 (4.07%) Organisational Skills
8 14 (3.35%) Influencing Skills
8 14 (3.35%) Law
9 12 (2.87%) Banking
10 10 (2.39%) Marketing
11 9 (2.15%) Games
11 9 (2.15%) Inclusion and Diversity
12 8 (1.91%) Public Sector
13 4 (0.96%) Documentation Skills
13 4 (0.96%) Electronics
13 4 (0.96%) Front Office
14 3 (0.72%) Legal
15 2 (0.48%) Automotive
Job Titles
1 92 (22.01%) Senior
2 78 (18.66%) Analyst
3 69 (16.51%) Architect
4 59 (14.11%) Developer
5 53 (12.68%) Business Architect
6 45 (10.77%) Senior Developer
7 24 (5.74%) IT Support
8 22 (5.26%) Business Analyst
9 20 (4.78%) Consultant
9 20 (4.78%) Technical Support
10 19 (4.55%) Lead
11 17 (4.07%) Senior Manager
12 16 (3.83%) Project Manager
13 14 (3.35%) 1st Line Support
13 14 (3.35%) 1st Line Technical Support
13 14 (3.35%) Data Scientist
13 14 (3.35%) Senior Data Scientist
14 13 (3.11%) Infrastructure Manager
14 13 (3.11%) Operations Manager
15 12 (2.87%) Infrastructure Operations Manager
Libraries, Frameworks & Software Standards
1 38 (9.09%) Spring
1 38 (9.09%) Spring Boot
2 19 (4.55%) HTML
3 13 (3.11%) CSS
4 12 (2.87%) XML
5 10 (2.39%) .NET
6 7 (1.67%) AngularJS
6 7 (1.67%) Elastic Stack
6 7 (1.67%) Web Services
7 5 (1.20%) DHTML
7 5 (1.20%) J2EE
7 5 (1.20%) JDBC
7 5 (1.20%) JSP
7 5 (1.20%) RESTful
7 5 (1.20%) Servlets
8 4 (0.96%) CSS3
8 4 (0.96%) Django
8 4 (0.96%) HTML5
8 4 (0.96%) JSON
8 4 (0.96%) Kafka
Miscellaneous
1 33 (7.89%) Algorithms
1 33 (7.89%) Life Science
2 16 (3.83%) Data Centre
2 16 (3.83%) Self-Motivation
3 15 (3.59%) Cyber Threat
4 12 (2.87%) Management Information System
5 11 (2.63%) Product Ownership
6 5 (1.20%) Client/Server
6 5 (1.20%) Enterprise Software
7 4 (0.96%) Blog
7 4 (0.96%) IoT
7 4 (0.96%) Public Cloud
8 3 (0.72%) Analytical Mindset
8 3 (0.72%) Onboarding
8 3 (0.72%) PMI
8 3 (0.72%) SCADA
9 2 (0.48%) Blockchain
9 2 (0.48%) Infotainment
9 2 (0.48%) Marketing Technology
9 2 (0.48%) Security Posture
Operating Systems
1 53 (12.68%) Windows
2 22 (5.26%) Linux
3 15 (3.59%) Windows Server
4 10 (2.39%) Unix
5 6 (1.44%) Android
5 6 (1.44%) Apple iOS
6 4 (0.96%) Windows 10
7 1 (0.24%) Windows Vista
Processes & Methodologies
1 168 (40.19%) Problem-Solving
2 156 (37.32%) Agile
3 116 (27.75%) Strategic Thinking
4 83 (19.86%) Process Improvement
5 75 (17.94%) Scrum
6 73 (17.46%) Business Strategy
7 71 (16.99%) Computer Science
8 68 (16.27%) Roadmaps
9 65 (15.55%) Analytics
10 64 (15.31%) DevOps
11 63 (15.07%) Critical Thinking
12 58 (13.88%) Data Modelling
13 53 (12.68%) Process Management
14 52 (12.44%) Kanban
15 51 (12.20%) Full-Stack Development
15 51 (12.20%) Visualisation
16 50 (11.96%) Mentoring
17 48 (11.48%) Technology Roadmap
18 47 (11.24%) Data Science
19 44 (10.53%) Data Visualisation
Programming Languages
1 49 (11.72%) SQL
2 45 (10.77%) Java
3 40 (9.57%) Python
4 25 (5.98%) JavaScript
5 15 (3.59%) PowerShell
6 12 (2.87%) Bash
6 12 (2.87%) C#
7 7 (1.67%) TypeScript
8 4 (0.96%) PL/SQL
8 4 (0.96%) VBA
9 3 (0.72%) T-SQL
10 2 (0.48%) Go
10 2 (0.48%) PHP
10 2 (0.48%) R
11 1 (0.24%) ABAP
11 1 (0.24%) Apex Code
11 1 (0.24%) Bicep
11 1 (0.24%) Shell Script
Qualifications
1 120 (28.71%) Degree
2 46 (11.00%) Master's Degree
3 33 (7.89%) PhD
4 28 (6.70%) Computer Science Degree
5 18 (4.31%) Security Cleared
6 14 (3.35%) PMI Certification
7 11 (2.63%) PMP
8 8 (1.91%) DBS Check
8 8 (1.91%) PRINCE2 Certification
8 8 (1.91%) SC Cleared
9 6 (1.44%) Six Sigma Green Belt
10 4 (0.96%) Azure Certification
10 4 (0.96%) BPSS Clearance
10 4 (0.96%) CISM
10 4 (0.96%) CISSP
10 4 (0.96%) PRINCE2 Practitioner
11 3 (0.72%) CEH
11 3 (0.72%) Chartered Engineer
11 3 (0.72%) HND
12 2 (0.48%) Six Sigma Black Belt
Quality Assurance & Compliance
1 23 (5.50%) ISO/IEC 27001
2 22 (5.26%) GDPR
3 21 (5.02%) Cyber Essentials
4 16 (3.83%) Cyber Essentials PLUS
5 15 (3.59%) Data Quality
5 15 (3.59%) PCI DSS
6 10 (2.39%) QA
6 10 (2.39%) SLA
7 5 (1.20%) Accessibility
7 5 (1.20%) NCSC
8 4 (0.96%) NIST
9 3 (0.72%) PMO
10 1 (0.24%) Actionable Recommendations
10 1 (0.24%) GRC
10 1 (0.24%) ISO 14001
10 1 (0.24%) JTAG
10 1 (0.24%) Sarbanes-Oxley
System Software
1 21 (5.02%) Active Directory
2 10 (2.39%) vSphere
3 9 (2.15%) Hyper-V
4 4 (0.96%) HDFS
5 2 (0.48%) VMware Infrastructure
6 1 (0.24%) Docker
6 1 (0.24%) Virtual Machines
Systems Management
1 14 (3.35%) Terraform
2 8 (1.91%) Ansible
3 7 (1.67%) Grafana
3 7 (1.67%) Prometheus
4 4 (0.96%) SCCM
5 3 (0.72%) Kubernetes
6 2 (0.48%) Matomo
6 2 (0.48%) Microsoft Intune
6 2 (0.48%) Progress Chef
6 2 (0.48%) Puppet
7 1 (0.24%) Galera Cluster
7 1 (0.24%) HAProxy
7 1 (0.24%) MOM
Vendors
1 45 (10.77%) Microsoft
2 20 (4.78%) SAP
3 17 (4.07%) Oracle
4 16 (3.83%) Databricks
5 15 (3.59%) SolarWinds
6 14 (3.35%) Freshdesk
7 10 (2.39%) Google
7 10 (2.39%) Salesforce
8 9 (2.15%) IFS
8 9 (2.15%) Nimble Storage
8 9 (2.15%) Splunk
8 9 (2.15%) Veeam
8 9 (2.15%) Zscaler
9 7 (1.67%) Palo Alto
9 7 (1.67%) VMware
10 6 (1.44%) Cisco
10 6 (1.44%) Fortinet
10 6 (1.44%) Juniper
11 5 (1.20%) Sony
12 4 (0.96%) MicroStrategy