Cybersecurity Contracts in London

Cybersecurity
England > London

The following table provides summary statistics for contract job vacancies advertised in London with a requirement for Cybersecurity skills. Included is a benchmarking guide to the contractor rates offered in vacancies that have cited Cybersecurity over the 6 months to 5 June 2024 with a comparison to the same period in the previous 2 years.

6 months to
5 Jun 2024
Same period 2023 Same period 2022
Rank 69 57 84
Rank change year-on-year -12 +27 +6
Contract jobs citing Cybersecurity 563 1,025 1,222
As % of all contract jobs advertised in London 3.21% 4.07% 3.16%
As % of the Processes & Methodologies category 3.64% 4.48% 3.42%
Number of daily rates quoted 425 729 843
10th Percentile £400 £450 £401
25th Percentile £500 £525 £500
Median daily rate (50th Percentile) £600 £628 £588
Median % change year-on-year -4.40% +6.83% +6.82%
75th Percentile £725 £741 £700
90th Percentile £800 £825 £788
England median daily rate £590 £601 £575
% change year-on-year -1.75% +4.43% +9.52%
Number of hourly rates quoted 3 3 6
10th Percentile £30.02 £63.60 -
25th Percentile £30.06 £66.00 £26.25
Median hourly rate £30.12 £70.00 £29.75
Median % change year-on-year -56.97% +135.29% -50.42%
75th Percentile £53.19 £81.88 £35.81
90th Percentile £67.02 £89.00 £40.25
England median hourly rate £82.34 £73.99 £35.50
% change year-on-year +11.28% +108.42% -29.00%

All Process and Methodology Skills
London

Cybersecurity is in the Processes and Methodologies category. The following table is for comparison with the above and provides summary statistics for all contract job vacancies advertised in London with a requirement for process or methodology skills.

Contract vacancies with a requirement for process or methodology skills 15,469 22,876 35,688
As % of all contract IT jobs advertised in London 88.31% 90.94% 92.21%
Number of daily rates quoted 11,075 16,566 26,177
10th Percentile £340 £375 £393
25th Percentile £445 £475 £475
Median daily rate (50th Percentile) £550 £590 £575
Median % change year-on-year -6.78% +2.61% +9.52%
75th Percentile £675 £700 £688
90th Percentile £800 £800 £775
England median daily rate £525 £550 £545
% change year-on-year -4.55% +0.92% +9.00%
Number of hourly rates quoted 317 262 399
10th Percentile £15.50 £18.00 £16.90
25th Percentile £20.00 £21.88 £23.91
Median hourly rate £28.00 £39.00 £35.50
Median % change year-on-year -28.21% +9.86% +1.78%
75th Percentile £48.75 £64.38 £50.31
90th Percentile £68.30 £82.48 £67.63
England median hourly rate £37.50 £36.54 £25.00
% change year-on-year +2.63% +46.16% +11.11%

Cybersecurity
Job Vacancy Trend in London

Job postings citing Cybersecurity as a proportion of all IT jobs advertised in London.
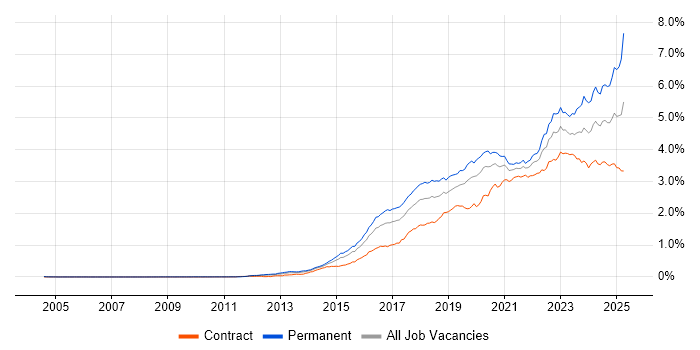
Job vacancy trend for Cybersecurity in London

Cybersecurity
Contractor Daily Rate Trend in London

3-month moving average daily rate quoted in jobs citing Cybersecurity in London.

Daily rate trend for Cybersecurity in London

Cybersecurity
Daily Rate Histogram in London

Daily rate distribution for jobs citing Cybersecurity in London over the 6 months to 5 June 2024.

Daily rate histogram for Cybersecurity in London

Cybersecurity
Contractor Hourly Rate Trend in London

3-month moving average hourly rates quoted in jobs citing Cybersecurity in London.

Hourly rate trend for Cybersecurity in London

Cybersecurity
Hourly Rate Histogram in London

Hourly rate distribution of jobs citing Cybersecurity in London over the 6 months to 5 June 2024.

Hourly rate histogram for Cybersecurity in London

Cybersecurity
Contract Job Locations in London

The table below looks at the demand and provides a guide to the median contractor rates quoted in IT jobs citing Cybersecurity within the London region over the 6 months to 5 June 2024. The 'Rank Change' column provides an indication of the change in demand within each location based on the same 6 month period last year.

Location Rank Change
on Same Period
Last Year
Matching
Contract
IT Job Ads
Median
Daily Rate
Past 6 Months
Median Daily Rate
% Change
on Same Period
Last Year
Live
Jobs
Central London +7 110 £625 -3.85% 39
East London +7 24 £627 -16.40% 11
West London -6 7 £525 -25.00% 16
South London +7 2 £675 +47.22% 8
North London +3 2 £380 -33.91% 9
Cybersecurity
England

Cybersecurity
Co-occurring Skills and Capabilities in London by Category

The follow tables expand on the table above by listing co-occurrences grouped by category. The same employment type, locality and period is covered with up to 20 co-occurrences shown in each of the following categories:

Application Platforms
1 12 (2.13%) Confluence
2 8 (1.42%) Microsoft Exchange
2 8 (1.42%) SharePoint
3 3 (0.53%) CMS
4 2 (0.36%) Jupyter
4 2 (0.36%) nginx
5 1 (0.18%) Apache
5 1 (0.18%) Apache Spark
5 1 (0.18%) Cloud Foundry
5 1 (0.18%) IBM HTTP Server
5 1 (0.18%) IIS
5 1 (0.18%) WebSphere
5 1 (0.18%) WebSphere Application Server
5 1 (0.18%) WebSphere Portal
Applications
1 11 (1.95%) Microsoft Office
2 6 (1.07%) Microsoft Project
3 4 (0.71%) Microsoft Excel
4 3 (0.53%) Microsoft PowerPoint
4 3 (0.53%) MS Visio
4 3 (0.53%) Trello
5 1 (0.18%) Chatbot
5 1 (0.18%) Spreadsheet
Business Applications
1 4 (0.71%) Sparx Enterprise Architect
Cloud Services
1 115 (20.43%) Azure
2 83 (14.74%) AWS
3 43 (7.64%) Microsoft 365
4 35 (6.22%) GCP
5 22 (3.91%) SaaS
6 18 (3.20%) Entra ID
7 14 (2.49%) Azure DevOps
8 12 (2.13%) Azure Sentinel
8 12 (2.13%) Microsoft Purview
9 10 (1.78%) GitHub
9 10 (1.78%) IaaS
10 6 (1.07%) Cloud Computing
10 6 (1.07%) Mimecast
10 6 (1.07%) Power Platform
11 5 (0.89%) GitHub Actions
11 5 (0.89%) PaaS
12 4 (0.71%) Google Kubernetes Engine
12 4 (0.71%) WhatsApp
13 3 (0.53%) Figma
13 3 (0.53%) Serverless
Communications & Networking
1 56 (9.95%) Firewall
2 36 (6.39%) Network Security
3 19 (3.37%) DNS
3 19 (3.37%) WAN
4 15 (2.66%) TCP/IP
5 10 (1.78%) HTTP
5 10 (1.78%) Internet
5 10 (1.78%) SD-WAN
6 9 (1.60%) DHCP
6 9 (1.60%) LAN
7 8 (1.42%) Intrusion Detection
8 6 (1.07%) VPN
8 6 (1.07%) Wireless
9 5 (0.89%) HTTPS
9 5 (0.89%) Wi-Fi
10 4 (0.71%) IPsec
11 3 (0.53%) FTP
11 3 (0.53%) SSL
11 3 (0.53%) VoIP
11 3 (0.53%) WLAN
Database & Business Intelligence
1 13 (2.31%) Big Data
2 12 (2.13%) Data Lake
3 8 (1.42%) Elasticsearch
4 6 (1.07%) Power BI
5 4 (0.71%) SQL Server
6 3 (0.53%) Relational Database
7 2 (0.36%) Amazon Athena
7 2 (0.36%) PostgreSQL
8 1 (0.18%) BusinessObjects
8 1 (0.18%) Data Warehouse
8 1 (0.18%) DB2
8 1 (0.18%) DynamoDB
8 1 (0.18%) MySQL
8 1 (0.18%) NoSQL
8 1 (0.18%) Oracle Database
8 1 (0.18%) Oracle Exadata
8 1 (0.18%) Oracle Reports
8 1 (0.18%) RDBMS
8 1 (0.18%) SAP HANA
Development Applications
1 24 (4.26%) Jenkins
2 14 (2.49%) GitLab
3 9 (1.60%) Artifactory
3 9 (1.60%) JIRA
4 8 (1.42%) Subversion
5 5 (0.89%) Git
6 3 (0.53%) Burp Suite
6 3 (0.53%) CircleCI
7 2 (0.36%) Appium
7 2 (0.36%) Maven
7 2 (0.36%) Postman
7 2 (0.36%) RStudio
7 2 (0.36%) Selenium
7 2 (0.36%) SonarQube
7 2 (0.36%) Terragrunt
7 2 (0.36%) Visual Studio Code
8 1 (0.18%) Bitbucket
8 1 (0.18%) Cypress.io
8 1 (0.18%) GoCD
8 1 (0.18%) JMeter
General
1 167 (29.66%) Finance
2 103 (18.29%) Social Skills
3 56 (9.95%) Banking
4 51 (9.06%) Analytical Skills
5 40 (7.10%) Public Sector
6 26 (4.62%) Financial Institution
7 20 (3.55%) Presentation Skills
8 18 (3.20%) Legal
9 13 (2.31%) Inclusion and Diversity
10 12 (2.13%) Telecoms
11 10 (1.78%) Retail
12 8 (1.42%) International Banking
12 8 (1.42%) Law
13 7 (1.24%) Advertising
14 5 (0.89%) Local Government
14 5 (0.89%) Marketing
14 5 (0.89%) Police
15 4 (0.71%) Documentation Skills
15 4 (0.71%) Influencing Skills
15 4 (0.71%) Investment Banking
Job Titles
1 101 (17.94%) Architect
2 99 (17.58%) Analyst
3 80 (14.21%) Consultant
4 66 (11.72%) Security Architect
5 56 (9.95%) Security Consultant
5 56 (9.95%) Security Engineer
6 50 (8.88%) Security Manager
7 39 (6.93%) Project Manager
7 39 (6.93%) Security Analyst
8 38 (6.75%) Senior
9 32 (5.68%) Cybersecurity Manager
10 28 (4.97%) Cybersecurity Analyst
10 28 (4.97%) Cybersecurity Consultant
10 28 (4.97%) Cybersecurity Engineer
11 26 (4.62%) Security Project Manager
12 24 (4.26%) Cybersecurity Architect
13 22 (3.91%) Project Manager - Cybersecurity
14 19 (3.37%) Business Analyst
14 19 (3.37%) DevOps Engineer
14 19 (3.37%) Lead
Libraries, Frameworks & Software Standards
1 13 (2.31%) SailPoint
2 12 (2.13%) Middleware
2 12 (2.13%) OpenID
3 9 (1.60%) .NET
3 9 (1.60%) JWT
4 6 (1.07%) Kafka
4 6 (1.07%) OAuth
4 6 (1.07%) SAML
5 3 (0.53%) CSS
5 3 (0.53%) HTML
5 3 (0.53%) LDAP
5 3 (0.53%) REST
5 3 (0.53%) RESTful
5 3 (0.53%) YAML
6 2 (0.36%) Bazel
6 2 (0.36%) Elastic Stack
6 2 (0.36%) gRPC
6 2 (0.36%) Jinja
6 2 (0.36%) Web Services
6 2 (0.36%) WebSockets
Miscellaneous
1 47 (8.35%) Management Information System
2 41 (7.28%) Security Posture
3 31 (5.51%) Cyber Threat
4 27 (4.80%) PKI
4 27 (4.80%) Product Ownership
5 16 (2.84%) Hybrid Cloud
6 15 (2.66%) Security Operations Centre
7 14 (2.49%) Data Centre
8 11 (1.95%) Cyber Defence
8 11 (1.95%) Onboarding
9 10 (1.78%) Data Protection Act
9 10 (1.78%) Mobile App
9 10 (1.78%) Operational Technology
10 9 (1.60%) Self-Motivation
11 7 (1.24%) Cyber Kill Chain
11 7 (1.24%) Public Cloud
12 6 (1.07%) Cyberattack
13 5 (0.89%) Cloud Native
13 5 (0.89%) Cyber Security Posture
13 5 (0.89%) Distributed Denial-of-Service
Operating Systems
1 51 (9.06%) Windows
2 50 (8.88%) Linux
3 18 (3.20%) Windows Server
4 10 (1.78%) Unix
5 3 (0.53%) Red Hat Enterprise Linux
6 2 (0.36%) Android
7 1 (0.18%) Apple iOS
7 1 (0.18%) Kali Linux
7 1 (0.18%) Mac OS
7 1 (0.18%) Oracle Linux
7 1 (0.18%) Windows 10
Processes & Methodologies
1 125 (22.20%) Information Security
2 81 (14.39%) SIEM
3 77 (13.68%) Cloud Security
4 76 (13.50%) Agile
5 72 (12.79%) Risk Management
6 67 (11.90%) Security Operations
7 65 (11.55%) Incident Response
7 65 (11.55%) Security Architecture
8 63 (11.19%) Problem-Solving
9 61 (10.83%) DevOps
10 50 (8.88%) Identity Access Management
11 45 (7.99%) Roadmaps
12 42 (7.46%) Data Protection
12 42 (7.46%) Vulnerability Management
13 41 (7.28%) Business Strategy
14 40 (7.10%) Disaster Recovery
15 39 (6.93%) Project Management
16 38 (6.75%) Penetration Testing
17 37 (6.57%) Data Loss Prevention
17 37 (6.57%) Stakeholder Management
Programming Languages
1 54 (9.59%) PowerShell
2 45 (7.99%) Python
3 28 (4.97%) Java
4 24 (4.26%) C#
5 16 (2.84%) JavaScript
6 13 (2.31%) C++
6 13 (2.31%) SQL
7 8 (1.42%) Kusto Query Language
8 6 (1.07%) Rust
9 5 (0.89%) Bash
9 5 (0.89%) Perl
10 4 (0.71%) Go
10 4 (0.71%) Shell Script
11 2 (0.36%) Clojure
11 2 (0.36%) Haskell
11 2 (0.36%) Kotlin
11 2 (0.36%) R
11 2 (0.36%) Search Processing Language
12 1 (0.18%) Ruby
12 1 (0.18%) T-SQL
Qualifications
1 102 (18.12%) Security Cleared
2 100 (17.76%) CISSP
3 82 (14.56%) SC Cleared
4 76 (13.50%) CISM
5 47 (8.35%) Degree
6 40 (7.10%) DV Cleared
7 33 (5.86%) CISA
8 19 (3.37%) CRISC
9 18 (3.20%) CEH
10 17 (3.02%) Computer Science Degree
11 14 (2.49%) Cisco Certification
11 14 (2.49%) GIAC
12 12 (2.13%) AWS Certification
12 12 (2.13%) CompTIA Security+
13 10 (1.78%) (ISC)2 CCSP
13 10 (1.78%) OSCP
13 10 (1.78%) SANS
14 8 (1.42%) CTC Cleared
15 7 (1.24%) GCIA
15 7 (1.24%) GCIH
Quality Assurance & Compliance
1 105 (18.65%) NIST
2 82 (14.56%) ISO/IEC 27001
3 31 (5.51%) GDPR
4 26 (4.62%) PCI DSS
5 18 (3.20%) GRC
6 16 (2.84%) ISO/IEC 27002 (supersedes ISO/IEC 17799)
7 15 (2.66%) NCSC
8 12 (2.13%) Cyber Essentials
9 11 (1.95%) COBIT
10 8 (1.42%) NIST 800
10 8 (1.42%) QA
11 6 (1.07%) ISO 22301
11 6 (1.07%) ISO 31000
11 6 (1.07%) SLA
12 4 (0.71%) Cyber Essentials PLUS
12 4 (0.71%) ISO/IEC 20000
13 3 (0.53%) GPG13
14 2 (0.36%) Accessibility
14 2 (0.36%) Actionable Recommendations
14 2 (0.36%) Data Quality
System Software
1 35 (6.22%) Active Directory
2 10 (1.78%) Virtual Machines
3 9 (1.60%) Docker
4 5 (0.89%) VMware Infrastructure
5 2 (0.36%) NFS
5 2 (0.36%) vSphere
5 2 (0.36%) XenApp
6 1 (0.18%) Ceph
6 1 (0.18%) Virtual Servers
Systems Management
1 43 (7.64%) Terraform
2 39 (6.93%) Ansible
3 26 (4.62%) Kubernetes
4 11 (1.95%) Puppet
5 9 (1.60%) CSIRT
5 9 (1.60%) Microsoft Intune
5 9 (1.60%) Nessus
6 7 (1.24%) ArcSight ESM
6 7 (1.24%) BladeLogic
6 7 (1.24%) ITRS Geneos
6 7 (1.24%) QRadar
6 7 (1.24%) Single Sign-On
7 5 (0.89%) FortiGate
8 4 (0.71%) Functional Safety
8 4 (0.71%) SCCM
9 3 (0.53%) CASB
9 3 (0.53%) Prometheus
9 3 (0.53%) WSUS
10 2 (0.36%) Istio
10 2 (0.36%) SCOrch
Vendors
1 109 (19.36%) Microsoft
2 13 (2.31%) Cisco
2 13 (2.31%) Citrix
3 11 (1.95%) CyberArk
3 11 (1.95%) Google
3 11 (1.95%) Oracle
4 10 (1.78%) Palo Alto
4 10 (1.78%) Rapid7
4 10 (1.78%) Splunk
5 9 (1.60%) Qualys
6 8 (1.42%) ArcSight
6 8 (1.42%) CrowdStrike
7 7 (1.24%) Altiris
7 7 (1.24%) Dynatrace
7 7 (1.24%) ServiceNow
8 6 (1.07%) VMware
9 5 (0.89%) Darktrace
9 5 (0.89%) McAfee
9 5 (0.89%) SAP
10 4 (0.71%) Okta