GCP Contracts in London

Google Cloud Platform (GCP)
England > London

The table below provides summary statistics for contract job vacancies advertised in London requiring GCP skills. It includes a benchmarking guide to the contractor rates offered in vacancies that cited GCP over the 6 months leading up to 2 April 2025, comparing them to the same period in the previous two years.

6 months to
2 Apr 2025
Same period 2024 Same period 2023
Rank 44 52 51
Rank change year-on-year +8 -1 +2
Contract jobs citing GCP 618 702 1,302
As % of all contract jobs advertised in London 4.90% 3.89% 4.57%
As % of the Cloud Services category 11.53% 10.39% 11.74%
Number of daily rates quoted 435 543 987
10th Percentile £450 £465 £453
25th Percentile £513 £516 £534
Median daily rate (50th Percentile) £600 £650 £650
Median % change year-on-year -7.69% - +4.00%
75th Percentile £713 £775 £738
90th Percentile £838 £824 £835
England median daily rate £600 £600 £625
% change year-on-year - -4.00% +4.17%
Number of hourly rates quoted 5 5 9
10th Percentile £51.45 £44.52 £62.00
25th Percentile £51.75 £46.75 £64.50
Median hourly rate £55.50 £55.00 £80.00
Median % change year-on-year +0.91% -31.25% +3.65%
75th Percentile £58.75 £58.75 £83.75
90th Percentile £59.95 £63.70 £92.50
England median hourly rate £53.50 £51.06 £70.09
% change year-on-year +4.79% -27.16% +7.83%

All Cloud Skills
London

GCP falls under the Cloud Services category. For comparison with the information above, the following table provides summary statistics for all contract job vacancies requiring cloud computing skills in London.

Contract vacancies with a requirement for cloud computing skills 5,362 6,757 11,092
As % of all contract IT jobs advertised in London 42.54% 37.43% 38.91%
Number of daily rates quoted 3,753 4,943 8,039
10th Percentile £356 £325 £375
25th Percentile £439 £440 £475
Median daily rate (50th Percentile) £550 £550 £588
Median % change year-on-year - -6.38% +2.17%
75th Percentile £663 £675 £695
90th Percentile £775 £775 £775
England median daily rate £525 £525 £550
% change year-on-year - -4.55% -
Number of hourly rates quoted 51 77 94
10th Percentile £22.27 £17.47 £17.26
25th Percentile £24.66 £21.25 £22.63
Median hourly rate £29.07 £26.00 £35.00
Median % change year-on-year +11.81% -25.71% -
75th Percentile £54.50 £48.75 £70.00
90th Percentile £67.50 £61.00 £82.85
England median hourly rate £26.50 £21.00 £25.85
% change year-on-year +26.19% -18.75% +26.01%

GCP
Job Vacancy Trend in London

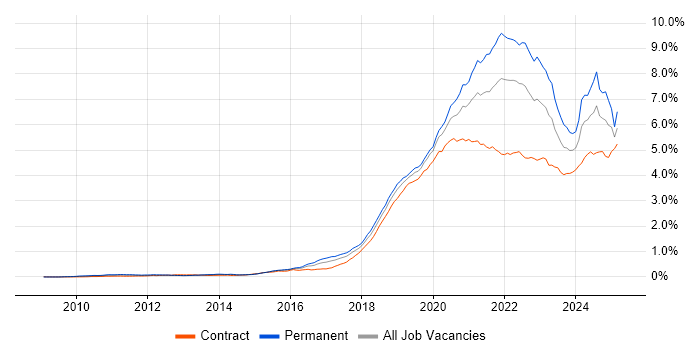
Job postings citing GCP as a proportion of all IT jobs advertised in London.

Job vacancy trend for GCP in London

GCP
Contractor Daily Rate Trend in London

3-month moving average daily rate quoted in jobs citing GCP in London.

Daily rate trend for GCP in London

GCP
Daily Rate Histogram in London

Daily rate distribution for jobs citing GCP in London over the 6 months to 2 April 2025.

Daily rate histogram for GCP in London

GCP
Contractor Hourly Rate Trend in London

3-month moving average hourly rates quoted in jobs citing GCP in London.

Hourly rate trend for GCP in London

GCP
Contract Job Locations in London

The table below looks at the demand and provides a guide to the median contractor rates quoted in IT jobs citing GCP within the London region over the 6 months to 2 April 2025. The 'Rank Change' column provides an indication of the change in demand within each location based on the same 6 month period last year.

Location Rank Change
on Same Period
Last Year
Matching
Contract
IT Job Ads
Median
Daily Rate
Past 6 Months
Median Daily Rate
% Change
on Same Period
Last Year
Live
Jobs
Central London 0 63 £513 -14.58% 30
East London +18 4 £625 +25.00% 3
South London +1 3 £473 -5.50% 5
West London -5 3 £500 - 5
GCP
England

GCP
Co-occurring Skills and Capabilities in London by Category

The follow tables expand on the table above by listing co-occurrences grouped by category. The same employment type, locality and period is covered with up to 20 co-occurrences shown in each of the following categories:

Application Platforms
1 63 (10.19%) Apache Airflow
2 44 (7.12%) Apache
3 25 (4.05%) Apache Spark
4 18 (2.91%) Confluence
5 4 (0.65%) CMS
5 4 (0.65%) nginx
5 4 (0.65%) SharePoint
6 3 (0.49%) SAS
7 2 (0.32%) Drupal
7 2 (0.32%) Jupyter
7 2 (0.32%) Tomcat
8 1 (0.16%) Apache Solr
8 1 (0.16%) Headless CMS
8 1 (0.16%) JBoss
8 1 (0.16%) Microsoft Exchange
Applications
1 11 (1.78%) Microsoft Excel
2 7 (1.13%) Microsoft PowerPoint
3 6 (0.97%) MS Visio
4 2 (0.32%) 1Password
5 1 (0.16%) Microsoft Project
5 1 (0.16%) Trello
Business Applications
1 7 (1.13%) Shopify
2 4 (0.65%) Unica
3 2 (0.32%) assyst
3 2 (0.32%) Oracle EBS
3 2 (0.32%) Sprinklr
4 1 (0.16%) Magento
4 1 (0.16%) NetSuite
4 1 (0.16%) Oracle EBS R12
Cloud Services
1 440 (71.20%) AWS
2 365 (59.06%) Azure
3 67 (10.84%) dbt
4 56 (9.06%) Snowflake
5 38 (6.15%) GitHub
6 32 (5.18%) Power Platform
7 31 (5.02%) Dagster
8 30 (4.85%) Cloud Computing
9 24 (3.88%) Amazon EKS
10 22 (3.56%) SaaS
11 21 (3.40%) Amazon EC2
11 21 (3.40%) PaaS
12 20 (3.24%) Serverless
13 19 (3.07%) OpenShift
14 17 (2.75%) Amazon ECS
14 17 (2.75%) Azure DevOps
14 17 (2.75%) GitHub Actions
14 17 (2.75%) IaaS
15 14 (2.27%) Amazon S3
15 14 (2.27%) Entra ID
Communications & Networking
1 28 (4.53%) Firewall
2 20 (3.24%) DNS
3 19 (3.07%) Network Security
4 15 (2.43%) TCP/IP
5 14 (2.27%) VPN
6 10 (1.62%) DHCP
7 8 (1.29%) Modbus
7 8 (1.29%) MQTT
8 6 (0.97%) HTTP
8 6 (0.97%) Kerberos
9 5 (0.81%) VLAN
10 4 (0.65%) HTTPS
10 4 (0.65%) Software-Defined Networking
11 3 (0.49%) DOCSIS
11 3 (0.49%) Internet
11 3 (0.49%) NGFW
11 3 (0.49%) SMTP
11 3 (0.49%) Wi-Fi
11 3 (0.49%) Wireless
12 2 (0.32%) SD-WAN
Database & Business Intelligence
1 67 (10.84%) BigQuery
2 61 (9.87%) Data Lake
3 56 (9.06%) Data Warehouse
3 56 (9.06%) PostgreSQL
4 55 (8.90%) Amazon Athena
5 53 (8.58%) Apache Iceberg
5 53 (8.58%) Dremio
6 39 (6.31%) Apache Arrow
7 32 (5.18%) Apache Ignite
8 31 (5.02%) Power BI
9 28 (4.53%) Looker
10 26 (4.21%) Tableau
11 24 (3.88%) Big Data
12 19 (3.07%) NoSQL
13 17 (2.75%) Metadata
14 15 (2.43%) Hadoop
14 15 (2.43%) MongoDB
14 15 (2.43%) MySQL
15 11 (1.78%) Relational Database
15 11 (1.78%) SQL Server
Development Applications
1 70 (11.33%) Jenkins
2 47 (7.61%) GitLab
3 41 (6.63%) Git
4 26 (4.21%) JIRA
5 9 (1.46%) SonarQube
6 8 (1.29%) Bitbucket
6 8 (1.29%) MSI
7 7 (1.13%) CircleCI
7 7 (1.13%) MLflow
7 7 (1.13%) TeamCity
8 5 (0.81%) JUnit
9 4 (0.65%) Artifactory
9 4 (0.65%) JMeter
9 4 (0.65%) Maven
9 4 (0.65%) Subversion
9 4 (0.65%) TestNG
10 3 (0.49%) Gradle
10 3 (0.49%) Mockito
10 3 (0.49%) Selenium
10 3 (0.49%) Terragrunt
General
1 213 (34.47%) Finance
2 131 (21.20%) Social Skills
3 103 (16.67%) Front Office
4 96 (15.53%) Banking
5 59 (9.55%) Analytical Skills
6 28 (4.53%) Investment Banking
7 20 (3.24%) Marketing
7 20 (3.24%) Presentation Skills
8 19 (3.07%) Retail
9 18 (2.91%) Public Sector
10 11 (1.78%) Financial Institution
11 9 (1.46%) Telecoms
12 7 (1.13%) Inclusion and Diversity
13 5 (0.81%) Advertising
14 4 (0.65%) Manufacturing
14 4 (0.65%) Organisational Skills
15 3 (0.49%) Influencing Skills
15 3 (0.49%) Legal
15 3 (0.49%) Retail Banking
16 2 (0.32%) Law
Job Titles
1 127 (20.55%) Architect
2 125 (20.23%) Developer
3 94 (15.21%) Software Engineer
4 69 (11.17%) Developer/Software Engineer
5 63 (10.19%) Senior
6 56 (9.06%) Data Engineer
6 56 (9.06%) Python Engineer
7 50 (8.09%) AWS Engineer
7 50 (8.09%) DevOps Engineer
7 50 (8.09%) GCP Engineer
8 42 (6.80%) AWS Software Engineer
9 39 (6.31%) React Developer
10 38 (6.15%) Solutions Architect
11 33 (5.34%) Lead
12 31 (5.02%) Python Developer
13 30 (4.85%) Python Software Engineer
14 29 (4.69%) Analyst
14 29 (4.69%) Consultant
15 28 (4.53%) Cloud Architect
15 28 (4.53%) Data Architect
Libraries, Frameworks & Software Standards
1 88 (14.24%) React
2 64 (10.36%) Node.js
3 63 (10.19%) Pandas
4 59 (9.55%) Redux
5 57 (9.22%) NumPy
6 56 (9.06%) SciPy
7 40 (6.47%) AngularJS
7 40 (6.47%) PySpark
8 39 (6.31%) Vue
9 35 (5.66%) gRPC
10 33 (5.34%) Protocol Buffers
11 28 (4.53%) Kafka
12 23 (3.72%) Spring
13 19 (3.07%) Elastic Stack
13 19 (3.07%) REST
14 14 (2.27%) .NET
15 13 (2.10%) RESTful
16 11 (1.78%) JSON
17 10 (1.62%) PyTorch
17 10 (1.62%) Spring Boot
Miscellaneous
1 90 (14.56%) Fixed Income
2 32 (5.18%) Hedge funds
3 28 (4.53%) Cloud Native
4 24 (3.88%) Equities
5 23 (3.72%) Public Cloud
6 22 (3.56%) Foreign Exchange (FX)
7 20 (3.24%) Hybrid Cloud
8 18 (2.91%) Derivative
9 17 (2.75%) Management Information System
10 15 (2.43%) Legacy Systems
11 13 (2.10%) Data Structures
12 12 (1.94%) IoT
13 11 (1.78%) Distributed Systems
14 9 (1.46%) Enterprise Software
14 9 (1.46%) Greenfield Project
14 9 (1.46%) Product Ownership
15 7 (1.13%) Data Protection Act
16 6 (0.97%) Clustering
16 6 (0.97%) Virtual Team
17 5 (0.81%) Enterprise Cloud
Operating Systems
1 50 (8.09%) Linux
2 27 (4.37%) Windows
3 10 (1.62%) Windows Server
4 8 (1.29%) Red Hat Enterprise Linux
4 8 (1.29%) Unix
5 7 (1.13%) Rocky
6 6 (0.97%) Solaris
7 3 (0.49%) CentOS
8 2 (0.32%) Apple iOS
8 2 (0.32%) Oracle Linux
8 2 (0.32%) Ubuntu
9 1 (0.16%) AIX
9 1 (0.16%) Android
9 1 (0.16%) Data ONTAP
9 1 (0.16%) VMS
9 1 (0.16%) Windows 10
Processes & Methodologies
1 181 (29.29%) Agile
1 181 (29.29%) DevOps
2 155 (25.08%) Software Engineering
3 148 (23.95%) CI/CD
4 111 (17.96%) Problem-Solving
5 104 (16.83%) Asset Management
6 97 (15.70%) Analytics
7 87 (14.08%) Fintech
8 83 (13.43%) Investment Management
9 82 (13.27%) Migration
10 81 (13.11%) Containerisation
11 79 (12.78%) Infrastructure as Code
12 66 (10.68%) Data Engineering
13 65 (10.52%) ETL
14 64 (10.36%) Artificial Intelligence
14 64 (10.36%) Data Modelling
15 60 (9.71%) Data Pipeline
16 55 (8.90%) Microservices
17 54 (8.74%) Cloud Security
17 54 (8.74%) Machine Learning
Programming Languages
1 314 (50.81%) Python
2 147 (23.79%) Java
3 115 (18.61%) JavaScript
4 98 (15.86%) SQL
5 94 (15.21%) TypeScript
6 39 (6.31%) Bash
7 38 (6.15%) Go
8 31 (5.02%) PowerShell
9 15 (2.43%) Scala
10 11 (1.78%) C#
11 9 (1.46%) C++
12 8 (1.29%) C
12 8 (1.29%) R
13 7 (1.13%) Bicep
13 7 (1.13%) Perl
13 7 (1.13%) T-SQL
14 6 (0.97%) Shell Script
15 5 (0.81%) Ruby
15 5 (0.81%) Rust
16 4 (0.65%) Kotlin
Qualifications
1 53 (8.58%) Security Cleared
2 43 (6.96%) Degree
3 37 (5.99%) SC Cleared
4 25 (4.05%) Computer Science Degree
5 20 (3.24%) AWS Certification
5 20 (3.24%) Azure Certification
6 15 (2.43%) DV Cleared
7 14 (2.27%) CISSP
8 10 (1.62%) Master's Degree
9 9 (1.46%) CEH
10 8 (1.29%) Cisco Certification
11 6 (0.97%) AWS Certified Solutions Architect
11 6 (0.97%) CISM
12 5 (0.81%) CCNA
12 5 (0.81%) CompTIA Security+
12 5 (0.81%) CRISC
12 5 (0.81%) OSCP
13 4 (0.65%) CCSP
13 4 (0.65%) Microsoft Certification
14 3 (0.49%) CCNP
Quality Assurance & Compliance
1 30 (4.85%) Data Quality
2 29 (4.69%) QA
3 28 (4.53%) GDPR
4 26 (4.21%) NIST
5 18 (2.91%) ISO/IEC 27001
6 13 (2.10%) PCI DSS
7 10 (1.62%) HIPAA
8 8 (1.29%) Accessibility
9 5 (0.81%) GRC
10 4 (0.65%) Sarbanes-Oxley
10 4 (0.65%) SOC 2
11 3 (0.49%) Actionable Recommendations
12 2 (0.32%) COBIT
12 2 (0.32%) ISO/IEC 27005
12 2 (0.32%) NCSC
12 2 (0.32%) NIST 800
13 1 (0.16%) FedRAMP
13 1 (0.16%) ISO 22301
13 1 (0.16%) PMO
13 1 (0.16%) SLA
System Software
1 102 (16.50%) Docker
2 18 (2.91%) Active Directory
3 11 (1.78%) Virtual Machines
4 10 (1.62%) VMware Infrastructure
5 6 (0.97%) Lustre
6 5 (0.81%) VMware NSX
7 4 (0.65%) VMware ESXi
8 3 (0.49%) NFS
9 2 (0.32%) Hyper-V
9 2 (0.32%) Veritas File System
9 2 (0.32%) Veritas Volume Manager
10 1 (0.16%) HDFS
10 1 (0.16%) Oracle RAC
10 1 (0.16%) vSphere
Systems Management
1 148 (23.95%) Kubernetes
2 118 (19.09%) Terraform
3 69 (11.17%) Ansible
4 21 (3.40%) Grafana
5 18 (2.91%) Prometheus
6 12 (1.94%) Puppet
7 7 (1.13%) Microsoft Intune
7 7 (1.13%) Progress Chef
8 6 (0.97%) Karpenter
8 6 (0.97%) Podman
8 6 (0.97%) QRadar
8 6 (0.97%) Single Sign-On
9 5 (0.81%) Argo
9 5 (0.81%) Kibana
9 5 (0.81%) Kubeflow
9 5 (0.81%) Nagios
9 5 (0.81%) Red Hat Satellite
10 4 (0.65%) logstash
10 4 (0.65%) Tivoli
10 4 (0.65%) vRealize
Vendors
1 195 (31.55%) Google
2 45 (7.28%) Microsoft
3 28 (4.53%) Oracle
4 23 (3.72%) Splunk
5 18 (2.91%) Databricks
5 18 (2.91%) IBM
5 18 (2.91%) Red Hat
6 17 (2.75%) VMware
7 11 (1.78%) CyberArk
7 11 (1.78%) Salesforce
8 9 (1.46%) Adobe
8 9 (1.46%) SAP
9 8 (1.29%) ServiceNow
10 6 (0.97%) Cisco
10 6 (0.97%) Sitecore
11 5 (0.81%) New Relic
11 5 (0.81%) Palo Alto
11 5 (0.81%) Qualys
11 5 (0.81%) SolarWinds
12 4 (0.65%) BeyondTrust