Architectural Design Jobs in England

Architectural Design
UK > England

The table below provides summary statistics for permanent job vacancies advertised in England requiring Architectural Design skills. It includes a benchmarking guide to the annual salaries offered in vacancies that cited Architectural Design over the 6 months leading up to 30 May 2025, comparing them to the same period in the previous two years.

6 months to
30 May 2025
Same period 2024 Same period 2023
Rank 311 430 316
Rank change year-on-year +119 -114 +20
Permanent jobs citing Architectural Design 491 479 923
As % of all permanent jobs advertised in England 1.00% 0.54% 1.07%
As % of the Processes & Methodologies category 1.07% 0.64% 1.12%
Number of salaries quoted 210 360 390
10th Percentile £41,000 £48,750 £52,500
25th Percentile £60,000 £60,000 £63,631
Median annual salary (50th Percentile) £80,000 £79,932 £77,500
Median % change year-on-year +0.09% +3.14% -3.13%
75th Percentile £91,875 £97,500 £95,000
90th Percentile £107,500 £115,000 £115,000
UK median annual salary £80,000 £79,932 £75,000
% change year-on-year +0.09% +6.58% -

All Process and Methodology Skills
England

Architectural Design falls under the Processes and Methodologies category. For comparison with the information above, the following table provides summary statistics for all permanent job vacancies requiring process or methodology skills in England.

Permanent vacancies with a requirement for process or methodology skills 46,039 75,199 82,570
As % of all permanent jobs advertised in England 94.03% 84.05% 95.58%
Number of salaries quoted 22,875 54,702 49,146
10th Percentile £29,500 £29,000 £34,452
25th Percentile £41,250 £40,000 £46,000
Median annual salary (50th Percentile) £57,500 £55,000 £62,500
Median % change year-on-year +4.55% -12.00% +4.17%
75th Percentile £75,000 £72,500 £82,500
90th Percentile £97,528 £93,750 £102,500
UK median annual salary £57,443 £55,000 £60,899
% change year-on-year +4.44% -9.69% +1.50%

Architectural Design
Job Vacancy Trend in England

Job postings citing Architectural Design as a proportion of all IT jobs advertised in England.
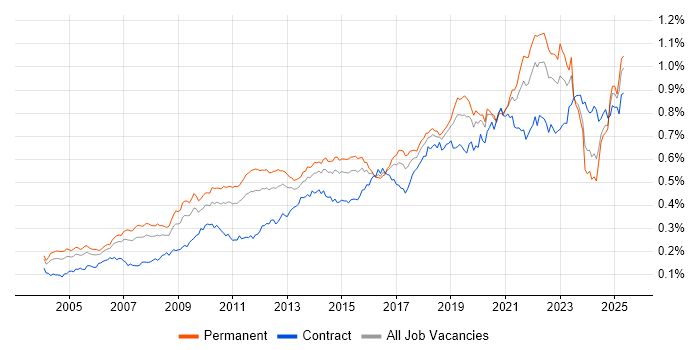
Job vacancy trend for Architectural Design in England

Architectural Design
Salary Trend in England

3-month moving average salary quoted in jobs citing Architectural Design in England.

Salary trend for Architectural Design in England

Architectural Design
Salary Histogram in England

Salary distribution for jobs citing Architectural Design in England over the 6 months to 30 May 2025.

Salary histogram for Architectural Design in England

Architectural Design
Job Locations in England

The table below looks at the demand and provides a guide to the median salaries quoted in IT jobs citing Architectural Design within the England region over the 6 months to 30 May 2025. The 'Rank Change' column provides an indication of the change in demand within each location based on the same 6 month period last year.

Location Rank Change
on Same Period
Last Year
Matching
Permanent
IT Job Ads
Median Salary
Past 6 Months
Median Salary
% Change
on Same Period
Last Year
Live
Jobs
North of England +93 177 £41,000 -48.71% 127
North West +73 177 £41,000 -36.92% 50
London +57 133 £85,000 -10.53% 114
South East +152 118 £80,000 +60.00% 235
South West +81 26 £115,000 +107.21% 80
East of England +40 19 £65,000 -23.53% 97
Midlands +63 15 £57,500 -26.54% 127
West Midlands +39 14 £57,500 -26.54% 69
East Midlands +42 1 £90,000 +14.98% 49
Architectural Design
UK

Architectural Design
Co-occurring Skills and Capabilities in England by Category

The follow tables expand on the table above by listing co-occurrences grouped by category. The same employment type, locality and period is covered with up to 20 co-occurrences shown in each of the following categories:

Application Platforms
1 12 (2.44%) SharePoint
2 5 (1.02%) Apache
2 5 (1.02%) Apache Airflow
2 5 (1.02%) CMS
3 4 (0.81%) Apache Spark
3 4 (0.81%) Confluence
3 4 (0.81%) Microsoft Exchange
4 2 (0.41%) Exchange Server 2007
4 2 (0.41%) Exchange Server 2010
4 2 (0.41%) Exchange Server 2013
4 2 (0.41%) Office Communications Server
4 2 (0.41%) SharePoint Server
4 2 (0.41%) Skype for Business
Applications
1 3 (0.61%) Microsoft Office
2 2 (0.41%) Adobe XD
2 2 (0.41%) MS Visio
2 2 (0.41%) Sketch
Business Applications
1 1 (0.20%) Aladdin
1 1 (0.20%) Dynamics CRM
1 1 (0.20%) Oracle ERP
1 1 (0.20%) Oracle Retail
1 1 (0.20%) Payment Gateway
1 1 (0.20%) SAP FI
Cloud Services
1 86 (17.52%) Azure
2 85 (17.31%) AWS
3 51 (10.39%) GCP
4 33 (6.72%) Serverless
5 20 (4.07%) SaaS
6 17 (3.46%) AWS CloudFormation
7 16 (3.26%) Amazon ECS
8 14 (2.85%) AWS Lambda
8 14 (2.85%) Cloud Computing
8 14 (2.85%) Salsify
9 12 (2.44%) Amazon EKS
9 12 (2.44%) PaaS
10 11 (2.24%) AWS KMS
10 11 (2.24%) Microsoft 365
11 8 (1.63%) Amazon EC2
12 7 (1.43%) Azure DevOps
13 6 (1.22%) Entra ID
13 6 (1.22%) npm
14 5 (1.02%) Snowflake
15 4 (0.81%) Amazon ECR
Communications & Networking
1 21 (4.28%) Network Security
2 11 (2.24%) Firewall
2 11 (2.24%) HTTP
3 10 (2.04%) DHCP
3 10 (2.04%) DNS
4 5 (1.02%) NAS
4 5 (1.02%) SAN
4 5 (1.02%) VPN
4 5 (1.02%) VSAN
5 4 (0.81%) Cisco ASA
5 4 (0.81%) Cisco Firepower
5 4 (0.81%) MPLS
5 4 (0.81%) PBX
5 4 (0.81%) Reverse Proxy
5 4 (0.81%) VPLS
6 2 (0.41%) SNMP
6 2 (0.41%) WAN
7 1 (0.20%) Broadband
7 1 (0.20%) Ethernet
7 1 (0.20%) TCP/IP
Database & Business Intelligence
1 50 (10.18%) SQL Server
2 23 (4.68%) PostgreSQL
3 18 (3.67%) Metadata
3 18 (3.67%) NoSQL
4 13 (2.65%) Relational Database
5 11 (2.24%) RDBMS
6 9 (1.83%) MySQL
7 7 (1.43%) MongoDB
8 6 (1.22%) Elasticsearch
9 4 (0.81%) Tableau
10 3 (0.61%) Oracle Database
10 3 (0.61%) Redis
11 2 (0.41%) Amazon Redshift
11 2 (0.41%) Apache Cassandra
11 2 (0.41%) Big Data
11 2 (0.41%) Cloud Spanner
11 2 (0.41%) Data Warehouse
11 2 (0.41%) InterSystems Cache
11 2 (0.41%) Power BI
12 1 (0.20%) Amazon Aurora
Development Applications
1 26 (5.30%) Git
2 17 (3.46%) JIRA
3 16 (3.26%) Jenkins
4 13 (2.65%) JUnit
4 13 (2.65%) Mockito
5 11 (2.24%) PowerBuilder
6 8 (1.63%) JMeter
7 6 (1.22%) Cucumber
7 6 (1.22%) Cypress.io
7 6 (1.22%) Oracle Forms
7 6 (1.22%) Sonatype Nexus
7 6 (1.22%) webpack
8 5 (1.02%) GitLab
9 4 (0.81%) Vite
10 3 (0.61%) CircleCI
10 3 (0.61%) Postman
10 3 (0.61%) REST Assured
10 3 (0.61%) SoapUI
10 3 (0.61%) SonarQube
10 3 (0.61%) XCTest
General
1 125 (25.46%) Telecoms
2 124 (25.25%) Automotive
3 123 (25.05%) Finance
4 109 (22.20%) Social Skills
5 66 (13.44%) Electronics
6 49 (9.98%) Law
7 47 (9.57%) Banking
8 44 (8.96%) Inclusion and Diversity
9 34 (6.92%) Analytical Skills
10 27 (5.50%) Marketing
11 19 (3.87%) Legal
11 19 (3.87%) Public Sector
12 13 (2.65%) Games
13 12 (2.44%) Retail
14 10 (2.04%) Presentation Skills
15 9 (1.83%) Influencing Skills
16 8 (1.63%) Tech for Good
17 4 (0.81%) Aerospace
17 4 (0.81%) Manufacturing
18 3 (0.61%) Financial Institution
Job Titles
1 122 (24.85%) Principal Engineer
2 121 (24.64%) Principal Systems Engineer
3 103 (20.98%) Architect
4 71 (14.46%) Senior
5 69 (14.05%) Lead
6 53 (10.79%) Developer
7 44 (8.96%) Software Engineer
8 41 (8.35%) Systems Engineer
9 35 (7.13%) Solutions Architect
10 33 (6.72%) Software Developer
11 27 (5.50%) Lead Software Engineer
12 24 (4.89%) Senior Architect
13 22 (4.48%) AWS Architect
14 18 (3.67%) Technical Leader
15 16 (3.26%) Cloud Architect
15 16 (3.26%) Lead Architect
16 15 (3.05%) Cloud Engineer
16 15 (3.05%) Java Engineer
16 15 (3.05%) Senior DevOps
17 14 (2.85%) Senior Solutions Architect
Libraries, Frameworks & Software Standards
1 37 (7.54%) .NET
1 37 (7.54%) React
2 34 (6.92%) Kafka
3 31 (6.31%) REST
3 31 (6.31%) Spring Boot
4 27 (5.50%) Spring
5 21 (4.28%) Web Services
6 17 (3.46%) RESTful
7 14 (2.85%) AngularJS
7 14 (2.85%) Hibernate
7 14 (2.85%) HTML
7 14 (2.85%) Node.js
7 14 (2.85%) SOAP
8 13 (2.65%) Elastic Stack
9 11 (2.24%) GraphQL
10 10 (2.04%) Jest
10 10 (2.04%) Middleware
11 9 (1.83%) ActiveMQ
12 8 (1.63%) jQuery
12 8 (1.63%) WireMock
Miscellaneous
1 79 (16.09%) Management Information System
2 61 (12.42%) Cloud Native
3 53 (10.79%) Algorithms
4 17 (3.46%) Distributed Systems
5 14 (2.85%) Legacy Systems
5 14 (2.85%) Product Ownership
5 14 (2.85%) Public Cloud
5 14 (2.85%) Taxonomies
6 13 (2.65%) Greenfield Project
7 12 (2.44%) Reinsurance
8 11 (2.24%) Mobile App
9 8 (1.63%) Enterprise Software
10 7 (1.43%) Virtual Team
11 6 (1.22%) Distributed Applications
11 6 (1.22%) Hybrid Cloud
12 5 (1.02%) Derivative
12 5 (1.02%) Life Science
12 5 (1.02%) Mobile Games
13 4 (0.81%) CSOC
14 3 (0.61%) Distributed Computing
Operating Systems
1 17 (3.46%) Windows
2 11 (2.24%) Apple iOS
2 11 (2.24%) Linux
3 6 (1.22%) Unix
4 4 (0.81%) Android
4 4 (0.81%) CentOS
5 2 (0.41%) Windows Server 2003
Processes & Methodologies
1 185 (37.68%) Agile
2 171 (34.83%) Systems Engineering
3 120 (24.44%) Model-Based Systems Engineering
4 112 (22.81%) CI/CD
5 107 (21.79%) Software Engineering
6 101 (20.57%) Problem-Solving
7 91 (18.53%) Technical Leadership
8 81 (16.50%) Roadmaps
9 80 (16.29%) Microservices
10 76 (15.48%) DevOps
10 76 (15.48%) Mentoring
11 61 (12.42%) Artificial Intelligence
12 53 (10.79%) Containerisation
13 48 (9.78%) Signal Processing
14 46 (9.37%) Architectural Patterns
14 46 (9.37%) SDLC
15 44 (8.96%) Machine Learning
16 43 (8.76%) ITIL
17 40 (8.15%) Computer Science
18 39 (7.94%) Migration
Programming Languages
1 104 (21.18%) Java
2 67 (13.65%) Python
3 60 (12.22%) C#
4 49 (9.98%) JavaScript
5 48 (9.78%) SQL
6 22 (4.48%) TypeScript
7 12 (2.44%) PowerShell
7 12 (2.44%) Shell Script
8 8 (1.63%) Ruby
9 6 (1.22%) Bash
9 6 (1.22%) Go
10 5 (1.02%) Bicep
10 5 (1.02%) Kotlin
10 5 (1.02%) Swift
11 4 (0.81%) Groovy
12 3 (0.61%) Apex Code
12 3 (0.61%) Lua
12 3 (0.61%) Scala
13 2 (0.41%) C
13 2 (0.41%) C++
Qualifications
1 187 (38.09%) Degree
2 50 (10.18%) BPSS Clearance
3 42 (8.55%) Security Cleared
4 35 (7.13%) SC Cleared
5 30 (6.11%) Computer Science Degree
6 27 (5.50%) AWS Certification
6 27 (5.50%) AWS Certified Solutions Architect
7 22 (4.48%) Azure Certification
8 14 (2.85%) Microsoft Certification
9 7 (1.43%) Master's Degree
9 7 (1.43%) TOGAF Certification
10 6 (1.22%) DV Cleared
11 5 (1.02%) CCNP
11 5 (1.02%) Cisco Certification
11 5 (1.02%) VMware Certified Professional (VCP)
12 4 (0.81%) CCNA
13 3 (0.61%) PhD
14 2 (0.41%) CEH
14 2 (0.41%) CISM
14 2 (0.41%) CISSP
Quality Assurance & Compliance
1 48 (9.78%) ISO/IEC 15288
2 39 (7.94%) GDPR
3 26 (5.30%) HIPAA
4 21 (4.28%) Data Quality
5 14 (2.85%) ISO/IEC 27001
6 12 (2.44%) NIST
7 11 (2.24%) QA
8 6 (1.22%) California Consumer Privacy Act
8 6 (1.22%) SOC 2
9 5 (1.02%) Accessibility
10 4 (0.81%) COBIT
10 4 (0.81%) PCI DSS
11 3 (0.61%) Def Stans
11 3 (0.61%) IEC 61508
12 1 (0.20%) NIST 800
System Software
1 68 (13.85%) Docker
2 11 (2.24%) Active Directory
3 7 (1.43%) VMware NSX
4 6 (1.22%) Virtual Desktop
4 6 (1.22%) Virtual Machines
4 6 (1.22%) VMware Infrastructure
5 2 (0.41%) Firmware
5 2 (0.41%) ISA Server
5 2 (0.41%) KVM
5 2 (0.41%) VMware ESXi
5 2 (0.41%) Xen
Systems Management
1 77 (15.68%) Kubernetes
2 37 (7.54%) Terraform
3 22 (4.48%) Grafana
4 18 (3.67%) Prometheus
5 10 (2.04%) Progress Chef
6 8 (1.63%) Ansible
6 8 (1.63%) Kibana
7 6 (1.22%) Microsoft Intune
8 5 (1.02%) Argo
8 5 (1.02%) Puppet
9 4 (0.81%) Nagios
10 3 (0.61%) Consul
10 3 (0.61%) Istio
10 3 (0.61%) QRadar
11 2 (0.41%) CFEngine
12 1 (0.20%) CSIRT
12 1 (0.20%) MOM
Vendors
1 59 (12.02%) Microsoft
2 42 (8.55%) Oracle
3 28 (5.70%) Google
4 18 (3.67%) VMware
5 15 (3.05%) Splunk
6 11 (2.24%) Dynatrace
7 10 (2.04%) Citrix
8 7 (1.43%) Apple
8 7 (1.43%) Cisco
9 6 (1.22%) Databricks
10 5 (1.02%) Meraki
10 5 (1.02%) MuleSoft
10 5 (1.02%) Salesforce
11 4 (0.81%) Fortinet
11 4 (0.81%) HP
11 4 (0.81%) Rapid7
11 4 (0.81%) Red Hat
11 4 (0.81%) SAP
11 4 (0.81%) SolarWinds
12 3 (0.61%) ServiceNow