
Zero Trust Job Trends in England

Zero Trust
UK > England

The table below provides summary statistics and salary benchmarking for jobs advertised in England requiring Zero Trust skills. It covers permanent job vacancies from the 6 months leading up to 9 October 2026, with comparisons to the same periods in the previous two years.

6 months to
9 Oct 2026
Same period 2025 Same period 2024
Rank 386 523 659
Rank change year-on-year +137 +136 -111
Permanent jobs citing Zero Trust 450 111 74
As % of all permanent jobs in England 0.43% 0.26% 0.11%
As % of the Processes & Methodologies category 0.59% 0.29% 0.14%
Number of salaries quoted 269 83 30
10th Percentile £53,950 £43,548 £54,500
25th Percentile £70,000 £57,500 £66,250
Median annual salary (50th Percentile) £85,000 £75,000 £78,750
Median % change year-on-year +13.33% -4.76% -1.11%
75th Percentile £105,000 £92,500 £96,875
90th Percentile £120,000 £99,500 £102,500
UK median annual salary £85,000 £73,159 £83,750
% change year-on-year +16.19% -12.65% +5.17%

All Process & Methodology Skills
England

Zero Trust falls under the Processes and Methodologies category. For comparison with the information above, the following table provides summary statistics for all permanent job vacancies requiring process or methodology skills in England.

Permanent vacancies with a requirement for process or methodology skills 76,345 38,619 53,704
As % of all permanent jobs advertised in England 73.62% 89.01% 82.66%
Number of salaries quoted 53,555 21,921 28,813
10th Percentile £31,250 £28,500 £32,500
25th Percentile £41,681 £36,250 £43,750
Median annual salary (50th Percentile) £60,000 £55,000 £60,000
Median % change year-on-year +9.09% -8.33% -1.64%
75th Percentile £80,000 £75,250 £78,750
90th Percentile £100,000 £97,500 £97,500
UK median annual salary £60,000 £55,000 £60,000
% change year-on-year +9.09% -8.33% -

Zero Trust
Job Vacancy Trend in England

Historical trend showing the proportion of permanent IT job postings citing Zero Trust relative to all permanent IT jobs advertised in England.
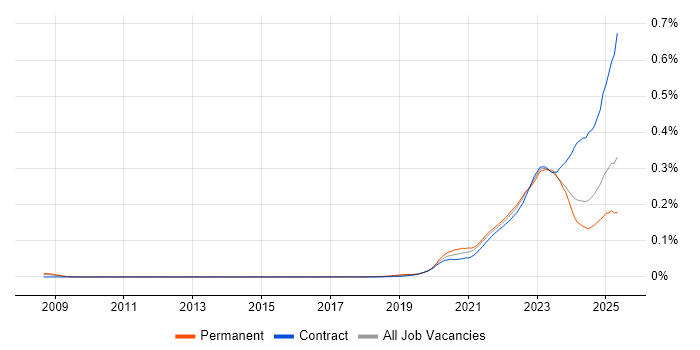
Zero Trust job vacancy trend in England

Zero Trust
Salary Trend in England

Salary distribution trend for jobs in England citing Zero Trust.
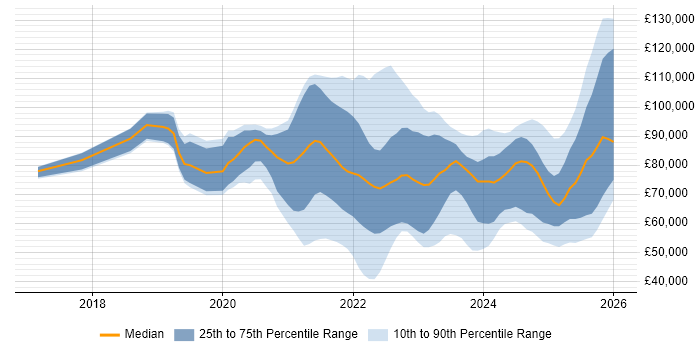
Salary distribution trend for jobs in England citing Zero Trust

Zero Trust
Salary Histogram in England

Salary distribution for jobs citing Zero Trust in England over the 6 months to 9 October 2026.

Salary histogram for Zero Trust in England

Zero Trust
Job Locations in England

The table below looks at the demand and provides a guide to the median salaries quoted in IT jobs citing Zero Trust within the England region over the 6 months to 9 October 2026. The 'Rank Change' column provides an indication of the change in demand within each location based on the same 6 month period last year.

Location Rank Change
on Same Period
Last Year
Matching
Permanent
IT Job Ads
Median Salary
Past 6 Months
Median Salary
% Change
on Same Period
Last Year
Live
Jobs
London +105 262 £90,000 +12.50% 326
South East +7 67 £62,500 +33.58% 49
North of England -55 35 £77,500 +29.17% 51
South West -47 34 £100,000 +17.65% 33
North West -9 29 £72,500 +20.83% 37
Midlands -21 29 £77,500 -10.92% 27
West Midlands -22 23 £100,000 +14.94% 19
East of England -37 8 £55,000 +17.02% 12
East Midlands -29 6 £75,000 - 8
North East - 4 £95,000 - 1
Yorkshire -35 2 - - 13
Zero Trust
UK

Zero Trust
Co-Occurring Skills & Capabilities in England by Category

The following tables expand on the one above by listing co-occurrences grouped by category. They cover the same employment type, locality and period, with up to 20 co-occurrences shown in each category:

Application Platforms
1 25 (5.56%) Microsoft Exchange
2 22 (4.89%) SharePoint
3 5 (1.11%) Confluence
4 1 (0.22%) Apache
Applications
1 1 (0.22%) PlantUML
Business Applications
1 1 (0.22%) FLEXCUBE
1 1 (0.22%) Sparx Enterprise Architect
Cloud Services
1 238 (52.89%) Azure
2 144 (32.00%) AWS
3 142 (31.56%) Entra ID
4 90 (20.00%) Microsoft 365
5 61 (13.56%) GCP
6 39 (8.67%) SaaS
7 38 (8.44%) GitHub
8 30 (6.67%) Azure Sentinel
9 26 (5.78%) Microsoft Purview
10 22 (4.89%) IaaS
10 22 (4.89%) PaaS
11 21 (4.67%) GitHub Actions
12 19 (4.22%) OCI
13 18 (4.00%) Azure DevOps
13 18 (4.00%) OpenShift
14 15 (3.33%) Azure Logic Apps
14 15 (3.33%) Azure Monitor
15 13 (2.89%) Azure API Management
15 13 (2.89%) Cloudflare
16 12 (2.67%) AWS CloudFormation
Communications & Networking
1 145 (32.22%) Firewall
2 118 (26.22%) Network Security
3 77 (17.11%) VPN
4 60 (13.33%) WAN
5 41 (9.11%) DNS
6 40 (8.89%) SD-WAN
7 34 (7.56%) BGP
8 32 (7.11%) LAN
9 29 (6.44%) VLAN
10 28 (6.22%) VXLAN
11 25 (5.56%) OSPF
12 22 (4.89%) Cisco ISE
12 22 (4.89%) TCP/IP
13 18 (4.00%) Kerberos
14 17 (3.78%) DHCP
14 17 (3.78%) Software-Defined Networking
15 16 (3.56%) Wireless
16 14 (3.11%) MPLS
17 12 (2.67%) Internet
18 10 (2.22%) Cisco Firepower
Database & Business Intelligence
1 9 (2.00%) PostgreSQL
2 5 (1.11%) Big Data
2 5 (1.11%) Redis
3 4 (0.89%) Flink
3 4 (0.89%) Power BI
4 3 (0.67%) Amazon RDS
4 3 (0.67%) SQL Server
5 2 (0.44%) Amazon Aurora
5 2 (0.44%) Azure SQL Database
6 1 (0.22%) DynamoDB
6 1 (0.22%) Electronic Patient Records
6 1 (0.22%) NoSQL
Development Applications
1 20 (4.44%) GitLab
2 12 (2.67%) TeamCity
3 11 (2.44%) Jenkins
4 8 (1.78%) Git
5 5 (1.11%) JIRA
6 2 (0.44%) Gradle
6 2 (0.44%) JUnit
6 2 (0.44%) Mockito
6 2 (0.44%) Sonatype Nexus
7 1 (0.22%) Maven
7 1 (0.22%) SonarQube
General
1 131 (29.11%) Social Skills
2 99 (22.00%) Finance
3 34 (7.56%) Analytical Skills
4 33 (7.33%) Public Sector
5 32 (7.11%) Law
6 31 (6.89%) Aerospace
7 30 (6.67%) Legal
8 27 (6.00%) Banking
9 21 (4.67%) Retail
10 17 (3.78%) Influencing Skills
11 16 (3.56%) Inclusion and Diversity
12 10 (2.22%) Documentation Skills
12 10 (2.22%) Presentation Skills
13 9 (2.00%) Financial Institution
14 6 (1.33%) Investment Banking
14 6 (1.33%) Police
15 5 (1.11%) Military
16 4 (0.89%) Italian Language
16 4 (0.89%) Japanese Language
16 4 (0.89%) Telecoms
Job Titles
1 162 (36.00%) Architect
2 73 (16.22%) Security Architect
3 72 (16.00%) Senior
4 51 (11.33%) Lead
5 50 (11.11%) Consultant
6 47 (10.44%) Security Engineer
7 33 (7.33%) Network Engineer
8 27 (6.00%) Cloud Engineer
9 26 (5.78%) Infrastructure Engineer
9 26 (5.78%) Security Consultant
10 25 (5.56%) Network Architect
10 25 (5.56%) Senior Architect
11 23 (5.11%) Security Specialist
12 19 (4.22%) Network Specialist
13 18 (4.00%) Network Security Specialist
14 17 (3.78%) DevOps Engineer
15 15 (3.33%) Cybersecurity Engineer
15 15 (3.33%) Solutions Architect
16 14 (3.11%) Senior Network Specialist
16 14 (3.11%) Senior Security Architect
Libraries, Frameworks & Software Standards
1 78 (17.33%) Terraform
2 39 (8.67%) OpenID
3 38 (8.44%) OAuth
4 36 (8.00%) LDAP
4 36 (8.00%) SAML
5 26 (5.78%) REST
6 20 (4.44%) ModSecurity
7 12 (2.67%) RESTful
8 9 (2.00%) Kafka
8 9 (2.00%) OAuth2
9 8 (1.78%) eBPF
9 8 (1.78%) Pulumi
10 5 (1.11%) JWT
10 5 (1.11%) SailPoint
11 4 (0.89%) Middleware
12 3 (0.67%) Microsoft Graph
12 3 (0.67%) OpenAPI
12 3 (0.67%) OpenTelemetry
12 3 (0.67%) Swagger
13 2 (0.44%) XML
Miscellaneous
1 55 (12.22%) Cloud Native
2 54 (12.00%) Hybrid Cloud
3 53 (11.78%) Security Posture
4 50 (11.11%) Data Centre
5 40 (8.89%) Enterprise Software
6 39 (8.67%) PKI
7 21 (4.67%) Onboarding
8 17 (3.78%) Distributed Denial-of-Service
9 13 (2.89%) Cyber Threat
9 13 (2.89%) Social Media
10 12 (2.67%) Public Cloud
11 11 (2.44%) Cloud Security Posture
11 11 (2.44%) Management Information System
11 11 (2.44%) Private Cloud
12 10 (2.22%) Blog
13 7 (1.56%) Cyber Defence
13 7 (1.56%) Product Ownership
14 6 (1.33%) AI Agents
14 6 (1.33%) Cyber Kill Chain
14 6 (1.33%) Security Operations Centre
Operating Systems
1 52 (11.56%) Windows
2 25 (5.56%) Linux
3 13 (2.89%) Windows Server
4 12 (2.67%) Mac OS
5 5 (1.11%) Android
5 5 (1.11%) Windows 10
6 3 (0.67%) Apple iOS
7 2 (0.44%) CentOS
7 2 (0.44%) Ubuntu
7 2 (0.44%) Unix
Processes & Methodologies
1 153 (34.00%) Cybersecurity
2 130 (28.89%) Cloud Security
3 117 (26.00%) Identity Access Management
4 112 (24.89%) Security Architecture
5 110 (24.44%) Infrastructure as Code
6 99 (22.00%) Roadmaps
7 78 (17.33%) AI
8 77 (17.11%) Continuous Improvement
9 71 (15.78%) Incident Response
10 70 (15.56%) Stakeholder Management
11 69 (15.33%) RBAC
12 64 (14.22%) Technical Leadership
12 64 (14.22%) Vulnerability Management
13 63 (14.00%) Mentoring
14 60 (13.33%) CI/CD
15 59 (13.11%) SIEM
16 56 (12.44%) Security Operations
17 55 (12.22%) Architectural Patterns
18 54 (12.00%) Data Protection
18 54 (12.00%) Network Segmentation
Programming Languages
1 94 (20.89%) PowerShell
2 57 (12.67%) Python
3 29 (6.44%) Bash
4 18 (4.00%) Bicep
5 15 (3.33%) Go
5 15 (3.33%) SQL
6 10 (2.22%) Java
7 7 (1.56%) Kotlin
8 6 (1.33%) Kusto Query Language
9 5 (1.11%) Scala
10 3 (0.67%) Rust
11 2 (0.44%) C
11 2 (0.44%) C++
11 2 (0.44%) Ruby
11 2 (0.44%) Shell Script
12 1 (0.22%) Google Apps Script
12 1 (0.22%) Search Processing Language
Qualifications
1 141 (31.33%) Security Cleared
2 97 (21.56%) CISSP
3 69 (15.33%) SC Cleared
4 60 (13.33%) DV Cleared
5 54 (12.00%) Cisco Certification
5 54 (12.00%) CISM
6 52 (11.56%) Azure Certification
7 40 (8.89%) CCNP
8 32 (7.11%) AWS Certification
9 25 (5.56%) Microsoft Certification
10 23 (5.11%) Degree
11 16 (3.56%) TOGAF Certification
12 13 (2.89%) CCSP
12 13 (2.89%) Computer Science Degree
13 12 (2.67%) CCIE
14 11 (2.44%) (ISC)2 CCSP
15 10 (2.22%) CCNA
15 10 (2.22%) VMware Certified Professional (VCP)
16 8 (1.78%) BPSS Clearance
17 6 (1.33%) JNCIP
Quality Assurance & Compliance
1 104 (23.11%) ISO/IEC 27001
2 84 (18.67%) NIST
3 50 (11.11%) GDPR
4 29 (6.44%) GRC
4 29 (6.44%) PCI DSS
5 26 (5.78%) SOC 2
6 24 (5.33%) Cyber Essentials
6 24 (5.33%) NCSC
7 7 (1.56%) ISO/IEC 42001
8 6 (1.33%) JSP 440
8 6 (1.33%) NIST 800
9 4 (0.89%) ISO/IEC 27005
10 3 (0.67%) ISO 22301
10 3 (0.67%) Sarbanes-Oxley
11 2 (0.44%) PERC
11 2 (0.44%) QA
12 1 (0.22%) Accessibility
12 1 (0.22%) Cyber Essentials PLUS
12 1 (0.22%) PSD2
12 1 (0.22%) SEPA
System Software
1 90 (20.00%) Active Directory
2 25 (5.56%) Docker
2 25 (5.56%) VMware Infrastructure
3 10 (2.22%) VMware NSX
4 8 (1.78%) Hyper-V
4 8 (1.78%) KVM
5 4 (0.89%) Virtual Desktop
6 3 (0.67%) Virtual Machines
6 3 (0.67%) VMware ESXi
7 2 (0.44%) ProxySG
8 1 (0.22%) BitLocker
8 1 (0.22%) Firmware
8 1 (0.22%) vSphere
Systems Management
1 72 (16.00%) Single Sign-On
2 69 (15.33%) Kubernetes
3 40 (8.89%) Microsoft Intune
4 28 (6.22%) Ansible
5 17 (3.78%) CASB
5 17 (3.78%) Grafana
6 15 (3.33%) FortiGate
7 11 (2.44%) Prometheus
8 9 (2.00%) Argo
9 8 (1.78%) Cilium
9 8 (1.78%) Graylog
9 8 (1.78%) Proxmox
9 8 (1.78%) SCCM
9 8 (1.78%) ZABBIX
10 3 (0.67%) Progress Chef
10 3 (0.67%) Puppet
11 2 (0.44%) Nessus
12 1 (0.22%) Jamf Pro
12 1 (0.22%) Kibana
12 1 (0.22%) vRealize
Vendors
1 168 (37.33%) Microsoft
2 70 (15.56%) Palo Alto
3 64 (14.22%) Cisco
4 49 (10.89%) Zscaler
5 34 (7.56%) Fortinet
5 34 (7.56%) VMware
6 20 (4.44%) CrowdStrike
7 19 (4.22%) Okta
8 18 (4.00%) Google
9 14 (3.11%) ForgeRock
9 14 (3.11%) Meraki
10 13 (2.89%) Oracle
11 11 (2.44%) CheckPoint
11 11 (2.44%) Dynatrace
11 11 (2.44%) ServiceNow
12 10 (2.22%) CyberArk
12 10 (2.22%) Veeam
13 8 (1.78%) Atlassian
13 8 (1.78%) Citrix
14 7 (1.56%) Foundry