Retail Jobs in London

Retailing
England > London

The table below looks at the prevalence of the term Retail in permanent job vacancies in London. Included is a benchmarking guide to the salaries offered in vacancies that cited Retail over the 6 months leading up to 12 May 2025, comparing them to the same period in the previous two years.

6 months to
12 May 2025
Same period 2024 Same period 2023
Rank 77 48 49
Rank change year-on-year -29 +1 +13
Permanent jobs citing Retail 519 1,178 2,003
As % of all permanent jobs advertised in London 4.01% 4.98% 5.85%
As % of the General category 5.25% 7.36% 8.51%
Number of salaries quoted 294 561 1,129
10th Percentile £40,000 £35,000 £40,500
25th Percentile £50,750 £44,500 £52,500
Median annual salary (50th Percentile) £67,500 £62,500 £67,500
Median % change year-on-year +8.00% -7.41% -
75th Percentile £92,500 £85,000 £85,000
90th Percentile £115,000 £97,500 £99,000
England median annual salary £55,000 £47,500 £60,000
% change year-on-year +15.79% -20.83% +4.35%

All General Skills
London

Retail falls under the General Skills category. For comparison with the information above, the following table provides summary statistics for all permanent job vacancies requiring common skills in London.

Permanent vacancies with a requirement for common skills 9,883 16,012 23,542
As % of all permanent jobs advertised in London 76.43% 67.74% 68.71%
Number of salaries quoted 5,527 11,382 16,269
10th Percentile £41,250 £36,250 £42,250
25th Percentile £56,250 £50,000 £54,500
Median annual salary (50th Percentile) £75,000 £70,000 £74,000
Median % change year-on-year +7.14% -5.41% +5.71%
75th Percentile £102,500 £95,000 £95,000
90th Percentile £125,000 £118,750 £120,000
England median annual salary £57,500 £52,500 £60,000
% change year-on-year +9.52% -12.50% -

Retail
Job Vacancy Trend in London

Job postings citing Retail as a proportion of all IT jobs advertised in London.
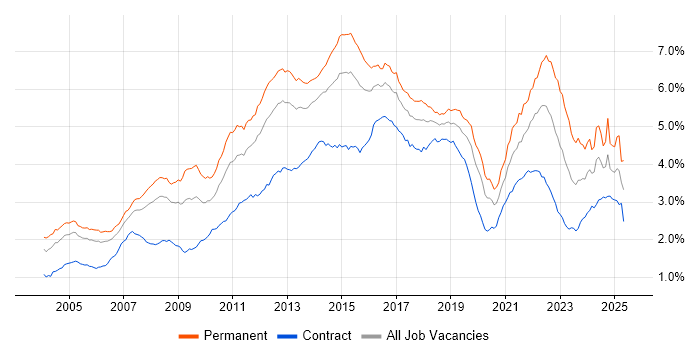
Job vacancy trend for Retail in London

Retail
Salary Trend in London

3-month moving average salary quoted in jobs citing Retail in London.

Salary trend for Retail in London

Retail
Salary Histogram in London

Salary distribution for jobs citing Retail in London over the 6 months to 12 May 2025.

Salary histogram for Retail in London

Retail
Job Locations in London

The table below looks at the demand and provides a guide to the median salaries quoted in IT jobs citing Retail within the London region over the 6 months to 12 May 2025. The 'Rank Change' column provides an indication of the change in demand within each location based on the same 6 month period last year.

Location Rank Change
on Same Period
Last Year
Matching
Permanent
IT Job Ads
Median Salary
Past 6 Months
Median Salary
% Change
on Same Period
Last Year
Live
Jobs
Central London +6 124 £65,000 +10.54% 75
West London +9 15 £58,750 +2.17% 43
South London -74 5 £75,625 +25.00% 34
North London -3 4 £55,000 +29.41% 7
East London -14 4 £62,818 +2.98% 10
Retail
England

Retail
Co-occurring Skills and Capabilities in London by Category

The follow tables expand on the table above by listing co-occurrences grouped by category. The same employment type, locality and period is covered with up to 20 co-occurrences shown in each of the following categories:

Application Platforms
1 21 (4.05%) Apache Spark
2 10 (1.93%) Microsoft Exchange
3 9 (1.73%) Confluence
4 7 (1.35%) CMS
5 6 (1.16%) Apache Airflow
6 4 (0.77%) WordPress
7 3 (0.58%) IIS
7 3 (0.58%) SAS
8 2 (0.39%) Apache
8 2 (0.39%) CoreMedia CMS
8 2 (0.39%) SharePoint
9 1 (0.19%) Adobe Experience Manager
9 1 (0.19%) OpenStack
Applications
1 23 (4.43%) Microsoft Excel
2 22 (4.24%) Microsoft Office
3 16 (3.08%) Maya
4 7 (1.35%) Adobe Creative Suite
4 7 (1.35%) Microsoft PowerPoint
5 6 (1.16%) CINEMA 4D
6 5 (0.96%) Blender
7 3 (0.58%) SOLIDWORKS
8 2 (0.39%) Adobe Illustrator
8 2 (0.39%) Microsoft Project
8 2 (0.39%) Photoshop
9 1 (0.19%) Adobe After Effects
9 1 (0.19%) Adobe XD
9 1 (0.19%) AutoCAD
9 1 (0.19%) Chatbot
9 1 (0.19%) InDesign
9 1 (0.19%) Revit
9 1 (0.19%) Stata
Business Applications
1 18 (3.47%) Dynamics CRM
2 12 (2.31%) Dynamics AX
3 4 (0.77%) Shopify
4 3 (0.58%) Dynamics NAV
4 3 (0.58%) SAP Business One
4 3 (0.58%) SAP CX
4 3 (0.58%) SAP Hybris
4 3 (0.58%) SAP S/4HANA
5 1 (0.19%) Dynamics GP
5 1 (0.19%) NetSuite
5 1 (0.19%) Oracle Retail
5 1 (0.19%) SAP CO
5 1 (0.19%) SAP ERP
5 1 (0.19%) SAP FI
5 1 (0.19%) SAP FI/CO
5 1 (0.19%) SAP MDG
Cloud Services
1 64 (12.33%) Azure
2 44 (8.48%) AWS
3 38 (7.32%) Power Platform
4 31 (5.97%) GCP
5 25 (4.82%) Dynamics 365
6 21 (4.05%) SaaS
7 20 (3.85%) Google Analytics
8 15 (2.89%) Microsoft 365
8 15 (2.89%) Salesforce Commerce Cloud
9 11 (2.12%) Boomi
10 10 (1.93%) Azure DevOps
10 10 (1.93%) GitHub
11 8 (1.54%) Snowflake
12 7 (1.35%) Azure Data Factory
12 7 (1.35%) PaaS
13 6 (1.16%) Azure Sentinel
13 6 (1.16%) DigitalOcean
14 5 (0.96%) Power Automate
14 5 (0.96%) PowerApps
15 4 (0.77%) Adobe Analytics
Communications & Networking
1 20 (3.85%) HTTP
2 18 (3.47%) Firewall
3 17 (3.28%) Network Security
4 10 (1.93%) DNS
5 9 (1.73%) DHCP
6 8 (1.54%) WAN
7 5 (0.96%) TCP/IP
7 5 (0.96%) VPN
7 5 (0.96%) Wireless
8 4 (0.77%) LAN
9 3 (0.58%) Cisco IOS
9 3 (0.58%) VLAN
10 2 (0.39%) Cisco ASA
10 2 (0.39%) Cisco Firepower
10 2 (0.39%) Cisco Nexus
10 2 (0.39%) Internet
10 2 (0.39%) SD-WAN
10 2 (0.39%) VSAN
11 1 (0.19%) MPLS
11 1 (0.19%) OSPF
Database & Business Intelligence
1 40 (7.71%) Tableau
2 27 (5.20%) Power BI
3 21 (4.05%) Data Lake
4 16 (3.08%) SQL Server
5 10 (1.93%) Data Warehouse
5 10 (1.93%) Power Query
6 7 (1.35%) Azure SQL Database
7 6 (1.16%) Azure SQL Data Warehouse
7 6 (1.16%) Big Data
7 6 (1.16%) Data Mining
8 5 (0.96%) Looker
9 4 (0.77%) NoSQL
9 4 (0.77%) PowerPivot
10 3 (0.58%) BigQuery
10 3 (0.58%) Crystal Reports
11 2 (0.39%) MongoDB
11 2 (0.39%) Relational Database
12 1 (0.19%) Apache Cassandra
12 1 (0.19%) Geospatial Data
12 1 (0.19%) ThoughtSpot
Development Applications
1 35 (6.74%) Git
2 15 (2.89%) JIRA
3 6 (1.16%) GitLab
4 4 (0.77%) Bazaar
4 4 (0.77%) Octopus Deploy
4 4 (0.77%) TeamCity
5 3 (0.58%) CircleCI
5 3 (0.58%) Visual Studio Code
5 3 (0.58%) webpack
6 2 (0.39%) Grunt
6 2 (0.39%) gulp
6 2 (0.39%) Jenkins
6 2 (0.39%) JUnit
7 1 (0.19%) Bitbucket
7 1 (0.19%) Gradle
7 1 (0.19%) Maven
7 1 (0.19%) Postman
7 1 (0.19%) Selenium
7 1 (0.19%) TestRail
7 1 (0.19%) Vite
General
1 225 (43.35%) Social Skills
2 195 (37.57%) Finance
3 130 (25.05%) Analytical Skills
4 96 (18.50%) Marketing
5 57 (10.98%) Games
6 45 (8.67%) Presentation Skills
7 42 (8.09%) Manufacturing
8 41 (7.90%) Inclusion and Diversity
9 35 (6.74%) Telecoms
10 33 (6.36%) Law
11 32 (6.17%) Banking
12 30 (5.78%) Advertising
13 23 (4.43%) Legal
14 12 (2.31%) German Language
15 11 (2.12%) Italian Language
15 11 (2.12%) Public Sector
16 10 (1.93%) Organisational Skills
17 7 (1.35%) Aviation
17 7 (1.35%) French Language
17 7 (1.35%) Polish Language
Job Titles
1 112 (21.58%) Senior
2 66 (12.72%) Analyst
3 46 (8.86%) Architect
3 46 (8.86%) Developer
4 40 (7.71%) Lead
5 34 (6.55%) Senior Analyst
6 30 (5.78%) Software Engineer
7 29 (5.59%) Solutions Architect
8 27 (5.20%) Data Analyst
9 26 (5.01%) Senior Data Analyst
9 26 (5.01%) Senior Software Engineer
10 16 (3.08%) Business Analyst
11 15 (2.89%) IT Analyst
12 14 (2.70%) Consultant
12 14 (2.70%) E-Commerce Manager
13 12 (2.31%) Business IT Analyst
13 12 (2.31%) Quality Manager
13 12 (2.31%) Risk Manager
13 12 (2.31%) Senior Developer
14 11 (2.12%) IT Architect
Libraries, Frameworks & Software Standards
1 24 (4.62%) Kafka
2 16 (3.08%) CSS
2 16 (3.08%) HTML
3 13 (2.50%) .NET
4 12 (2.31%) Node.js
5 8 (1.54%) React
5 8 (1.54%) REST
6 7 (1.35%) Web Services
7 6 (1.16%) EDI
8 5 (0.96%) .NET Core
8 5 (0.96%) ASP.NET
8 5 (0.96%) ASP.NET Core
8 5 (0.96%) JSON
9 4 (0.77%) .NET Framework
9 4 (0.77%) Django
9 4 (0.77%) Entity Framework
9 4 (0.77%) GraphQL
9 4 (0.77%) HTML5 Canvas
9 4 (0.77%) jQuery
9 4 (0.77%) RESTful
Miscellaneous
1 32 (6.17%) Management Information System
2 29 (5.59%) Robotics
3 28 (5.39%) Product Ownership
4 23 (4.43%) Analytical Mindset
4 23 (4.43%) Blockchain
5 21 (4.05%) Distributed Systems
6 20 (3.85%) FMCG
7 18 (3.47%) Security Posture
8 15 (2.89%) Cloud Native
9 13 (2.50%) Enterprise Software
9 13 (2.50%) Mobile App
10 12 (2.31%) Legacy Systems
11 11 (2.12%) Digital Media
11 11 (2.12%) Social Media
12 10 (1.93%) EPoS
13 8 (1.54%) BBC
14 6 (1.16%) Multi-touch
14 6 (1.16%) Self-Motivation
15 5 (0.96%) Life Science
15 5 (0.96%) Security Operations Centre
Operating Systems
1 18 (3.47%) Windows
2 8 (1.54%) Mac OS X
3 5 (0.96%) Windows Server
4 4 (0.77%) Linux
5 3 (0.58%) Windows Server 2016
5 3 (0.58%) Windows Server 2019
6 1 (0.19%) Windows 10
Processes & Methodologies
1 142 (27.36%) Analytics
2 140 (26.97%) Problem-Solving
3 112 (21.58%) Agile
4 81 (15.61%) Roadmaps
5 80 (15.41%) E-Commerce
6 76 (14.64%) Project Management
7 68 (13.10%) Coaching
8 60 (11.56%) ERP
9 59 (11.37%) Artificial Intelligence
9 59 (11.37%) Software Engineering
10 54 (10.40%) Computer Science
10 54 (10.40%) Root Cause Analysis
11 51 (9.83%) Mentoring
12 50 (9.63%) Continuous Improvement
12 50 (9.63%) Storytelling
13 48 (9.25%) CRM
14 47 (9.06%) Stakeholder Management
14 47 (9.06%) Thought Leadership
15 43 (8.29%) DevOps
16 42 (8.09%) Risk Management
Programming Languages
1 77 (14.84%) Python
2 72 (13.87%) SQL
3 30 (5.78%) JavaScript
4 21 (4.05%) Scala
5 15 (2.89%) C#
6 12 (2.31%) Java
7 9 (1.73%) R
7 9 (1.73%) TypeScript
8 6 (1.16%) Data Analysis Expressions
9 3 (0.58%) Bash
9 3 (0.58%) Kusto Query Language
9 3 (0.58%) PowerShell
9 3 (0.58%) VB
9 3 (0.58%) VBA
10 1 (0.19%) Apex Code
10 1 (0.19%) C
10 1 (0.19%) Go
10 1 (0.19%) Kotlin
10 1 (0.19%) MATLAB
Qualifications
1 131 (25.24%) Degree
2 32 (6.17%) DBS Check
3 31 (5.97%) Computer Science Degree
4 14 (2.70%) CISA
5 12 (2.31%) ISACA
6 11 (2.12%) CISSP
7 8 (1.54%) Azure Certification
7 8 (1.54%) PMI Certification
8 7 (1.35%) CISM
8 7 (1.35%) Microsoft Certification
9 5 (0.96%) CCNP
9 5 (0.96%) CCSE
9 5 (0.96%) Cisco Certification
10 4 (0.77%) ITIL Certification
10 4 (0.77%) PMP
10 4 (0.77%) Security Cleared
11 3 (0.58%) APMG
11 3 (0.58%) CCIE
11 3 (0.58%) CIPD
11 3 (0.58%) ITIL Foundation Certificate
Quality Assurance & Compliance
1 25 (4.82%) QA
2 23 (4.43%) ITGC
3 22 (4.24%) GDPR
4 18 (3.47%) ISO/IEC 27001
4 18 (3.47%) PCI DSS
5 16 (3.08%) NIST
6 13 (2.50%) GMP
7 8 (1.54%) SLA
8 5 (0.96%) Accessibility
8 5 (0.96%) PMO
9 2 (0.39%) GRC
9 2 (0.39%) IFRS
9 2 (0.39%) IFRS 9
9 2 (0.39%) ISO/IEC 27002 (supersedes ISO/IEC 17799)
10 1 (0.19%) Actionable Recommendations
10 1 (0.19%) Data Quality
10 1 (0.19%) JSP 440
10 1 (0.19%) WCAG
System Software
1 16 (3.08%) Active Directory
2 11 (2.12%) Docker
3 2 (0.39%) VMware ESXi
3 2 (0.39%) VMware Infrastructure
4 1 (0.19%) XenApp
Systems Management
1 11 (2.12%) Kubernetes
2 7 (1.35%) Terraform
3 5 (0.96%) Jamf Pro
4 4 (0.77%) SCCM
5 3 (0.58%) Active Directory Federation Services
5 3 (0.58%) Microsoft Intune
6 2 (0.39%) Grafana
6 2 (0.39%) Prometheus
7 1 (0.19%) Ansible
7 1 (0.19%) OPNET
7 1 (0.19%) RSA Archer
Vendors
1 101 (19.46%) Microsoft
2 73 (14.07%) Google
3 51 (9.83%) Adobe
4 42 (8.09%) Databricks
5 41 (7.90%) SAP
6 27 (5.20%) TikTok
7 26 (5.01%) Oracle
8 25 (4.82%) Salesforce
9 20 (3.85%) Apple
10 13 (2.50%) Cisco
11 11 (2.12%) Dell
11 11 (2.12%) MuleSoft
12 8 (1.54%) Ahrefs
12 8 (1.54%) JD Edwards
13 7 (1.35%) BT
14 6 (1.16%) Yahoo!
15 5 (0.96%) Fortinet
15 5 (0.96%) Hotjar
15 5 (0.96%) Palo Alto
15 5 (0.96%) Ping Identity