Full-Stack Development Jobs in the UK excluding London

Full-Stack Development
UK > UK excluding London

The table below provides summary statistics for permanent job vacancies advertised in the UK excluding London requiring Full-Stack Development skills. It includes a benchmarking guide to the annual salaries offered in vacancies that cited Full-Stack Development over the 6 months leading up to 28 May 2025, comparing them to the same period in the previous two years.

6 months to
28 May 2025
Same period 2024 Same period 2023
Rank 136 41 83
Rank change year-on-year -95 +42 -35
Permanent jobs citing Full-Stack Development 880 3,718 2,226
As % of all permanent jobs advertised in the UK excluding London 2.26% 5.05% 3.81%
As % of the Processes & Methodologies category 2.44% 6.11% 3.99%
Number of salaries quoted 486 2,839 1,311
10th Percentile £41,875 £38,750 £40,000
25th Percentile £50,000 £45,000 £45,000
Median annual salary (50th Percentile) £60,000 £57,500 £57,500
Median % change year-on-year +4.35% - +4.55%
75th Percentile £72,500 £67,500 £72,500
90th Percentile £87,500 £77,500 £85,000
UK median annual salary £67,500 £60,000 £67,500
% change year-on-year +12.50% -11.11% +3.85%

All Process and Methodology Skills
UK excluding London

Full-Stack Development falls under the Processes and Methodologies category. For comparison with the information above, the following table provides summary statistics for all permanent job vacancies requiring process or methodology skills in the UK excluding London.

Permanent vacancies with a requirement for process or methodology skills 36,047 60,812 55,780
As % of all permanent jobs advertised in the UK excluding London 92.70% 82.57% 95.55%
Number of salaries quoted 17,118 41,900 28,987
10th Percentile £26,338 £27,300 £30,500
25th Percentile £37,000 £36,250 £40,000
Median annual salary (50th Percentile) £51,645 £50,000 £55,000
Median % change year-on-year +3.29% -9.09% +4.76%
75th Percentile £65,000 £65,000 £70,000
90th Percentile £77,500 £77,500 £82,500
UK median annual salary £57,500 £55,000 £61,000
% change year-on-year +4.55% -9.84% +1.67%

Full-Stack Development
Job Vacancy Trend in the UK excluding London

Job postings citing Full-Stack Development as a proportion of all IT jobs advertised in the UK excluding London.
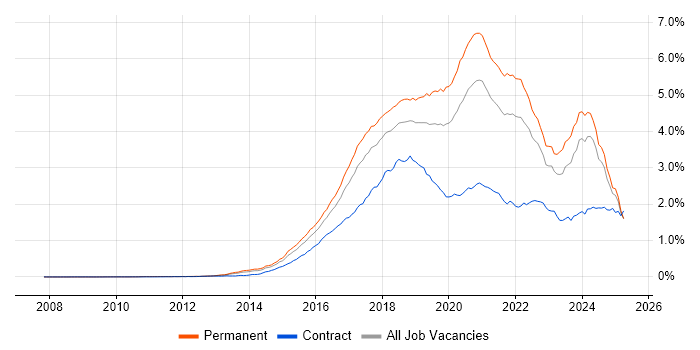
Job vacancy trend for Full-Stack Development in the UK excluding London

Full-Stack Development
Salary Trend in the UK excluding London

3-month moving average salary quoted in jobs citing Full-Stack Development in the UK excluding London.

Salary trend for Full-Stack Development in the UK excluding London

Full-Stack Development
Salary Histogram in the UK excluding London

Salary distribution for jobs citing Full-Stack Development in the UK excluding London over the 6 months to 28 May 2025.

Salary histogram for Full-Stack Development in the UK excluding London

Full-Stack Development
Job Locations in the UK excluding London

The table below looks at the demand and provides a guide to the median salaries quoted in IT jobs citing Full-Stack Development within the UK excluding London region over the 6 months to 28 May 2025. The 'Rank Change' column provides an indication of the change in demand within each location based on the same 6 month period last year.

Location Rank Change
on Same Period
Last Year
Matching
Permanent
IT Job Ads
Median Salary
Past 6 Months
Median Salary
% Change
on Same Period
Last Year
Live
Jobs
North of England -109 262 £60,000 +9.09% 281
North West -95 212 £65,000 +18.18% 193
South East -100 189 £60,000 - 159
Midlands -87 149 £52,500 -4.55% 132
Scotland -22 111 £67,500 +22.73% 80
South West -56 88 £62,500 +13.28% 80
West Midlands -57 77 £60,000 +9.09% 71
East Midlands -58 72 £47,500 -5.00% 58
East of England -92 60 £50,000 -16.67% 87
Yorkshire -79 33 £57,500 +4.55% 61
Wales -11 25 £70,000 +33.33% 31
North East -25 17 £47,500 -20.83% 27
Full-Stack Development
UK

Full-Stack Development
Co-occurring Skills and Capabilities in the UK excluding London by Category

The follow tables expand on the table above by listing co-occurrences grouped by category. The same employment type, locality and period is covered with up to 20 co-occurrences shown in each of the following categories:

Application Platforms
1 170 (19.32%) Confluence
2 27 (3.07%) CMS
3 19 (2.16%) IIS
4 12 (1.36%) WordPress
5 11 (1.25%) SharePoint
5 11 (1.25%) Umbraco
6 8 (0.91%) JBoss
6 8 (0.91%) Red Hat Fuse
7 6 (0.68%) Headless CMS
8 4 (0.45%) Apache Spark
8 4 (0.45%) Microsoft Exchange
8 4 (0.45%) nginx
9 3 (0.34%) OpenStack
9 3 (0.34%) Sitecore CMS
10 2 (0.23%) Apache Solr
10 2 (0.23%) Drupal
10 2 (0.23%) Sitefinity
11 1 (0.11%) DNN
11 1 (0.11%) Kentico
11 1 (0.11%) Oracle Workflow
Applications
1 6 (0.68%) Chatbot
1 6 (0.68%) Microsoft Office
1 6 (0.68%) MS Visio
2 2 (0.23%) Photoshop
3 1 (0.11%) Microsoft Excel
3 1 (0.11%) S-PLUS
Business Applications
1 13 (1.48%) Shopify
2 10 (1.14%) Payment Gateway
3 4 (0.45%) Magento
4 1 (0.11%) Dynamics CRM
Cloud Services
1 525 (59.66%) AWS
2 440 (50.00%) Azure
3 205 (23.30%) GCP
4 84 (9.55%) Serverless
5 52 (5.91%) GitHub
6 43 (4.89%) SaaS
7 38 (4.32%) AWS Lambda
8 21 (2.39%) Amazon EKS
9 18 (2.05%) Amazon ECS
10 17 (1.93%) Amazon S3
11 16 (1.82%) npm
12 15 (1.70%) Amazon EC2
12 15 (1.70%) Azure DevOps
13 13 (1.48%) Azure Service Bus
14 12 (1.36%) Azure API Management
14 12 (1.36%) Azure Cosmos DB
14 12 (1.36%) Azure Functions
15 11 (1.25%) Azure Synapse Analytics
15 11 (1.25%) GitHub Actions
16 10 (1.14%) Power Platform
Communications & Networking
1 23 (2.61%) Network Security
2 13 (1.48%) Internet
3 11 (1.25%) TCP/IP
4 8 (0.91%) Firewall
5 7 (0.80%) DNS
5 7 (0.80%) WAN
6 6 (0.68%) Cisco Nexus
6 6 (0.68%) DWDM
6 6 (0.68%) LAN
6 6 (0.68%) VPN
7 4 (0.45%) HTTP
7 4 (0.45%) Modbus
7 4 (0.45%) MQTT
8 2 (0.23%) Broadband
9 1 (0.11%) Intrusion Detection
9 1 (0.11%) Reverse Proxy
9 1 (0.11%) VLAN
9 1 (0.11%) Wi-Fi
Database & Business Intelligence
1 343 (38.98%) SQL Server
2 80 (9.09%) MySQL
3 76 (8.64%) PostgreSQL
4 51 (5.80%) Relational Database
5 42 (4.77%) NoSQL
6 33 (3.75%) DynamoDB
6 33 (3.75%) MongoDB
7 22 (2.50%) RDBMS
8 13 (1.48%) Redis
9 9 (1.02%) Amazon RDS
10 7 (0.80%) Elasticsearch
11 6 (0.68%) SQLite
12 5 (0.57%) Big Data
13 4 (0.45%) Azure SQL Database
13 4 (0.45%) Data Hub
13 4 (0.45%) Hazelcast
13 4 (0.45%) SQL CLR
14 3 (0.34%) Hadoop
15 2 (0.23%) Apache Cassandra
15 2 (0.23%) Apache Hive
Development Applications
1 278 (31.59%) JIRA
2 276 (31.36%) GitLab
3 263 (29.89%) Sonatype Nexus
4 261 (29.66%) Cucumber
5 256 (29.09%) Maven
6 253 (28.75%) Bitbucket
6 253 (28.75%) Selenium
7 247 (28.07%) SonarQube
8 136 (15.45%) Git
9 36 (4.09%) Jenkins
10 23 (2.61%) Visual Studio
11 19 (2.16%) JUnit
12 17 (1.93%) webpack
13 14 (1.59%) Cypress.io
14 8 (0.91%) JMeter
15 7 (0.80%) TeamCity
16 6 (0.68%) Jasmine
16 6 (0.68%) NUnit
17 4 (0.45%) Mockito
17 4 (0.45%) rollup.js
General
1 350 (39.77%) Finance
2 282 (32.05%) Banking
3 263 (29.89%) Inclusion and Diversity
4 119 (13.52%) Social Skills
5 116 (13.18%) Retail
6 91 (10.34%) Investment Banking
7 90 (10.23%) Corporate Banking
8 30 (3.41%) Analytical Skills
9 25 (2.84%) Law
10 23 (2.61%) Public Sector
11 17 (1.93%) Marketing
12 16 (1.82%) Tech for Good
13 10 (1.14%) Games
14 9 (1.02%) Legal
14 9 (1.02%) Organisational Skills
15 7 (0.80%) Advertising
16 6 (0.68%) Automotive
16 6 (0.68%) Back Office
16 6 (0.68%) Pharmaceutical
16 6 (0.68%) Telecoms
Job Titles
1 393 (44.66%) Developer
2 379 (43.07%) Software Engineer
3 255 (28.98%) Full-Stack Developer
4 171 (19.43%) Senior
5 128 (14.55%) Senior Developer
6 92 (10.45%) Lead
7 88 (10.00%) Full-Stack Engineer
8 64 (7.27%) Senior Full-Stack Developer
8 64 (7.27%) Software Developer
9 60 (6.82%) C# Developer
10 57 (6.48%) Full-Stack Software Engineer
11 52 (5.91%) .NET Developer
12 46 (5.23%) Full-Stack C# Developer
13 45 (5.11%) Java Developer
14 39 (4.43%) Lead Developer
15 36 (4.09%) Full-Stack .NET Developer
15 36 (4.09%) Senior Software Developer
16 32 (3.64%) Java Engineer
17 31 (3.52%) Senior Software Engineer
18 28 (3.18%) Full-Stack Java Developer
Libraries, Frameworks & Software Standards
1 524 (59.55%) React
2 380 (43.18%) HTML
3 363 (41.25%) CSS
4 328 (37.27%) Spring Boot
5 323 (36.70%) Spring
6 289 (32.84%) Kafka
7 259 (29.43%) Redux
8 250 (28.41%) JPA
9 221 (25.11%) .NET
10 179 (20.34%) RESTful
11 164 (18.64%) Hibernate
12 157 (17.84%) REST
13 148 (16.82%) AngularJS
14 131 (14.89%) Node.js
15 124 (14.09%) Jest
16 114 (12.95%) HTML5
17 107 (12.16%) CSS3
18 102 (11.59%) Sass
19 70 (7.95%) Vue
20 69 (7.84%) .NET Core
Miscellaneous
1 277 (31.48%) Product Ownership
2 249 (28.30%) Enterprise Software
3 42 (4.77%) Greenfield Project
4 38 (4.32%) Mobile App
5 36 (4.09%) Cloud Native
6 35 (3.98%) Distributed Systems
7 27 (3.07%) Algorithms
8 21 (2.39%) Private Cloud
9 19 (2.16%) IoT
10 17 (1.93%) Public Cloud
11 15 (1.70%) Team-Oriented Environment
12 14 (1.59%) Legacy Systems
13 13 (1.48%) Virtual Team
14 10 (1.14%) Data Structures
15 9 (1.02%) Onboarding
15 9 (1.02%) Renewable Energy
16 8 (0.91%) Online Banking
17 7 (0.80%) Distributed Applications
17 7 (0.80%) Educational Technology
18 6 (0.68%) NHS
Operating Systems
1 39 (4.43%) Linux
2 26 (2.95%) Windows
3 22 (2.50%) Unix
4 12 (1.36%) Android
5 6 (0.68%) Windows Server
6 5 (0.57%) Apple iOS
7 1 (0.11%) Robot Operating System
Processes & Methodologies
1 519 (58.98%) Agile
2 498 (56.59%) Software Engineering
3 432 (49.09%) CI/CD
4 414 (47.05%) Microservices
5 404 (45.91%) DevOps
6 332 (37.73%) Test Automation
7 301 (34.20%) Containerisation
8 297 (33.75%) SDLC
9 296 (33.64%) Front End Development
10 266 (30.23%) TDD
11 257 (29.20%) Performance Optimisation
12 205 (23.30%) Clean Code
13 194 (22.05%) Continuous Improvement
14 190 (21.59%) User Experience
15 187 (21.25%) Mentoring
16 161 (18.30%) Problem-Solving
17 108 (12.27%) Responsive Web Design
18 101 (11.48%) Migration
19 92 (10.45%) Strategic Thinking
20 79 (8.98%) Web Development
Programming Languages
1 514 (58.41%) JavaScript
2 421 (47.84%) Java
3 411 (46.70%) SQL
4 272 (30.91%) TypeScript
5 226 (25.68%) C#
6 138 (15.68%) Python
7 61 (6.93%) PHP
8 15 (1.70%) C++
9 8 (0.91%) Kotlin
10 6 (0.68%) Bicep
10 6 (0.68%) C
10 6 (0.68%) Go
10 6 (0.68%) VB.NET
11 5 (0.57%) Shell Script
11 5 (0.57%) T-SQL
12 4 (0.45%) Delphi
12 4 (0.45%) PL/SQL
12 4 (0.45%) Rust
13 2 (0.23%) MATLAB
13 2 (0.23%) VB
Qualifications
1 78 (8.86%) Degree
2 45 (5.11%) Security Cleared
3 38 (4.32%) SC Cleared
4 31 (3.52%) Computer Science Degree
5 7 (0.80%) Numerate Degree
6 6 (0.68%) CCNA
6 6 (0.68%) CCNP
6 6 (0.68%) Cisco Certification
6 6 (0.68%) DV Cleared
6 6 (0.68%) JNCIA
6 6 (0.68%) JNCIS
7 5 (0.57%) Master's Degree
8 3 (0.34%) PhD
9 1 (0.11%) AWS Certification
9 1 (0.11%) AWS Certified Developer
Quality Assurance & Compliance
1 271 (30.80%) QA
2 100 (11.36%) Accessibility
3 8 (0.91%) SLA
4 2 (0.23%) ISO/IEC 27001
4 2 (0.23%) SEPA
5 1 (0.11%) NCSC
5 1 (0.11%) NIST
5 1 (0.11%) PCI DSS
5 1 (0.11%) SOC 2
5 1 (0.11%) WCAG
System Software
1 391 (44.43%) Docker
2 5 (0.57%) Active Directory
2 5 (0.57%) Firmware
2 5 (0.57%) VMware Infrastructure
3 3 (0.34%) LXC
4 2 (0.23%) HDFS
5 1 (0.11%) Embedded Firmware
5 1 (0.11%) Hyper-V
5 1 (0.11%) NFS
Systems Management
1 347 (39.43%) Kubernetes
2 50 (5.68%) Terraform
3 20 (2.27%) Ansible
4 7 (0.80%) Grafana
5 4 (0.45%) HAProxy
5 4 (0.45%) Kibana
6 3 (0.34%) Prometheus
7 2 (0.23%) Progress Chef
7 2 (0.23%) Single Sign-On
8 1 (0.11%) cPanel
8 1 (0.11%) Opsgenie
Vendors
1 246 (27.95%) Solace
2 61 (6.93%) Microsoft
3 21 (2.39%) Databricks
4 10 (1.14%) WooCommerce
5 7 (0.80%) Dynatrace
5 7 (0.80%) Splunk
5 7 (0.80%) Telerik
6 6 (0.68%) Arista
6 6 (0.68%) Cisco
6 6 (0.68%) Oracle
6 6 (0.68%) PayPal
6 6 (0.68%) Rollbar
6 6 (0.68%) SAP
7 5 (0.57%) Google
7 5 (0.57%) VMware
8 4 (0.45%) Bloomberg
8 4 (0.45%) Ping Identity
9 3 (0.34%) Atlassian
9 3 (0.34%) Sitecore
9 3 (0.34%) Xamarin