Junior
UK

The median Junior salary in the UK is £35,000 per year according to job vacancies posted during the 6 months to 5 December 2023.

The first table below provides salary benchmarking and summary statistics including a comparison to same period in the previous 2 years.

6 months to
5 Dec 2023
Same period 2022 Same period 2021
Rank 262 263 233
Rank change year-on-year +1 -30 -35
Permanent jobs requiring a Junior 696 1,762 2,060
As % of all permanent jobs advertised in the UK 1.30% 1.42% 1.62%
As % of the Job Titles category 1.37% 1.49% 1.70%
Number of salaries quoted 579 1,299 1,641
10th Percentile £24,950 £22,750 £22,500
25th Percentile £27,500 £27,000 £26,500
Median annual salary (50th Percentile) £35,000 £35,000 £35,000
Median % change year-on-year - - +7.69%
75th Percentile £46,250 £45,000 £45,000
90th Percentile £57,500 £57,500 £56,250
UK excluding London median annual salary £32,500 £32,500 £32,500
% change year-on-year - - +8.33%

All Permanent IT Job Vacancies
UK

The following table is for comparison with the above and includes summary statistics for all permanent IT job vacancies. Most job vacancies include a discernible job title that can be normalized. As such, the figures in the second row provide an indication of the number of permanent jobs in our overall sample.

Permanent vacancies in the UK with a recognized job title 50,985 118,425 121,174
% of permanent jobs with a recognized job title 95.43% 95.37% 95.14%
Number of salaries quoted 37,346 74,222 83,417
10th Percentile £31,250 £32,750 £32,000
25th Percentile £42,500 £45,000 £42,500
Median annual salary (50th Percentile) £60,000 £60,000 £57,500
Median % change year-on-year - +4.35% +4.55%
75th Percentile £80,000 £81,250 £77,500
90th Percentile £97,500 £98,750 £95,000
UK excluding London median annual salary £52,500 £52,500 £50,000
% change year-on-year - +5.00% +5.26%

Junior
Job Vacancy Trend

Job postings that featured Junior in the job title as a proportion of all IT jobs advertised.
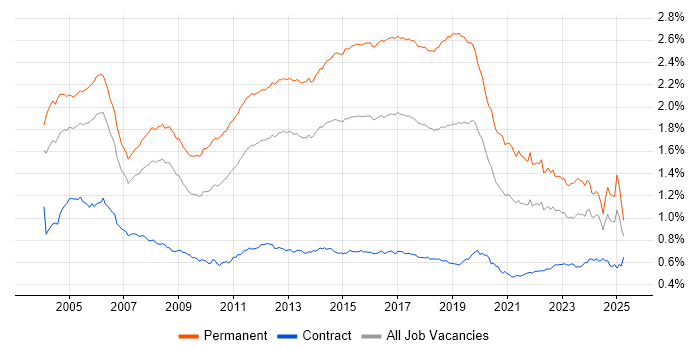
Job vacancy trend for Junior in the UK

Junior
Salary Trend

3-month moving average salary quoted in jobs citing Junior.

Salary trend for Junior in the UK

Junior
Salary Histogram

Salary distribution for jobs citing Junior over the 6 months to 5 December 2023.

Salary histogram for Junior in the UK

Junior
Top 17 Job Locations

The table below looks at the demand and provides a guide to the median salaries quoted in IT jobs citing Junior within the UK over the 6 months to 5 December 2023. The 'Rank Change' column provides an indication of the change in demand within each location based on the same 6 month period last year.

Location Rank Change
on Same Period
Last Year
Matching
Permanent
IT Job Ads
Median Salary
Past 6 Months
Median Salary
% Change
on Same Period
Last Year
Live
Jobs
England +9 638 £35,000 - 419
UK excluding London +4 465 £32,500 - 348
Work from Home -21 224 £35,000 - 145
London +11 216 £41,850 +4.63% 104
South East +48 150 £32,500 -7.14% 119
North of England +51 102 £32,500 -1.70% 78
Midlands +62 88 £31,750 -9.29% 58
West Midlands +73 66 £30,250 -12.32% 33
South West +6 57 £35,000 +16.67% 40
Yorkshire +74 50 £27,500 -8.33% 18
North West +49 49 £37,500 +7.14% 53
Scotland +17 28 £30,000 -7.69% 18
East Midlands +22 22 £35,000 -9.39% 25
East of England +43 20 £26,750 -2.73% 34
Wales +8 19 £37,500 +50.00% 11
North East +33 3 £32,500 - 8
Northern Ireland +31 2 £35,000 +6.06% 3

Junior Skill Set
Top 30 Co-occurring Skills and Capabilities

For the 6 months to 5 December 2023, Junior job roles required the following skills and capabilities in order of popularity. The figures indicate the absolute number co-occurrences and as a proportion of all permanent job ads featuring Junior in the job title.

1 212 (30.46%) Degree
2 187 (26.87%) Social Skills
3 149 (21.41%) Microsoft
4 133 (19.11%) SQL
5 121 (17.39%) C#
6 118 (16.95%) Windows
6 118 (16.95%) Agile
7 117 (16.81%) Finance
8 106 (15.23%) Python
9 105 (15.09%) Problem-Solving
10 101 (14.51%) Azure
10 101 (14.51%) Computer Science
11 86 (12.36%) Linux
12 82 (11.78%) Microsoft 365
13 81 (11.64%) Software Engineering
14 79 (11.35%) JavaScript
15 76 (10.92%) Customer Service
16 72 (10.34%) Project Management
17 64 (9.20%) HTML
17 64 (9.20%) Mathematics
18 63 (9.05%) DevOps
19 60 (8.62%) .NET
20 58 (8.33%) Retail
21 56 (8.05%) Cybersecurity
21 56 (8.05%) Security Cleared
22 54 (7.76%) AWS
23 51 (7.33%) CSS
23 51 (7.33%) C++
24 49 (7.04%) Analytical Skills
25 48 (6.90%) SQL Server

Junior Skill Set
Co-occurring Skills and Capabilities by Category

The follow tables expand on the table above by listing co-occurrences grouped by category. The same employment type, locality and period is covered with up to 20 co-occurrences shown in each of the following categories:

Application Platforms
1 13 (1.87%) SharePoint
2 9 (1.29%) MS Exchange
3 7 (1.01%) Site Server
4 6 (0.86%) Confluence
5 5 (0.72%) CMS
6 3 (0.43%) Drupal
6 3 (0.43%) nginx
6 3 (0.43%) WebSphere
7 2 (0.29%) Apache
7 2 (0.29%) Apache Airflow
7 2 (0.29%) Exchange Server 2010
7 2 (0.29%) Umbraco
8 1 (0.14%) OpenStack
8 1 (0.14%) Sitecore CMS
8 1 (0.14%) Tomcat
Applications
1 36 (5.17%) Microsoft Office
2 22 (3.16%) Microsoft Excel
3 5 (0.72%) Microsoft PowerPoint
3 5 (0.72%) Microsoft Project
4 4 (0.57%) InDesign
4 4 (0.57%) Sketch
5 3 (0.43%) Adobe XD
5 3 (0.43%) MS Visio
5 3 (0.43%) Spreadsheet
6 2 (0.29%) Adobe After Effects
6 2 (0.29%) Adobe Creative Suite
6 2 (0.29%) Adobe Illustrator
6 2 (0.29%) Adobe Premiere
6 2 (0.29%) Photoshop
7 1 (0.14%) Final Cut Pro
7 1 (0.14%) InVision
7 1 (0.14%) Marvel
7 1 (0.14%) OmniGraffle
7 1 (0.14%) OrCAD
Business Applications
1 4 (0.57%) Dynamics CRM
1 4 (0.57%) iTrent
2 3 (0.43%) SAP CO
2 3 (0.43%) SAP FI
2 3 (0.43%) SAP FI/CO
3 2 (0.29%) Salesforce CRM
3 2 (0.29%) SAP S/4HANA
3 2 (0.29%) SystmOne
4 1 (0.14%) Magento
4 1 (0.14%) Shopify
Cloud Services
1 101 (14.51%) Azure
2 82 (11.78%) Microsoft 365
3 54 (7.76%) AWS
4 31 (4.45%) Azure DevOps
5 28 (4.02%) Power Platform
6 19 (2.73%) SaaS
7 11 (1.58%) GitHub
8 10 (1.44%) Dynamics 365
9 8 (1.15%) Azure Data Factory
9 8 (1.15%) Entra ID
9 8 (1.15%) GCP
10 6 (0.86%) PowerApps
11 5 (0.72%) Azure Synapse Analytics
11 5 (0.72%) Cloud Computing
11 5 (0.72%) Figma
11 5 (0.72%) Serverless
12 4 (0.57%) Power Automate
13 3 (0.43%) WhatsApp
14 2 (0.29%) Amazon EKS
14 2 (0.29%) Smartsheet
Communications & Networking
1 34 (4.89%) TCP/IP
2 30 (4.31%) DNS
3 23 (3.30%) DHCP
4 16 (2.30%) Firewall
5 15 (2.16%) HTTP
5 15 (2.16%) VPN
6 12 (1.72%) Wi-Fi
7 11 (1.58%) SSH
7 11 (1.58%) Wireless
8 9 (1.29%) Internet
9 8 (1.15%) WAN
10 7 (1.01%) iSCSI
10 7 (1.01%) NAS
10 7 (1.01%) Network Security
10 7 (1.01%) VoIP
11 5 (0.72%) LAN
11 5 (0.72%) SMTP
12 4 (0.57%) Cisco IOS
12 4 (0.57%) Kerberos
12 4 (0.57%) SNMP
Database & Business Intelligence
1 48 (6.90%) SQL Server
2 30 (4.31%) MySQL
3 22 (3.16%) Power BI
4 15 (2.16%) SQL Server Integration Services
5 14 (2.01%) SQL Server Reporting Services
6 12 (1.72%) Relational Database
7 9 (1.29%) Data Warehouse
8 5 (0.72%) Tableau
9 4 (0.57%) DB2
9 4 (0.57%) PostgreSQL
9 4 (0.57%) SQL Server Analysis Services
10 3 (0.43%) Data Lake
10 3 (0.43%) DTS
10 3 (0.43%) Microsoft Analysis Services
10 3 (0.43%) Oracle Database
10 3 (0.43%) Oracle Reports
10 3 (0.43%) Snowflake Schema
10 3 (0.43%) Star Schema
11 2 (0.29%) Azure SQL Data Warehouse
11 2 (0.29%) BigQuery
Development Applications
1 29 (4.17%) Git
2 18 (2.59%) JIRA
3 13 (1.87%) Jenkins
4 12 (1.72%) Team Foundation Server
5 9 (1.29%) Visual Studio Team System
6 8 (1.15%) Visual Studio
7 5 (0.72%) Selenium
8 3 (0.43%) GitLab
8 3 (0.43%) Spinnaker
9 2 (0.29%) LabVIEW
10 1 (0.14%) Ant
10 1 (0.14%) Axure RP
10 1 (0.14%) Cypress.io
10 1 (0.14%) ERwin
10 1 (0.14%) IntelliJ
10 1 (0.14%) JUnit
10 1 (0.14%) Subversion
10 1 (0.14%) TeamCity
10 1 (0.14%) Visual Studio Code
10 1 (0.14%) WebDriver
General
1 187 (26.87%) Social Skills
2 117 (16.81%) Finance
3 58 (8.33%) Retail
4 49 (7.04%) Analytical Skills
5 38 (5.46%) Inclusion and Diversity
6 31 (4.45%) Marketing
7 30 (4.31%) Law
8 21 (3.02%) Banking
9 19 (2.73%) Legal
9 19 (2.73%) Organisational Skills
10 16 (2.30%) Telecoms
11 14 (2.01%) Manufacturing
12 13 (1.87%) Public Sector
13 12 (1.72%) Electronics
14 9 (1.29%) Front Office
15 8 (1.15%) Financial Institution
15 8 (1.15%) Presentation Skills
16 7 (1.01%) Games
17 6 (0.86%) Advertising
17 6 (0.86%) Aerospace
Libraries, Frameworks & Software Standards
1 64 (9.20%) HTML
2 60 (8.62%) .NET
3 51 (7.33%) CSS
4 45 (6.47%) React
5 31 (4.45%) AngularJS
6 18 (2.59%) Vue
7 17 (2.44%) ASP.NET
8 14 (2.01%) Protocol Buffers
9 13 (1.87%) jQuery
9 13 (1.87%) Spring
9 13 (1.87%) Web Services
10 12 (1.72%) Laravel
11 11 (1.58%) ASP.NET Web API
11 11 (1.58%) Node.js
11 11 (1.58%) XML
12 10 (1.44%) HTML5
12 10 (1.44%) REST
13 9 (1.29%) .NET Core
13 9 (1.29%) ASP.NET MVC
14 8 (1.15%) .NET Framework
Miscellaneous
1 23 (3.30%) Self-Motivation
2 16 (2.30%) Greenfield Project
3 14 (2.01%) Product Ownership
3 14 (2.01%) Security Operations Centre
4 13 (1.87%) Robotics
5 11 (1.58%) Data Centre
6 10 (1.44%) Algorithms
6 10 (1.44%) Mobile App
7 9 (1.29%) Hedge funds
7 9 (1.29%) Management Information System
8 7 (1.01%) Driving Licence
8 7 (1.01%) Onboarding
9 6 (0.86%) Distributed Systems
9 6 (0.86%) Smartphone
9 6 (0.86%) Social Media
10 5 (0.72%) Analytical Mindset
10 5 (0.72%) Data Protection Act
10 5 (0.72%) Data Structures
10 5 (0.72%) Raspberry Pi
11 4 (0.57%) Renewable Energy
Operating Systems
1 118 (16.95%) Windows
2 86 (12.36%) Linux
3 33 (4.74%) Android
4 21 (3.02%) Windows 10
5 14 (2.01%) Windows Server
6 10 (1.44%) Unix
7 7 (1.01%) Apple iOS
8 5 (0.72%) Ubuntu
8 5 (0.72%) Windows 7
9 3 (0.43%) Mac OS
9 3 (0.43%) Windows 8
10 2 (0.29%) Embedded Linux
10 2 (0.29%) Windows Server 2008
11 1 (0.14%) CentOS
11 1 (0.14%) Debian
11 1 (0.14%) Red Hat Enterprise Linux
11 1 (0.14%) Solaris
11 1 (0.14%) Windows Server 2012
11 1 (0.14%) Windows Server 2019
Processes & Methodologies
1 118 (16.95%) Agile
2 105 (15.09%) Problem-Solving
3 101 (14.51%) Computer Science
4 81 (11.64%) Software Engineering
5 76 (10.92%) Customer Service
6 72 (10.34%) Project Management
7 64 (9.20%) Mathematics
8 63 (9.05%) DevOps
9 56 (8.05%) Cybersecurity
10 39 (5.60%) Business Intelligence
11 38 (5.46%) OO
11 38 (5.46%) Physics
12 36 (5.17%) Artificial Intelligence
12 36 (5.17%) Scrum
13 34 (4.89%) Mentoring
13 34 (4.89%) OOP
14 31 (4.45%) Business Analysis
14 31 (4.45%) Data Science
14 31 (4.45%) Decision-Making
14 31 (4.45%) Full Stack Development
Programming Languages
1 133 (19.11%) SQL
2 121 (17.39%) C#
3 106 (15.23%) Python
4 79 (11.35%) JavaScript
5 51 (7.33%) C++
6 47 (6.75%) Java
7 34 (4.89%) C
8 27 (3.88%) TypeScript
9 25 (3.59%) PHP
10 21 (3.02%) Bash
11 20 (2.87%) PowerShell
12 12 (1.72%) T-SQL
13 8 (1.15%) Embedded C
13 8 (1.15%) R
14 7 (1.01%) Kotlin
14 7 (1.01%) MATLAB
15 5 (0.72%) Go
16 3 (0.43%) Ada
16 3 (0.43%) Delphi
17 2 (0.29%) Perl
Qualifications
1 212 (30.46%) Degree
2 56 (8.05%) Security Cleared
3 44 (6.32%) Computer Science Degree
4 36 (5.17%) SC Cleared
5 34 (4.89%) DBS Check
6 28 (4.02%) Master's Degree
7 26 (3.74%) PhD
8 10 (1.44%) Microsoft Certification
9 8 (1.15%) CompTIA Security+
10 7 (1.01%) DV Cleared
11 5 (0.72%) ACCA
11 5 (0.72%) CIMA
12 4 (0.57%) A+ Certification
12 4 (0.57%) CCNA
12 4 (0.57%) CEH
12 4 (0.57%) Cisco Certification
12 4 (0.57%) MCSA
13 3 (0.43%) CCNP
13 3 (0.43%) GSEC
13 3 (0.43%) HND
Quality Assurance & Compliance
1 30 (4.31%) QA
2 11 (1.58%) PMO
3 10 (1.44%) SLA
4 6 (0.86%) ISO/IEC 27001
5 5 (0.72%) NIST
6 4 (0.57%) IFRS
7 3 (0.43%) Data Quality
7 3 (0.43%) GDPR
8 2 (0.29%) Cyber Essentials
8 2 (0.29%) PCI DSS
9 1 (0.14%) Accessibility
9 1 (0.14%) COSHH
9 1 (0.14%) GRC
9 1 (0.14%) IFRS 9
9 1 (0.14%) ISO 14001
9 1 (0.14%) ISO/IEC 27002 (supersedes ISO/IEC 17799)
9 1 (0.14%) Software Quality Assurance
System Software
1 48 (6.90%) Active Directory
2 25 (3.59%) Docker
3 16 (2.30%) Firmware
4 11 (1.58%) Hyper-V
4 11 (1.58%) VMware Infrastructure
5 3 (0.43%) Embedded Firmware
5 3 (0.43%) VMware ESXi
5 3 (0.43%) vSphere
6 2 (0.29%) Kamailio
6 2 (0.29%) Virtual Desktop
7 1 (0.14%) BitLocker
7 1 (0.14%) NFS
7 1 (0.14%) Virtual Machines
7 1 (0.14%) VMware Server
Systems Management
1 25 (3.59%) Kubernetes
2 9 (1.29%) Terraform
3 8 (1.15%) Ansible
4 6 (0.86%) Microsoft Intune
5 5 (0.72%) N-central
6 4 (0.57%) SCCM
7 3 (0.43%) Progress Chef
7 3 (0.43%) Puppet
7 3 (0.43%) SCOM
7 3 (0.43%) Tivoli
7 3 (0.43%) vCenter Server
8 2 (0.29%) cPanel
8 2 (0.29%) FortiGate
8 2 (0.29%) Single Sign-On
9 1 (0.14%) Grafana
9 1 (0.14%) Nagios
9 1 (0.14%) Prometheus
9 1 (0.14%) Rancher
Vendors
1 149 (21.41%) Microsoft
2 21 (3.02%) Oracle
3 16 (2.30%) Cisco
3 16 (2.30%) SAP
4 13 (1.87%) VMware
5 12 (1.72%) Citrix
6 10 (1.44%) Adobe
6 10 (1.44%) Google
7 8 (1.15%) Juniper
7 8 (1.15%) Meraki
7 8 (1.15%) Salesforce
7 8 (1.15%) ServiceNow
8 7 (1.01%) BMC
9 5 (0.72%) Ubiquiti
10 4 (0.57%) Aruba
10 4 (0.57%) Databricks
10 4 (0.57%) Palo Alto
10 4 (0.57%) SolarWinds
11 3 (0.43%) Kaseya
11 3 (0.43%) Veeam