MongoDB Jobs in the UK excluding London

MongoDB
UK > UK excluding London

The following table provides summary statistics for permanent job vacancies advertised in the UK excluding London with a requirement for MongoDB skills. Included is a benchmarking guide to the salaries offered in vacancies that have cited MongoDB over the 6 months to 15 May 2024 with a comparison to the same period in the previous 2 years.

6 months to
15 May 2024
Same period 2023 Same period 2022
Rank 205 343 235
Rank change year-on-year +138 -108 -59
Permanent jobs citing MongoDB 995 515 1,116
As % of all permanent jobs advertised in the UK excluding London 1.40% 0.87% 1.56%
As % of the Database & Business Intelligence category 8.08% 4.49% 6.89%
Number of salaries quoted 507 344 624
10th Percentile £41,250 £40,000 £37,500
25th Percentile £43,750 £46,250 £44,125
Median annual salary (50th Percentile) £55,000 £57,750 £57,500
Median % change year-on-year -4.76% +0.43% +4.55%
75th Percentile £71,250 £72,000 £72,500
90th Percentile £77,500 £85,000 £87,500
UK median annual salary £60,000 £67,000 £67,500
% change year-on-year -10.45% -0.74% +8.00%

All Database and Business Intelligence Skills
UK excluding London

MongoDB is in the Databases and Business Intelligence category. The following table is for comparison with the above and provides summary statistics for all permanent job vacancies advertised in the UK excluding London with a requirement for database or business intelligence skills.

Permanent vacancies with a requirement for database or business intelligence skills 12,320 11,463 16,205
As % of all permanent jobs advertised in the UK excluding London 17.36% 19.32% 22.64%
Number of salaries quoted 8,144 6,673 10,207
10th Percentile £32,000 £34,500 £32,500
25th Percentile £41,000 £41,250 £39,684
Median annual salary (50th Percentile) £52,500 £55,000 £52,500
Median % change year-on-year -4.55% +4.76% +9.38%
75th Percentile £65,000 £70,000 £65,750
90th Percentile £80,000 £81,250 £80,000
UK median annual salary £57,500 £65,000 £60,000
% change year-on-year -11.54% +8.33% +9.09%

MongoDB
Job Vacancy Trend in the UK excluding London

Job postings citing MongoDB as a proportion of all IT jobs advertised in the UK excluding London.
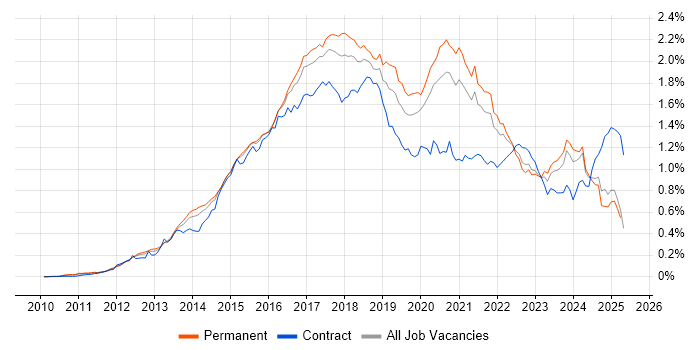
Job vacancy trend for MongoDB in the UK excluding London

MongoDB
Salary Trend in the UK excluding London

3-month moving average salary quoted in jobs citing MongoDB in the UK excluding London.

Salary trend for MongoDB in the UK excluding London

MongoDB
Salary Histogram in the UK excluding London

Salary distribution for jobs citing MongoDB in the UK excluding London over the 6 months to 15 May 2024.

Salary histogram for MongoDB in the UK excluding London

MongoDB
Job Locations in the UK excluding London

The table below looks at the demand and provides a guide to the median salaries quoted in IT jobs citing MongoDB within the UK excluding London region over the 6 months to 15 May 2024. The 'Rank Change' column provides an indication of the change in demand within each location based on the same 6 month period last year.

Location Rank Change
on Same Period
Last Year
Matching
Permanent
IT Job Ads
Median Salary
Past 6 Months
Median Salary
% Change
on Same Period
Last Year
Live
Jobs
South East +121 277 £55,000 -6.78% 27
North of England +119 238 £58,750 - 45
North West +60 163 £65,465 +9.11% 28
Scotland +42 147 £60,000 -7.69% 12
Midlands +74 144 £55,000 -6.78% 34
East Midlands +73 110 £52,500 +5.00% 9
South West -20 102 £57,500 - 21
East of England +33 60 £55,000 -15.38% 15
Yorkshire +109 52 £50,000 -2.91% 12
West Midlands +9 34 £57,500 -3.36% 25
North East +18 25 £47,500 -32.14% 5
Wales +5 21 £45,000 -10.00% 4
Northern Ireland +21 6 £75,000 +54.64% 3
MongoDB
UK

MongoDB
Co-occurring Skills and Capabilities in the UK excluding London by Category

The follow tables expand on the table above by listing co-occurrences grouped by category. The same employment type, locality and period is covered with up to 20 co-occurrences shown in each of the following categories:

Application Platforms
1 74 (7.44%) Apache
2 39 (3.92%) nginx
3 34 (3.42%) Camunda
4 21 (2.11%) Apache Spark
5 15 (1.51%) Cloud Foundry
6 8 (0.80%) Microsoft Exchange
7 7 (0.70%) ArcGIS
8 5 (0.50%) CMS
8 5 (0.50%) IIS
9 4 (0.40%) Confluence
10 3 (0.30%) Oracle SOA Suite
11 2 (0.20%) NServiceBus
12 1 (0.10%) Apache Solr
12 1 (0.10%) DNN
12 1 (0.10%) Drupal
12 1 (0.10%) EPiServer
12 1 (0.10%) Kentico
12 1 (0.10%) SharePoint
12 1 (0.10%) Sitefinity
12 1 (0.10%) Umbraco
Applications
1 1 (0.10%) MS Visio
Business Applications
1 2 (0.20%) Shopify
2 1 (0.10%) Temenos T24
Cloud Services
1 555 (55.78%) Azure
2 408 (41.01%) AWS
3 264 (26.53%) IBM Cloud
4 138 (13.87%) Azure DevOps
5 135 (13.57%) Serverless
6 116 (11.66%) Azure Functions
7 115 (11.56%) Azure API Management
7 115 (11.56%) Azure Logic Apps
7 115 (11.56%) Azure Service Bus
8 57 (5.73%) Amazon S3
9 49 (4.92%) OpenShift
10 34 (3.42%) SaaS
11 23 (2.31%) GitHub
12 16 (1.61%) AWS Lambda
13 15 (1.51%) BlazeMeter
14 13 (1.31%) GCP
15 11 (1.11%) Cloud Computing
16 9 (0.90%) Azure AKS
17 8 (0.80%) Azure Cosmos DB
17 8 (0.80%) Azure Monitor
Communications & Networking
1 65 (6.53%) Internet
2 51 (5.13%) VPN
3 49 (4.92%) Firewall
3 49 (4.92%) IPsec
3 49 (4.92%) SNMP
4 18 (1.81%) DSL
5 16 (1.61%) Hyperconnected
6 6 (0.60%) HTTP
7 4 (0.40%) MQTT
8 3 (0.30%) GPRS
8 3 (0.30%) WAN
9 2 (0.20%) LAN
10 1 (0.10%) DHCP
10 1 (0.10%) DNS
10 1 (0.10%) IPv6
10 1 (0.10%) SD-WAN
10 1 (0.10%) VSAN
Database & Business Intelligence
1 367 (36.88%) NoSQL
2 360 (36.18%) PostgreSQL
3 305 (30.65%) Elasticsearch
4 263 (26.43%) SQL Server
5 248 (24.92%) DB2
6 176 (17.69%) Relational Database
7 136 (13.67%) MySQL
8 43 (4.32%) Redis
9 37 (3.72%) Oracle Database
10 32 (3.22%) Big Data
11 31 (3.12%) Hadoop
12 21 (2.11%) Apache Cassandra
13 20 (2.01%) Tableau
14 18 (1.81%) Data Lake
15 15 (1.51%) Amazon RDS
16 14 (1.41%) DynamoDB
17 10 (1.01%) MariaDB
18 7 (0.70%) Geospatial Data
18 7 (0.70%) GIS
18 7 (0.70%) RDBMS
Development Applications
1 49 (4.92%) Jenkins
2 42 (4.22%) Git
3 34 (3.42%) Cucumber
4 28 (2.81%) Cypress.io
5 21 (2.11%) JUnit
6 15 (1.51%) Octopus Deploy
7 14 (1.41%) Selenium
8 10 (1.01%) Visual Studio
9 9 (0.90%) GitLab
10 8 (0.80%) JIRA
11 7 (0.70%) Team Foundation Server
12 6 (0.60%) Postman
12 6 (0.60%) SQL Server Management Studio (SSMS)
13 5 (0.50%) Maven
13 5 (0.50%) SonarQube
13 5 (0.50%) Subversion
13 5 (0.50%) Visual Studio Code
14 2 (0.20%) Eclipse
14 2 (0.20%) JMeter
14 2 (0.20%) Robot Framework
General
1 301 (30.25%) Public Sector
2 263 (26.43%) Inclusion and Diversity
3 257 (25.83%) Finance
4 114 (11.46%) Law
5 81 (8.14%) Marketing
6 67 (6.73%) Social Skills
7 56 (5.63%) Analytical Skills
8 51 (5.13%) Banking
9 40 (4.02%) Retail
10 34 (3.42%) Investment Banking
11 21 (2.11%) Financial Institution
11 21 (2.11%) Manufacturing
12 15 (1.51%) Private Banking
13 14 (1.41%) Games
14 10 (1.01%) Publishing
15 9 (0.90%) Health Technology
16 6 (0.60%) Telecoms
17 5 (0.50%) Electronics
17 5 (0.50%) Legal
17 5 (0.50%) Retail Banking
Job Titles
1 434 (43.62%) Developer
2 230 (23.12%) .NET Developer
3 200 (20.10%) Full Stack Engineer
4 149 (14.97%) Software Engineer
5 146 (14.67%) Full Stack Developer
6 138 (13.87%) Azure Developer
7 119 (11.96%) Azure Engineer
8 117 (11.76%) Java Engineer
9 115 (11.56%) Java Software Engineer
10 80 (8.04%) C# Developer
11 79 (7.94%) Senior
12 75 (7.54%) C# .NET Developer
13 62 (6.23%) Lead
14 52 (5.23%) Full Stack Software Engineer
15 51 (5.13%) Consultant
16 49 (4.92%) NetApp Consultant
17 48 (4.82%) DBA
18 42 (4.22%) Administrator
19 38 (3.82%) Senior Software Engineer
20 37 (3.72%) DevOps Engineer
Libraries, Frameworks & Software Standards
1 564 (56.68%) React
2 539 (54.17%) AngularJS
3 528 (53.07%) .NET
4 461 (46.33%) Node.js
5 442 (44.42%) Vue
6 435 (43.72%) ASP.NET
7 291 (29.25%) CSS
7 291 (29.25%) HTML
8 280 (28.14%) REST
9 256 (25.73%) Web Services
10 237 (23.82%) jQuery
11 236 (23.72%) ASP.NET Core
12 235 (23.62%) Twitter Bootstrap
13 231 (23.22%) Ember.js
14 228 (22.91%) Backbone.js
15 217 (21.81%) .NET Core
16 213 (21.41%) .NET Framework
17 195 (19.60%) Entity Framework
18 193 (19.40%) ASP.NET Web API
19 188 (18.89%) ASP.NET MVC
Miscellaneous
1 266 (26.73%) Hybrid Cloud
2 264 (26.53%) Blockchain
3 230 (23.12%) Algorithms
4 229 (23.02%) Data Structures
5 149 (14.97%) e-Learning
6 62 (6.23%) Data Centre
7 34 (3.42%) Reference Data
8 30 (3.02%) Product Ownership
9 29 (2.91%) Greenfield Project
10 28 (2.81%) Enterprise Software
11 23 (2.31%) Cloud Native
12 18 (1.81%) Management Information System
12 18 (1.81%) Private Cloud
12 18 (1.81%) Public Cloud
13 17 (1.71%) IoT
14 16 (1.61%) Mainframe
15 12 (1.21%) SCADA
16 11 (1.11%) Replication
17 9 (0.90%) Mobile App
18 7 (0.70%) Linux Command Line
Operating Systems
1 369 (37.09%) Linux
2 338 (33.97%) Windows
3 231 (23.22%) Android
4 229 (23.02%) Apple iOS
5 49 (4.92%) Data ONTAP
6 31 (3.12%) CentOS
6 31 (3.12%) Windows Server 2012
6 31 (3.12%) Windows Server 2016
6 31 (3.12%) Windows Server 2019
7 21 (2.11%) AIX
8 8 (0.80%) Ubuntu
9 7 (0.70%) Debian
9 7 (0.70%) Windows Server
10 2 (0.20%) Unix
Processes & Methodologies
1 555 (55.78%) Full Stack Development
2 497 (49.95%) Agile
3 447 (44.92%) MVC
4 358 (35.98%) Artificial Intelligence
5 326 (32.76%) Microservices
6 293 (29.45%) User Experience
7 287 (28.84%) OO
8 272 (27.34%) TDD
9 266 (26.73%) Design Patterns
10 255 (25.63%) MVVM
11 247 (24.82%) DevOps
12 246 (24.72%) Web Development
13 243 (24.42%) Scrum
14 233 (23.42%) OOP
15 231 (23.22%) BDD
16 230 (23.12%) Responsive Web Design
17 229 (23.02%) Design Thinking
17 229 (23.02%) SOLID
18 228 (22.91%) Co-Creation
19 220 (22.11%) Mentoring
Programming Languages
1 574 (57.69%) JavaScript
2 546 (54.87%) C#
3 515 (51.76%) SQL
4 399 (40.10%) Java
5 312 (31.36%) Python
6 223 (22.41%) TypeScript
7 43 (4.32%) PowerShell
8 41 (4.12%) Bash
9 36 (3.62%) PHP
10 34 (3.42%) Lua
11 31 (3.12%) C++
12 27 (2.71%) C
13 21 (2.11%) VB
14 20 (2.01%) Scala
15 19 (1.91%) PL/SQL
16 18 (1.81%) Go
17 17 (1.71%) Ruby
18 8 (0.80%) T-SQL
19 6 (0.60%) Groovy
20 2 (0.20%) Shell Script
Qualifications
1 75 (7.54%) Security Cleared
2 41 (4.12%) Degree
2 41 (4.12%) SC Cleared
3 34 (3.42%) DV Cleared
4 24 (2.41%) Computer Science Degree
5 7 (0.70%) PMI Certification
6 6 (0.60%) Azure Certification
7 4 (0.40%) AWS Certification
7 4 (0.40%) Master's Degree
8 2 (0.20%) AWS Certified DevOps Engineer
8 2 (0.20%) AWS Certified Solutions Architect
9 1 (0.10%) BPSS Clearance
9 1 (0.10%) MCSE
9 1 (0.10%) Microsoft Certification
Quality Assurance & Compliance
1 19 (1.91%) SLA
2 10 (1.01%) QA
3 6 (0.60%) Accessibility
4 3 (0.30%) ISO/IEC 27001
5 2 (0.20%) SOC 2
6 1 (0.10%) Data Quality
6 1 (0.10%) ISO 9001
System Software
1 173 (17.39%) Docker
2 52 (5.23%) VMware Infrastructure
3 3 (0.30%) Active Directory
4 1 (0.10%) Hyper-V
Systems Management
1 143 (14.37%) Kubernetes
2 67 (6.73%) Ansible
3 62 (6.23%) Prometheus
4 49 (4.92%) vCenter Server
5 42 (4.22%) Terraform
6 27 (2.71%) Grafana
7 9 (0.90%) Puppet
8 6 (0.60%) Progress Chef
9 4 (0.40%) Kibana
9 4 (0.40%) Single Sign-On
10 3 (0.30%) Istio
10 3 (0.30%) Perfmon
11 2 (0.20%) logstash
11 2 (0.20%) Podman
12 1 (0.10%) Kiali
12 1 (0.10%) Packer
12 1 (0.10%) SQL Sentry
Vendors
1 344 (34.57%) Red Hat
2 265 (26.63%) IBM
3 258 (25.93%) Microsoft
4 189 (18.99%) Oracle
5 53 (5.33%) VMware
6 49 (4.92%) NetApp
6 49 (4.92%) Palo Alto
6 49 (4.92%) SolidFire
7 24 (2.41%) Google
8 20 (2.01%) Sybase
9 19 (1.91%) Splunk
10 18 (1.81%) Alteryx
10 18 (1.81%) Cognos
10 18 (1.81%) Databricks
11 17 (1.71%) Dynatrace
12 10 (1.01%) Apple
13 7 (0.70%) ESRI
13 7 (0.70%) New Relic
14 6 (0.60%) SaltStack
15 4 (0.40%) SAP