F5 Jobs with Work from Home Options

F5
UK > Work from Home

The table below provides summary statistics for permanent job vacancies with an option to work from home (WFH) and a requirement for knowledge and experience of F5 products and/or services. Included is a benchmarking guide to the salaries offered in vacancies that have cited F5 over the 6 months to 29 May 2024 with a comparison to the same period in the previous 2 years.

The figures below represent the IT labour market in general and are not representative of salaries within F5 Networks, Inc.

6 months to
29 May 2024
Same period 2023 Same period 2022
Rank 509 507 626
Rank change year-on-year -2 +119 -110
Permanent jobs citing F5 80 141 252
As % of all permanent jobs with a WFH option 0.23% 0.36% 0.34%
As % of the Vendors category 0.57% 0.88% 0.93%
Number of salaries quoted 76 117 198
10th Percentile £48,750 £41,625 £45,000
25th Percentile £58,750 £46,350 £50,000
Median annual salary (50th Percentile) £68,750 £56,500 £65,500
Median % change year-on-year +21.68% -13.74% +9.17%
75th Percentile £87,500 £77,715 £77,500
90th Percentile £108,125 £81,769 £95,000
UK median annual salary £60,000 £55,000 £60,000
% change year-on-year +9.09% -8.33% -

All Vendors
Work from Home

F5 is in the Vendor Products and Services category. The following table is for comparison with the above and provides summary statistics for all permanent job vacancies with a WFH option and a requirement for knowledge or experience of vendor products and services.

Permanent vacancies with a requirement for knowledge or experience of vendor products and services 13,922 16,099 27,163
As % of all permanent jobs with a WFH option 40.43% 40.62% 37.15%
Number of salaries quoted 9,827 10,762 15,348
10th Percentile £31,500 £33,500 £32,500
25th Percentile £41,250 £43,750 £42,500
Median annual salary (50th Percentile) £55,000 £59,526 £57,500
Median % change year-on-year -7.60% +3.52% +4.55%
75th Percentile £70,974 £77,500 £77,135
90th Percentile £87,500 £92,500 £92,500
UK median annual salary £50,000 £57,500 £55,000
% change year-on-year -13.04% +4.55% +4.76%

F5
Trend for Jobs with a WFH Option

Job vacancies with a work from home option citing F5 as a proportion of all IT jobs advertised.
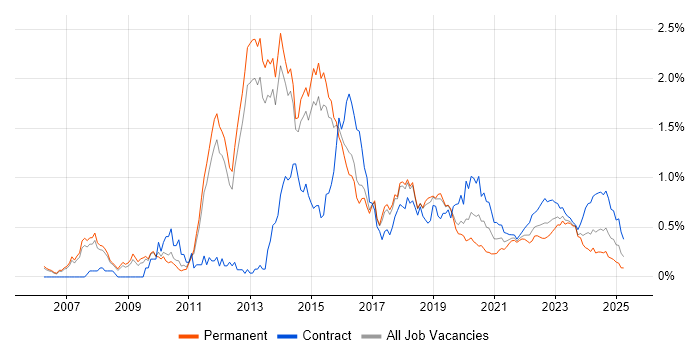
F5 trend for jobs with a WFH option

F5
Salary Trend for Jobs with a WFH Option

3-month moving average salary quoted in job vacancies with a work from home option citing F5.

F5 salary trend for jobs with a WFH option

F5
Salary Histogram for Jobs with a WFH Option

Salary distribution for jobs with a work from home option citing F5 over the 6 months to 29 May 2024.

F5 salary histogram for jobs with a WFH option

F5
Co-occurring Skills and Capabilities with WFH Options by Category

The follow tables expand on the table above by listing co-occurrences grouped by category. The same employment type, locality and period is covered with up to 20 co-occurrences shown in each of the following categories:

Application Platforms
1 11 (13.75%) SharePoint
2 4 (5.00%) nginx
3 2 (2.50%) Apache
4 1 (1.25%) IIS
Cloud Services
1 20 (25.00%) Azure
2 15 (18.75%) GCP
3 12 (15.00%) AWS
4 3 (3.75%) IaaS
5 2 (2.50%) GitHub
5 2 (2.50%) Kong
5 2 (2.50%) PaaS
5 2 (2.50%) SaaS
6 1 (1.25%) Azure DevOps
6 1 (1.25%) Cloudflare
6 1 (1.25%) Microsoft 365
Communications & Networking
1 25 (31.25%) Firewall
2 14 (17.50%) BIG-IP
2 14 (17.50%) TCP/IP
3 13 (16.25%) DNS
3 13 (16.25%) VPN
4 12 (15.00%) F5 BIG-IP LTM
4 12 (15.00%) MPLS
4 12 (15.00%) WAN
5 10 (12.50%) Cisco ASA
6 9 (11.25%) BGP
6 9 (11.25%) LAN
6 9 (11.25%) OSPF
7 8 (10.00%) SAN
8 7 (8.75%) F5 BIG-IP GTM
8 7 (8.75%) Network Security
9 6 (7.50%) Cisco Firepower
9 6 (7.50%) NAS
10 5 (6.25%) Ethernet VPN
10 5 (6.25%) VXLAN
10 5 (6.25%) Wireshark
Database & Business Intelligence
1 25 (31.25%) SQL Server
2 12 (15.00%) BigQuery
2 12 (15.00%) Data Hub
2 12 (15.00%) DB2
2 12 (15.00%) Enterprise Data Warehouse
2 12 (15.00%) MongoDB
3 7 (8.75%) Tableau
4 1 (1.25%) Data Warehouse
4 1 (1.25%) PostgreSQL
4 1 (1.25%) SQL Server Integration Services
Development Applications
1 3 (3.75%) JIRA
2 2 (2.50%) Jenkins
2 2 (2.50%) Sonatype Nexus
3 1 (1.25%) Git
3 1 (1.25%) GitLab
3 1 (1.25%) Octopus Deploy
General
1 37 (46.25%) Social Skills
2 24 (30.00%) Finance
3 17 (21.25%) Banking
4 15 (18.75%) Law
5 12 (15.00%) Financial Institution
6 10 (12.50%) Analytical Skills
6 10 (12.50%) Organisational Skills
7 6 (7.50%) Telecoms
8 3 (3.75%) Health Technology
9 2 (2.50%) Games
9 2 (2.50%) Inclusion and Diversity
9 2 (2.50%) Military
9 2 (2.50%) Pharmaceutical
9 2 (2.50%) Public Sector
9 2 (2.50%) Retail
10 1 (1.25%) Legal
Job Titles
1 23 (28.75%) Network Engineer
2 16 (20.00%) Senior
3 11 (13.75%) Senior Network Engineer
4 10 (12.50%) Administrator
4 10 (12.50%) Cisco Engineer
4 10 (12.50%) Linux Engineer
4 10 (12.50%) SharePoint Administrator
5 8 (10.00%) Cisco Network Engineer
5 8 (10.00%) Consultant
5 8 (10.00%) Database Engineer
5 8 (10.00%) Infrastructure Engineer
6 7 (8.75%) Analytics Consultant
6 7 (8.75%) Data Consultant
6 7 (8.75%) Principal Consultant
7 6 (7.50%) Network Infrastructure Engineer
8 4 (5.00%) Core Network Engineer
8 4 (5.00%) Operations Engineer
8 4 (5.00%) Senior Core Network Engineer
8 4 (5.00%) Senior Network Operations Engineer
8 4 (5.00%) Senior Operations Engineer
Libraries, Frameworks & Software Standards
1 4 (5.00%) LDAP
2 3 (3.75%) React
3 2 (2.50%) REST
4 1 (1.25%) 802.1X
4 1 (1.25%) JSON
4 1 (1.25%) Laravel
4 1 (1.25%) Next.js
4 1 (1.25%) Tailwind CSS
Miscellaneous
1 23 (28.75%) Data Centre
2 14 (17.50%) Public Cloud
3 12 (15.00%) Cyberattack
3 12 (15.00%) Data Fabric
4 8 (10.00%) FPGA
5 5 (6.25%) Distributed Denial-of-Service
6 2 (2.50%) Client/Server
6 2 (2.50%) FlexPod
6 2 (2.50%) Hybrid Cloud
6 2 (2.50%) PropTech
6 2 (2.50%) Replication
6 2 (2.50%) Virtual Team
7 1 (1.25%) Cloud Native
7 1 (1.25%) Clustering
7 1 (1.25%) Management Information System
Operating Systems
1 27 (33.75%) Linux
2 17 (21.25%) Windows
3 12 (15.00%) zOS
4 10 (12.50%) Red Hat Enterprise Linux
5 6 (7.50%) CentOS
5 6 (7.50%) Oracle Linux
6 3 (3.75%) Windows 10
6 3 (3.75%) Windows Server
6 3 (3.75%) Windows Server 2012
6 3 (3.75%) Windows Server 2016
6 3 (3.75%) Windows Server 2019
Processes & Methodologies
1 27 (33.75%) Load Balancing
2 19 (23.75%) Analytics
3 16 (20.00%) Agile
3 16 (20.00%) Problem-Solving
4 15 (18.75%) Disaster Recovery
5 13 (16.25%) ETL
6 12 (15.00%) Data Management
6 12 (15.00%) Database Optimisation
6 12 (15.00%) Incident Response
6 12 (15.00%) Migration
7 9 (11.25%) Decision-Making
8 8 (10.00%) Infrastructure Engineering
9 7 (8.75%) Business Strategy
9 7 (8.75%) Data Modelling
9 7 (8.75%) Data Strategy
9 7 (8.75%) Predictive Analytics
9 7 (8.75%) Project Management
9 7 (8.75%) Resource Management
10 6 (7.50%) ITIL
10 6 (7.50%) Mentoring
Programming Languages
1 32 (40.00%) SQL
2 19 (23.75%) Python
3 11 (13.75%) T-SQL
4 10 (12.50%) Java
5 7 (8.75%) R
6 5 (6.25%) Perl
7 4 (5.00%) JavaScript
8 2 (2.50%) Bash
8 2 (2.50%) PHP
8 2 (2.50%) TypeScript
9 1 (1.25%) ActionScript
9 1 (1.25%) PowerShell
Qualifications
1 9 (11.25%) Cisco Certification
2 7 (8.75%) CCNA
2 7 (8.75%) Degree
2 7 (8.75%) Security Cleared
3 6 (7.50%) CCNP
4 5 (6.25%) SC Cleared
5 3 (3.75%) CCDA
6 2 (2.50%) AWS Certification
7 1 (1.25%) Azure Certification
7 1 (1.25%) CCIE
7 1 (1.25%) CCSA
7 1 (1.25%) CCSE
7 1 (1.25%) CISA
7 1 (1.25%) CISSP
Quality Assurance & Compliance
1 7 (8.75%) SLA
2 2 (2.50%) NIST
3 1 (1.25%) GDPR
3 1 (1.25%) ISO/IEC 27001
3 1 (1.25%) PCI DSS
System Software
1 3 (3.75%) Active Directory
1 3 (3.75%) VMware ESXi
1 3 (3.75%) VMware Infrastructure
1 3 (3.75%) vSphere
2 2 (2.50%) NFS
2 2 (2.50%) Virtual Machines
2 2 (2.50%) VMware NSX
3 1 (1.25%) Docker
Systems Management
1 12 (15.00%) Ansible
2 7 (8.75%) Terraform
3 4 (5.00%) Nagios
3 4 (5.00%) Prometheus
4 3 (3.75%) FortiGate
4 3 (3.75%) vCenter Server
5 2 (2.50%) HAProxy
5 2 (2.50%) Red Hat Spacewalk
6 1 (1.25%) Kubernetes
6 1 (1.25%) Packer
6 1 (1.25%) Single Sign-On
6 1 (1.25%) VxRail
6 1 (1.25%) ZABBIX
Vendors
1 27 (33.75%) Cisco
2 18 (22.50%) Oracle
3 14 (17.50%) Fortinet
4 12 (15.00%) Databricks
5 10 (12.50%) CheckPoint
5 10 (12.50%) Red Hat
6 9 (11.25%) Juniper
6 9 (11.25%) Palo Alto
7 8 (10.00%) VMware
8 7 (8.75%) Salesforce
9 6 (7.50%) Meraki
9 6 (7.50%) Microsoft
10 3 (3.75%) Aruba
10 3 (3.75%) Avaya
10 3 (3.75%) Dell
11 2 (2.50%) Google
11 2 (2.50%) HP
11 2 (2.50%) NetApp
11 2 (2.50%) SolarWinds
11 2 (2.50%) SonicWALL