Requirements Gathering Jobs with Hybrid/Remote/WFH Options

Requirements Gathering (Requirements Elicitation)
UK > Work from Home

The table below provides summary statistics for permanent remote or hybrid work requiring Requirements Gathering skills. It includes a benchmarking guide to the annual salaries offered in vacancies that cited Requirements Gathering over the 6 months leading up to 16 May 2025, comparing them to the same period in the previous two years.

6 months to
16 May 2025
Same period 2024 Same period 2023
Rank 228 146 182
Rank change year-on-year -82 +36 +16
Permanent jobs citing Requirements Gathering 270 748 791
As % of all permanent jobs with a WFH option 1.47% 2.22% 1.94%
As % of the Processes & Methodologies category 1.57% 2.43% 2.02%
Number of salaries quoted 213 558 536
10th Percentile £41,700 £39,500 £41,156
25th Percentile £46,486 £42,563 £47,500
Median annual salary (50th Percentile) £61,000 £54,000 £59,750
Median % change year-on-year +12.96% -9.62% +3.91%
75th Percentile £76,250 £71,250 £72,813
90th Percentile £87,500 £79,125 £81,250
UK median annual salary £60,000 £54,975 £60,000
% change year-on-year +9.14% -8.38% +5.26%

All Process and Methodology Skills
Work from Home

Requirements Gathering falls under the Processes and Methodologies category. For comparison with the information above, the following table provides summary statistics for all permanent job vacancies with remote or hybrid options requiring process or methodology skills.

Permanent vacancies with a requirement for process or methodology skills 17,249 30,823 39,093
As % of all permanent jobs with a WFH option 94.20% 91.36% 96.08%
Number of salaries quoted 9,742 23,354 27,124
10th Percentile £28,500 £33,750 £37,500
25th Percentile £42,500 £42,500 £47,500
Median annual salary (50th Percentile) £60,000 £57,500 £62,500
Median % change year-on-year +4.35% -8.00% +4.17%
75th Percentile £77,500 £75,000 £82,500
90th Percentile £101,250 £95,000 £100,000
UK median annual salary £57,500 £55,000 £61,180
% change year-on-year +4.55% -10.10% +1.97%

Requirements Gathering
Trend for Jobs with a WFH Option

Job vacancies with remote working options citing Requirements Gathering as a proportion of all IT jobs advertised.
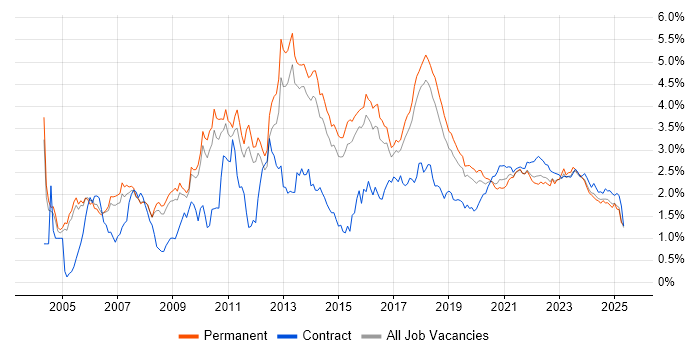
Requirements Gathering trend for jobs with Hybrid/Remote/WFH options

Requirements Gathering
Salary Trend for Jobs with a WFH Option

3-month moving average salary quoted in job vacancies with remote working options citing Requirements Gathering.

Requirements Gathering salary trend for jobs with a WFH option

Requirements Gathering
Salary Histogram for Jobs with a WFH Option

Salary distribution for jobs with remote working options citing Requirements Gathering over the 6 months to 16 May 2025.

Requirements Gathering salary histogram for jobs with a WFH option

Requirements Gathering
Co-occurring Skills and Capabilities with WFH Options by Category

The follow tables expand on the table above by listing co-occurrences grouped by category. The same employment type, locality and period is covered with up to 20 co-occurrences shown in each of the following categories:

Application Platforms
1 9 (3.33%) SharePoint
2 8 (2.96%) Confluence
3 5 (1.85%) CMS
4 2 (0.74%) Oracle Workflow
4 2 (0.74%) Sitecore CMS
4 2 (0.74%) Umbraco
5 1 (0.37%) Microsoft Exchange
Applications
1 17 (6.30%) Microsoft Office
2 15 (5.56%) Microsoft Excel
3 8 (2.96%) Microsoft PowerPoint
4 5 (1.85%) MS Visio
5 4 (1.48%) Microsoft Project
6 2 (0.74%) Oracle Smart View
6 2 (0.74%) Spreadsheet
7 1 (0.37%) Sketch
Business Applications
1 15 (5.56%) NetSuite
2 7 (2.59%) Infor M3
2 7 (2.59%) Oracle ERP
3 6 (2.22%) Dynamics CRM
4 4 (1.48%) SAP S/4HANA
5 2 (0.74%) Dynamics AX
5 2 (0.74%) Elite 3E
5 2 (0.74%) Infor LN
5 2 (0.74%) Magento
5 2 (0.74%) Oracle Assets
5 2 (0.74%) Oracle Cash Management
5 2 (0.74%) Oracle Financials
5 2 (0.74%) Oracle General Ledger
5 2 (0.74%) Oracle Payables
5 2 (0.74%) Oracle Receivables
5 2 (0.74%) SAP Business One
5 2 (0.74%) Shopify
6 1 (0.37%) Salesforce CRM
6 1 (0.37%) SAP ERP
6 1 (0.37%) SAP MM
Cloud Services
1 46 (17.04%) Power Platform
2 35 (12.96%) Azure
3 26 (9.63%) SaaS
4 22 (8.15%) Dynamics 365
5 12 (4.44%) Azure Data Factory
6 11 (4.07%) AWS
7 7 (2.59%) Azure Logic Apps
7 7 (2.59%) Azure Monitor
7 7 (2.59%) Microsoft 365
8 6 (2.22%) Amazon EC2
8 6 (2.22%) Amazon ECR
8 6 (2.22%) Amazon EKS
8 6 (2.22%) Amazon S3
8 6 (2.22%) Slack
8 6 (2.22%) Virtual Private Cloud
9 5 (1.85%) PowerApps
10 4 (1.48%) Entra ID
10 4 (1.48%) GCP
11 3 (1.11%) Azure DevOps
11 3 (1.11%) Power Automate
Communications & Networking
1 4 (1.48%) BGP
1 4 (1.48%) Cisco IOS
1 4 (1.48%) IPsec
1 4 (1.48%) Junos
1 4 (1.48%) LAN
1 4 (1.48%) MPLS
1 4 (1.48%) WAN
2 3 (1.11%) VPN
3 2 (0.74%) Cisco Firepower
4 1 (0.37%) Firewall
4 1 (0.37%) SAN
4 1 (0.37%) SpaceWire
Database & Business Intelligence
1 39 (14.44%) Power BI
2 24 (8.89%) SQL Server
3 22 (8.15%) Data Warehouse
4 14 (5.19%) MongoDB
5 12 (4.44%) Relational Database
6 9 (3.33%) SQL Server Integration Services
7 8 (2.96%) Data Lake
7 8 (2.96%) Tick Data
8 7 (2.59%) DB2
9 6 (2.22%) MySQL
10 4 (1.48%) Azure SQL Database
10 4 (1.48%) NoSQL
10 4 (1.48%) SQL Server Reporting Services
11 3 (1.11%) BusinessObjects
11 3 (1.11%) Data Mining
11 3 (1.11%) Metadata
12 2 (0.74%) MS Access
12 2 (0.74%) RDBMS
12 2 (0.74%) Tableau
13 1 (0.37%) Oracle Database
Development Applications
1 13 (4.81%) JIRA
2 10 (3.70%) Visual Studio
3 8 (2.96%) Git
4 7 (2.59%) GitLab
5 3 (1.11%) JMeter
6 2 (0.74%) ERwin
7 1 (0.37%) LSMW
7 1 (0.37%) Oracle APEX
General
1 114 (42.22%) Social Skills
2 100 (37.04%) Finance
3 54 (20.00%) Analytical Skills
4 17 (6.30%) Legal
4 17 (6.30%) Manufacturing
4 17 (6.30%) Marketing
5 15 (5.56%) Banking
5 15 (5.56%) Presentation Skills
6 13 (4.81%) Law
7 11 (4.07%) Billing
7 11 (4.07%) Inclusion and Diversity
7 11 (4.07%) Public Sector
8 7 (2.59%) Documentation Skills
9 6 (2.22%) Electronics
9 6 (2.22%) Organisational Skills
9 6 (2.22%) Retail
9 6 (2.22%) Tech for Good
10 4 (1.48%) General Ledger
10 4 (1.48%) Local Government
11 2 (0.74%) Front Office
Job Titles
1 100 (37.04%) Analyst
2 67 (24.81%) Business Analyst
3 46 (17.04%) Consultant
3 46 (17.04%) Senior
4 22 (8.15%) Developer
4 22 (8.15%) Lead
5 21 (7.78%) Technical Consultant
6 20 (7.41%) Senior Consultant
6 20 (7.41%) Senior ServiceNow Consultant
6 20 (7.41%) Senior Technical Consultant
6 20 (7.41%) ServiceNow Consultant
7 18 (6.67%) Senior Analyst
8 14 (5.19%) Administrator
8 14 (5.19%) ERP Manager
8 14 (5.19%) Project Manager
9 13 (4.81%) NetSuite Consultant
10 12 (4.44%) Business Intelligence Analyst
10 12 (4.44%) Technical Analyst
11 11 (4.07%) Technical Business Analyst
12 9 (3.33%) Software Engineer
Libraries, Frameworks & Software Standards
1 21 (7.78%) AngularJS
2 20 (7.41%) HTML
3 15 (5.56%) React
4 13 (4.81%) .NET
5 9 (3.33%) ASP.NET
6 7 (2.59%) .NET Framework
7 6 (2.22%) Django
7 6 (2.22%) Flask
7 6 (2.22%) Lambda Expressions
8 5 (1.85%) Vue
9 4 (1.48%) FastAPI
9 4 (1.48%) Kafka
9 4 (1.48%) REST
10 3 (1.11%) Oracle Fusion
10 3 (1.11%) SailPoint
10 3 (1.11%) SOAP
11 2 (0.74%) EDI
11 2 (0.74%) Gherkin
11 2 (0.74%) GraphQL
11 2 (0.74%) Middleware
Miscellaneous
1 16 (5.93%) Product Ownership
2 13 (4.81%) Management Information System
3 8 (2.96%) Social Media
4 6 (2.22%) Algorithms
4 6 (2.22%) Molecular Biology
5 5 (1.85%) Legacy Systems
5 5 (1.85%) Mainframe
5 5 (1.85%) Onboarding
6 4 (1.48%) Analytical Mindset
6 4 (1.48%) Self-Motivation
7 3 (1.11%) Client/Server
7 3 (1.11%) Driving Licence
7 3 (1.11%) Legacy Applications
7 3 (1.11%) Market Risk
7 3 (1.11%) Virtual Team
8 2 (0.74%) Cyber Threat
8 2 (0.74%) Enterprise Software
8 2 (0.74%) EPoS
8 2 (0.74%) NHS
8 2 (0.74%) PMI
Operating Systems
1 15 (5.56%) Windows
2 11 (4.07%) Linux
3 5 (1.85%) Windows Vista
4 4 (1.48%) Unix
5 1 (0.37%) AIX
5 1 (0.37%) Windows 10
5 1 (0.37%) Windows Server
Processes & Methodologies
1 78 (28.89%) Agile
2 55 (20.37%) Problem-Solving
3 46 (17.04%) Project Management
4 40 (14.81%) Analytics
4 40 (14.81%) Change Management
4 40 (14.81%) ERP
5 35 (12.96%) Business Intelligence
6 33 (12.22%) CRM
7 32 (11.85%) Data Analysis
7 32 (11.85%) Stakeholder Management
8 31 (11.48%) Continuous Improvement
9 28 (10.37%) ETL
9 28 (10.37%) Requirements Workshops
10 25 (9.26%) Migration
11 23 (8.52%) Business Analysis
11 23 (8.52%) User Stories
12 21 (7.78%) Artificial Intelligence
13 20 (7.41%) Computer Science
13 20 (7.41%) Data Migration
14 19 (7.04%) Customer Service
Programming Languages
1 63 (23.33%) SQL
2 32 (11.85%) JavaScript
3 27 (10.00%) Python
4 10 (3.70%) C#
4 10 (3.70%) T-SQL
4 10 (3.70%) TypeScript
5 9 (3.33%) VB.NET
6 7 (2.59%) Java
6 7 (2.59%) PL/SQL
7 6 (2.22%) RPG
8 5 (1.85%) Go
9 4 (1.48%) VBA
10 3 (1.11%) Data Analysis Expressions
10 3 (1.11%) Groovy
11 2 (0.74%) PowerShell
11 2 (0.74%) R
12 1 (0.37%) ABAP
12 1 (0.37%) C
12 1 (0.37%) PHP
12 1 (0.37%) VB
Qualifications
1 42 (15.56%) Degree
2 18 (6.67%) Security Cleared
3 17 (6.30%) SC Cleared
4 8 (2.96%) DBS Check
4 8 (2.96%) PMI Certification
5 7 (2.59%) Master's Degree
5 7 (2.59%) PMP
6 6 (2.22%) CCNA
6 6 (2.22%) CCNP
6 6 (2.22%) Cisco Certification
6 6 (2.22%) JNCIS
7 5 (1.85%) ACCA
8 4 (1.48%) CIMA
8 4 (1.48%) Computer Science Degree
9 3 (1.11%) Microsoft Certification
9 3 (1.11%) Six Sigma Green Belt
10 2 (0.74%) CBAP
10 2 (0.74%) CTC Cleared
10 2 (0.74%) DV Cleared
10 2 (0.74%) PRINCE2 Practitioner
Quality Assurance & Compliance
1 13 (4.81%) QA
1 13 (4.81%) SLA
2 7 (2.59%) Accessibility
3 6 (2.22%) GxP
4 5 (1.85%) Data Quality
5 3 (1.11%) GDPR
5 3 (1.11%) PMO
6 2 (0.74%) Cyber Essentials
6 2 (0.74%) ISO/IEC 27001
6 2 (0.74%) PCI DSS
7 1 (0.37%) Actionable Recommendations
7 1 (0.37%) Dodd-Frank
7 1 (0.37%) ECSS
7 1 (0.37%) HIPAA
7 1 (0.37%) MiFID
7 1 (0.37%) Sarbanes-Oxley
7 1 (0.37%) WCAG
System Software
1 16 (5.93%) Docker
2 2 (0.74%) Active Directory
3 1 (0.37%) Hyper-V
3 1 (0.37%) VMware Infrastructure
Systems Management
1 8 (2.96%) Kubernetes
2 6 (2.22%) Kustomize
3 3 (1.11%) Grafana
3 3 (1.11%) Systems Management Server (SMS)
4 2 (0.74%) Ansible
5 1 (0.37%) Microsoft Intune
5 1 (0.37%) Terraform
Vendors
1 39 (14.44%) Microsoft
2 35 (12.96%) ServiceNow
3 20 (7.41%) SAP
4 15 (5.56%) Oracle
5 12 (4.44%) Databricks
6 9 (3.33%) Infor
7 7 (2.59%) Cisco
7 7 (2.59%) SolarWinds
8 6 (2.22%) BT
8 6 (2.22%) Juniper
8 6 (2.22%) Sawtooth Software
9 5 (1.85%) PeopleSoft
9 5 (1.85%) Salesforce
10 3 (1.11%) BeyondTrust
10 3 (1.11%) CyberArk
10 3 (1.11%) F5
10 3 (1.11%) Okta
11 2 (0.74%) Freshdesk
11 2 (0.74%) Intapp
11 2 (0.74%) Sitecore