Continuous Integration Jobs with Work from Home Options

Continuous Integration
UK > Work from Home

The table below provides summary statistics for permanent job vacancies with an option to work from home (WFH) and a requirement for Continuous Integration skills. Included is a benchmarking guide to the salaries offered in vacancies that have cited Continuous Integration over the 6 months to 19 April 2024 with a comparison to the same period in the previous 2 years.

6 months to
19 Apr 2024
Same period 2023 Same period 2022
Rank 123 112 74
Rank change year-on-year -11 -38 -10
Permanent jobs citing Continuous Integration 841 1,293 3,080
As % of all permanent jobs with a WFH option 2.49% 2.94% 4.66%
As % of the Processes & Methodologies category 2.71% 3.06% 4.81%
Number of salaries quoted 625 770 1,428
10th Percentile £46,250 £47,500 £42,500
25th Percentile £52,500 £56,480 £52,500
Median annual salary (50th Percentile) £65,000 £70,000 £67,500
Median % change year-on-year -7.14% +3.70% +12.50%
75th Percentile £82,500 £89,852 £87,500
90th Percentile £95,000 £108,250 £96,550
UK median annual salary £62,500 £70,000 £65,000
% change year-on-year -10.71% +7.69% +8.33%

All Process and Methodology Skills
Work from Home

Continuous Integration is in the Processes and Methodologies category. The following table is for comparison with the above and provides summary statistics for all permanent job vacancies with a WFH option and a requirement for process or methodology skills.

Permanent vacancies with a requirement for process or methodology skills 30,988 42,210 64,018
As % of all permanent jobs with a WFH option 91.83% 96.06% 96.80%
Number of salaries quoted 23,610 29,271 41,299
10th Percentile £33,750 £37,500 £36,250
25th Percentile £42,500 £47,500 £45,000
Median annual salary (50th Percentile) £57,500 £62,500 £60,000
Median % change year-on-year -8.00% +4.17% +9.09%
75th Percentile £75,000 £82,500 £80,000
90th Percentile £95,000 £100,000 £95,000
UK median annual salary £55,000 £61,500 £60,000
% change year-on-year -10.57% +2.50% +9.09%

Continuous Integration
Trend for Jobs with a WFH Option

Job vacancies with a work from home option citing Continuous Integration as a proportion of all IT jobs advertised.
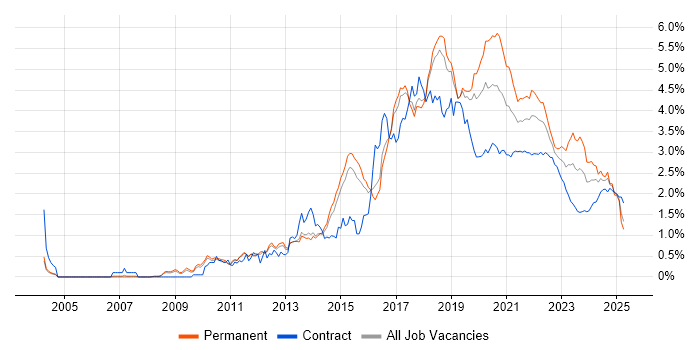
Continuous Integration trend for jobs with a WFH option

Continuous Integration
Salary Trend for Jobs with a WFH Option

3-month moving average salary quoted in job vacancies with a work from home option citing Continuous Integration.

Continuous Integration salary trend for jobs with a WFH option

Continuous Integration
Salary Histogram for Jobs with a WFH Option

Salary distribution for jobs with a work from home option citing Continuous Integration over the 6 months to 19 April 2024.

Continuous Integration salary histogram for jobs with a WFH option

Continuous Integration
Co-occurring Skills and Capabilities with WFH Options by Category

The follow tables expand on the table above by listing co-occurrences grouped by category. The same employment type, locality and period is covered with up to 20 co-occurrences shown in each of the following categories:

Application Platforms
1 49 (5.83%) IIS
2 37 (4.40%) Tuxedo
3 36 (4.28%) CMS
3 36 (4.28%) Umbraco
4 35 (4.16%) Headless CMS
4 35 (4.16%) Kentico
4 35 (4.16%) Sitecore CMS
5 28 (3.33%) SharePoint
6 12 (1.43%) nginx
7 9 (1.07%) Apache Spark
8 6 (0.71%) Apache
8 6 (0.71%) Confluence
9 4 (0.48%) Apache Airflow
10 3 (0.36%) WordPress
11 2 (0.24%) Microsoft Exchange
11 2 (0.24%) Tornado
12 1 (0.12%) Drupal
12 1 (0.12%) GemFire
12 1 (0.12%) NServiceBus
12 1 (0.12%) Oracle Coherence
Applications
1 14 (1.66%) Simulink
2 2 (0.24%) Adobe XD
2 2 (0.24%) Microsoft Excel
Business Applications
1 23 (2.73%) Dynamics CRM
2 8 (0.95%) Salesforce CRM
3 1 (0.12%) Magento
Cloud Services
1 387 (46.02%) Azure
2 331 (39.36%) AWS
3 156 (18.55%) Azure DevOps
4 119 (14.15%) Serverless
5 69 (8.20%) Dynamics 365
6 68 (8.09%) GCP
7 65 (7.73%) GitHub
8 52 (6.18%) Power Platform
9 35 (4.16%) Kontent
10 32 (3.80%) AWS Lambda
11 29 (3.45%) GitHub Actions
12 27 (3.21%) SaaS
13 25 (2.97%) Amazon EC2
14 23 (2.73%) AWS CloudFormation
15 22 (2.62%) Amazon S3
16 19 (2.26%) Power Automate
17 17 (2.02%) Azure Service Bus
18 16 (1.90%) PaaS
19 13 (1.55%) Cloud Computing
19 13 (1.55%) Entra ID
Communications & Networking
1 17 (2.02%) Broadband
2 13 (1.55%) Mobile Broadband
3 10 (1.19%) Firewall
4 7 (0.83%) DNS
4 7 (0.83%) Ethernet
5 5 (0.59%) RS-485
6 4 (0.48%) Internet
6 4 (0.48%) Modbus
6 4 (0.48%) RS-232
6 4 (0.48%) RS-422
6 4 (0.48%) VPN
7 3 (0.36%) Bluetooth
7 3 (0.36%) DHCP
7 3 (0.36%) HTTPS
7 3 (0.36%) SMS
7 3 (0.36%) SSL
8 2 (0.24%) HTTP
8 2 (0.24%) IPv6
8 2 (0.24%) Reverse Proxy
8 2 (0.24%) WAN
Database & Business Intelligence
1 73 (8.68%) SQL Server
2 69 (8.20%) Relational Database
3 61 (7.25%) PostgreSQL
4 41 (4.88%) Oracle Database
5 39 (4.64%) MySQL
6 36 (4.28%) RDBMS
7 28 (3.33%) NoSQL
8 22 (2.62%) MongoDB
9 18 (2.14%) Amazon RDS
10 14 (1.66%) Big Data
11 12 (1.43%) Data Warehouse
11 12 (1.43%) Redis
12 11 (1.31%) Data Lake
13 10 (1.19%) BigQuery
14 9 (1.07%) Flink
14 9 (1.07%) Hadoop
15 6 (0.71%) Elasticsearch
15 6 (0.71%) Power BI
16 5 (0.59%) MariaDB
17 4 (0.48%) Azure SQL Database
Development Applications
1 218 (25.92%) Git
2 133 (15.81%) GitLab
3 107 (12.72%) Jenkins
4 73 (8.68%) JIRA
5 51 (6.06%) Visual Studio
6 36 (4.28%) JDeveloper
7 27 (3.21%) Maven
8 26 (3.09%) CircleCI
8 26 (3.09%) Selenium
9 22 (2.62%) Team Foundation Server
10 21 (2.50%) TeamCity
11 15 (1.78%) SonarQube
12 14 (1.66%) Cucumber
13 9 (1.07%) CMake
13 9 (1.07%) git-flow
13 9 (1.07%) Oracle Forms
13 9 (1.07%) SpecFlow
14 7 (0.83%) JUnit
14 7 (0.83%) LabVIEW
14 7 (0.83%) Sonatype Nexus
General
1 170 (20.21%) Social Skills
2 152 (18.07%) Finance
3 60 (7.13%) Public Sector
4 48 (5.71%) Analytical Skills
5 46 (5.47%) Banking
6 43 (5.11%) Aerospace
7 41 (4.88%) Inclusion and Diversity
8 31 (3.69%) Retail
9 29 (3.45%) Telecoms
10 23 (2.73%) Law
11 21 (2.50%) Marketing
12 19 (2.26%) Automotive
13 18 (2.14%) Manufacturing
14 16 (1.90%) Electronics
15 13 (1.55%) French Language
16 10 (1.19%) Games
16 10 (1.19%) Legal
17 7 (0.83%) Financial Institution
18 6 (0.71%) Publishing
19 5 (0.59%) Retail Finance
Job Titles
1 320 (38.05%) Developer
2 236 (28.06%) Senior
3 147 (17.48%) Software Engineer
4 125 (14.86%) Lead
5 122 (14.51%) Senior Developer
6 111 (13.20%) DevOps Engineer
7 101 (12.01%) .NET Developer
8 76 (9.04%) C# Developer
9 74 (8.80%) Technical Leader
10 67 (7.97%) Full Stack Developer
11 57 (6.78%) C# .NET Developer
12 55 (6.54%) Senior .NET Developer
13 54 (6.42%) Applications Developer
14 44 (5.23%) .NET Applications Developer
15 42 (4.99%) Architect
15 42 (4.99%) Senior C# Developer
16 40 (4.76%) C# Application Developer
17 39 (4.64%) Java Engineer
17 39 (4.64%) Software Developer
18 37 (4.40%) Senior ASP.NET Developer
Libraries, Frameworks & Software Standards
1 192 (22.83%) React
2 163 (19.38%) .NET
3 130 (15.46%) RESTful
4 95 (11.30%) Node.js
5 78 (9.27%) CSS
6 76 (9.04%) HTML
7 75 (8.92%) Web Services
8 72 (8.56%) ASP.NET
8 72 (8.56%) REST
9 65 (7.73%) AngularJS
10 63 (7.49%) .NET Framework
11 57 (6.78%) Kafka
12 55 (6.54%) Spring
13 53 (6.30%) .NET Core
14 49 (5.83%) ASP.NET MVC
15 36 (4.28%) GraphQL
16 35 (4.16%) Next.js
17 31 (3.69%) RabbitMQ
18 29 (3.45%) gRPC
19 27 (3.21%) JSON
Miscellaneous
1 104 (12.37%) Private Cloud
2 47 (5.59%) Self-Motivation
3 32 (3.80%) Onboarding
4 30 (3.57%) Greenfield Project
5 24 (2.85%) Management Information System
6 22 (2.62%) Product Ownership
7 20 (2.38%) Mobile App
8 19 (2.26%) Cloud Native
9 17 (2.02%) Algorithms
9 17 (2.02%) Low-Code
9 17 (2.02%) Virtual Team
10 16 (1.90%) FMCG
11 15 (1.78%) Public Cloud
12 14 (1.66%) Data Structures
13 13 (1.55%) IoT
14 11 (1.31%) Enterprise Software
15 10 (1.19%) Embedded Systems
16 8 (0.95%) Data Centre
16 8 (0.95%) Foreign Exchange (FX)
17 7 (0.83%) SCADA
Operating Systems
1 156 (18.55%) Linux
2 62 (7.37%) Windows
3 23 (2.73%) Apple iOS
4 17 (2.02%) Embedded Linux
5 14 (1.66%) Android
6 11 (1.31%) Unix
7 10 (1.19%) Windows Server 2019
8 8 (0.95%) Mac OS
9 7 (0.83%) Windows Server
10 4 (0.48%) AIX
11 3 (0.36%) Amazon Linux
11 3 (0.36%) Red Hat Enterprise Linux
11 3 (0.36%) VMS
11 3 (0.36%) Windows Server 2008
12 1 (0.12%) CentOS
12 1 (0.12%) FreeBSD
12 1 (0.12%) Mac OS X
12 1 (0.12%) Ubuntu
12 1 (0.12%) Windows Server 2012
Processes & Methodologies
1 507 (60.29%) Agile
2 433 (51.49%) DevOps
3 364 (43.28%) CI/CD
4 316 (37.57%) Software Engineering
5 200 (23.78%) Problem-Solving
6 181 (21.52%) TDD
7 174 (20.69%) Mentoring
8 173 (20.57%) Microservices
9 167 (19.86%) Containerisation
9 167 (19.86%) Continuous Deployment
10 163 (19.38%) Continuous Delivery
11 159 (18.91%) Scrum
12 158 (18.79%) Code Quality
13 152 (18.07%) Open Source
14 137 (16.29%) Unit Testing
15 133 (15.81%) Full Stack Development
16 127 (15.10%) Kanban
17 126 (14.98%) Test Automation
18 124 (14.74%) Coaching
19 105 (12.49%) Actionable Insight
Programming Languages
1 302 (35.91%) Java
2 256 (30.44%) JavaScript
3 238 (28.30%) C#
4 206 (24.49%) Python
5 133 (15.81%) TypeScript
6 108 (12.84%) Go
7 89 (10.58%) SQL
8 66 (7.85%) Ruby
9 65 (7.73%) Bash
10 47 (5.59%) C
11 41 (4.88%) Perl
12 37 (4.40%) COBOL
12 37 (4.40%) Micro Focus COBOL
13 32 (3.80%) C++
14 24 (2.85%) PowerShell
15 16 (1.90%) Shell Script
16 15 (1.78%) PHP
17 10 (1.19%) Scala
18 7 (0.83%) Fortran
18 7 (0.83%) R
Qualifications
1 239 (28.42%) Security Cleared
2 116 (13.79%) Degree
3 107 (12.72%) SC Cleared
4 56 (6.66%) DV Cleared
5 54 (6.42%) BPSS Clearance
6 37 (4.40%) Computer Science Degree
7 13 (1.55%) AWS Certification
8 11 (1.31%) Azure Certification
9 7 (0.83%) Microsoft Certification
10 5 (0.59%) AWS Certified Solutions Architect
10 5 (0.59%) Master's Degree
11 4 (0.48%) PhD
12 3 (0.36%) PMI Certification
13 2 (0.24%) ISTQB
13 2 (0.24%) MCSE
14 1 (0.12%) ISTQB Advanced Certification
14 1 (0.12%) ITIL Certification
14 1 (0.12%) OCP
14 1 (0.12%) Oracle Certification
14 1 (0.12%) PMP
Quality Assurance & Compliance
1 92 (10.94%) QA
2 56 (6.66%) Accessibility
3 5 (0.59%) WCAG
4 4 (0.48%) Data Quality
5 3 (0.36%) Def Stans
5 3 (0.36%) MISRA
5 3 (0.36%) NCSC
5 3 (0.36%) NIST
5 3 (0.36%) SOC 2
System Software
1 206 (24.49%) Docker
2 17 (2.02%) Active Directory
3 8 (0.95%) Firmware
4 6 (0.71%) Virtual Machines
5 3 (0.36%) Virtual Desktop
5 3 (0.36%) VMware Infrastructure
6 1 (0.12%) Embedded Firmware
6 1 (0.12%) GridGain
6 1 (0.12%) Virtual Servers
Systems Management
1 186 (22.12%) Kubernetes
2 126 (14.98%) Terraform
3 98 (11.65%) Ansible
4 26 (3.09%) Progress Chef
5 12 (1.43%) Puppet
6 9 (1.07%) Grafana
7 8 (0.95%) Rancher
8 6 (0.71%) Kibana
9 5 (0.59%) Argo
10 4 (0.48%) Prometheus
11 3 (0.36%) Galera Cluster
11 3 (0.36%) Salt
11 3 (0.36%) ZABBIX
12 2 (0.24%) Consul
12 2 (0.24%) Marathon
12 2 (0.24%) Mesos
12 2 (0.24%) Packer
12 2 (0.24%) Podman
13 1 (0.12%) Nagios
Vendors
1 170 (20.21%) Microsoft
2 115 (13.67%) Oracle
3 42 (4.99%) Google
4 37 (4.40%) Micro Focus
5 35 (4.16%) Optimizely
5 35 (4.16%) Sitecore
6 18 (2.14%) SAP
7 11 (1.31%) Salesforce
8 10 (1.19%) IBM
9 9 (1.07%) McAfee
9 9 (1.07%) VMware
10 8 (0.95%) Apple
10 8 (0.95%) Databricks
10 8 (0.95%) Facebook
10 8 (0.95%) Teradata
10 8 (0.95%) Xilinx
11 5 (0.59%) Xamarin
12 4 (0.48%) Remedy
12 4 (0.48%) ServiceNow
12 4 (0.48%) Twitter