Software Developer Jobs with Hybrid/Remote/WFH Options

Software Developer
UK > Work from Home

The median Software Developer salary for remote or hybrid work is £64,000 per year, according to job vacancies posted during the 6 months leading to 17 July 2025.

The table below provides salary benchmarking and summary statistics, comparing them to the same period in the previous two years.

6 months to
17 Jul 2025
Same period 2024 Same period 2023
Rank 268 93 130
Rank change year-on-year -175 +37 +15
Permanent jobs requiring a Software Developer 230 978 881
As % of all permanent jobs with a WFH option 1.09% 3.08% 2.56%
As % of the Job Titles category 1.19% 3.21% 2.67%
Number of salaries quoted 154 868 803
10th Percentile £41,250 £34,850 £40,000
25th Percentile £50,399 £41,500 £47,500
Median annual salary (50th Percentile) £64,000 £52,500 £57,500
Median % change year-on-year +21.90% -8.70% +4.55%
75th Percentile £80,000 £70,563 £72,500
90th Percentile £122,500 £142,500 £92,250
UK median annual salary £61,250 £52,500 £55,000
% change year-on-year +16.67% -4.55% -

All Permanent IT Job Vacancies
Work from Home

For comparison with the information above, the following table provides summary statistics for all permanent IT job vacancies with WFH or hybrid options. Most job vacancies include a discernible job title that can be normalized. As such, the figures in the second row provide an indication of the number of permanent jobs in our overall sample.

Permanent vacancies in Work from Home with a recognized job title 19,293 30,513 33,037
% of permanent jobs with a recognized job title 91.53% 96.22% 95.84%
Number of salaries quoted 10,649 22,675 24,833
10th Percentile £25,267 £33,125 £36,750
25th Percentile £38,000 £42,500 £46,900
Median annual salary (50th Percentile) £55,000 £57,500 £62,500
Median % change year-on-year -4.35% -8.00% +4.17%
75th Percentile £75,000 £75,000 £80,000
90th Percentile £97,500 £95,000 £100,000
UK median annual salary £55,000 £52,500 £60,000
% change year-on-year +4.76% -12.50% -

Software Developer
Trend for Jobs with a WFH Option

Job vacancies with remote working options which featured Software Developer in the job title as a proportion of all IT jobs advertised.
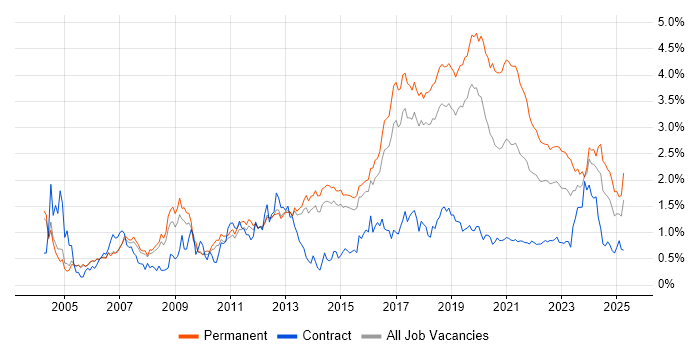
Software Developer trend for jobs with Hybrid/Remote/WFH options

Software Developer
Salary Trend for Jobs with a WFH Option

3-month moving average salary quoted in job vacancies with remote working options citing Software Developer.

Software Developer salary trend for jobs with a WFH option

Software Developer
Salary Histogram for Jobs with a WFH Option

Salary distribution for jobs with remote working options citing Software Developer over the 6 months to 17 July 2025.

Software Developer salary histogram for jobs with a WFH option

Software Developer Skill Set
Top 30 Co-occurring Skills and Capabilities in Job Vacancies with WFH Options

For the 6 months to 17 July 2025, Software Developer job roles required the following skills and capabilities in order of popularity. The figures indicate the absolute number co-occurrences and as a proportion of all permanent jobs with hybrid or remote work options featuring Software Developer in the job title.

1 119 (51.74%) Agile
2 117 (50.87%) AWS
3 115 (50.00%) .NET
4 112 (48.70%) Azure
5 105 (45.65%) Software Engineering
6 103 (44.78%) JavaScript
7 100 (43.48%) Python
8 94 (40.87%) C#
9 86 (37.39%) SQL
10 82 (35.65%) Java
11 78 (33.91%) Node.js
12 67 (29.13%) C++
12 67 (29.13%) CI/CD
13 63 (27.39%) Kanban
14 61 (26.52%) Secure Coding
15 60 (26.09%) Line Management
16 59 (25.65%) Security Cleared
17 57 (24.78%) Elasticsearch
17 57 (24.78%) Docker
18 56 (24.35%) Linux
19 55 (23.91%) OOP
19 55 (23.91%) Mathematics
19 55 (23.91%) Analytical Skills
19 55 (23.91%) Design Patterns
20 54 (23.48%) Inclusion and Diversity
21 53 (23.04%) Kubernetes
22 52 (22.61%) Collaborative Working
22 52 (22.61%) OWASP
23 51 (22.17%) Terraform
23 51 (22.17%) Rust

Software Developer Skill Set
Co-occurring Skills and Capabilities with WFH Options by Category

The follow tables expand on the table above by listing co-occurrences grouped by category. The same employment type, locality and period is covered with up to 20 co-occurrences shown in each of the following categories:

Application Platforms
1 16 (6.96%) Apache
1 16 (6.96%) Apache Airflow
2 4 (1.74%) CMS
3 2 (0.87%) Headless CMS
3 2 (0.87%) NServiceBus
3 2 (0.87%) OpenEdge
4 1 (0.43%) Confluence
4 1 (0.43%) EPiServer
4 1 (0.43%) Umbraco
4 1 (0.43%) WordPress
Applications
1 6 (2.61%) Chatbot
1 6 (2.61%) Revit
2 2 (0.87%) Trello
3 1 (0.43%) Microsoft Office
Business Applications
1 8 (3.48%) Magento
1 8 (3.48%) Shopify
2 7 (3.04%) Infor CloudSuite
2 7 (3.04%) Infor CloudSuite Industrial (formerly SyteLine)
3 2 (0.87%) Orchestrade
4 1 (0.43%) Dynamics CRM
Cloud Services
1 117 (50.87%) AWS
2 112 (48.70%) Azure
3 49 (21.30%) Amazon EKS
3 49 (21.30%) AWS CloudFormation
4 28 (12.17%) Serverless
5 22 (9.57%) AWS Lambda
6 19 (8.26%) SaaS
7 17 (7.39%) dbt
8 16 (6.96%) Snowflake
9 13 (5.65%) Azure DevOps
10 12 (5.22%) Power Platform
11 8 (3.48%) BigCommerce
12 3 (1.30%) Amazon S3
12 3 (1.30%) GCP
12 3 (1.30%) GitHub
12 3 (1.30%) Power Automate
13 2 (0.87%) Amazon SQS
13 2 (0.87%) Azure Functions
13 2 (0.87%) Azure Logic Apps
13 2 (0.87%) IaaS
Communications & Networking
1 3 (1.30%) Multicast
2 2 (0.87%) BGP
2 2 (0.87%) IPsec
2 2 (0.87%) MPLS
2 2 (0.87%) OSPF
Database & Business Intelligence
1 57 (24.78%) Elasticsearch
2 26 (11.30%) SQL Server
3 20 (8.70%) DynamoDB
4 16 (6.96%) Amazon Athena
4 16 (6.96%) Apache Arrow
4 16 (6.96%) Apache Iceberg
4 16 (6.96%) Dremio
5 11 (4.78%) NoSQL
5 11 (4.78%) PostgreSQL
5 11 (4.78%) Power BI
6 9 (3.91%) MongoDB
7 8 (3.48%) SQL Server Reporting Services
8 7 (3.04%) MySQL
9 6 (2.61%) Relational Database
10 4 (1.74%) Crystal Reports
10 4 (1.74%) Data Lake
11 3 (1.30%) SQL Server Integration Services
12 2 (0.87%) Metadata
12 2 (0.87%) RDBMS
13 1 (0.43%) Azure SQL Database
Development Applications
1 10 (4.35%) JIRA
2 6 (2.61%) Git
2 6 (2.61%) Visual Studio
3 3 (1.30%) Cypress.io
3 3 (1.30%) Selenium
4 2 (0.87%) Gatling
4 2 (0.87%) GitLab
4 2 (0.87%) Jenkins
4 2 (0.87%) JMeter
4 2 (0.87%) REST Assured
5 1 (0.43%) Grunt
5 1 (0.43%) gulp
5 1 (0.43%) NUnit
5 1 (0.43%) Postman
5 1 (0.43%) Subversion
5 1 (0.43%) Team Foundation Server
5 1 (0.43%) WebDriver
General
1 55 (23.91%) Analytical Skills
2 54 (23.48%) Inclusion and Diversity
3 32 (13.91%) Social Skills
4 28 (12.17%) Finance
5 24 (10.43%) Banking
6 18 (7.83%) Front Office
6 18 (7.83%) Investment Banking
6 18 (7.83%) Tech for Good
7 13 (5.65%) Retail
8 10 (4.35%) Health Technology
8 10 (4.35%) Organisational Skills
8 10 (4.35%) Publishing
9 6 (2.61%) Law
10 3 (1.30%) Legal
10 3 (1.30%) Social Housing
11 2 (0.87%) Automotive
11 2 (0.87%) Electronics
11 2 (0.87%) Influencing Skills
11 2 (0.87%) Presentation Skills
12 1 (0.43%) Aerospace
Libraries, Frameworks & Software Standards
1 115 (50.00%) .NET
2 78 (33.91%) Node.js
3 49 (21.30%) Pandas
4 41 (17.83%) React
5 27 (11.74%) HTML
6 23 (10.00%) ASP.NET
7 18 (7.83%) AngularJS
8 16 (6.96%) .NET Framework
8 16 (6.96%) CSS
8 16 (6.96%) PySpark
9 15 (6.52%) RESTful
10 14 (6.09%) .NET Core
11 12 (5.22%) GraphQL
12 10 (4.35%) Web Services
13 9 (3.91%) Entity Framework
13 9 (3.91%) REST
13 9 (3.91%) Swagger
14 7 (3.04%) Blazor
14 7 (3.04%) WinForms
15 6 (2.61%) FIX Protocol
Miscellaneous
1 49 (21.30%) Cyberattack
2 20 (8.70%) Derivative
3 19 (8.26%) Fixed Income
4 18 (7.83%) Foreign Exchange (FX)
5 16 (6.96%) Equities
5 16 (6.96%) Hedge funds
6 10 (4.35%) Algorithms
6 10 (4.35%) Self-Motivation
7 8 (3.48%) Enterprise Software
7 8 (3.48%) EPoS
8 7 (3.04%) Cloud Native
8 7 (3.04%) Data Structures
8 7 (3.04%) Greenfield Project
8 7 (3.04%) Product Ownership
9 6 (2.61%) Distributed Systems
10 4 (1.74%) IoT
11 3 (1.30%) Legacy Code
11 3 (1.30%) Mobile App
11 3 (1.30%) Public Cloud
11 3 (1.30%) Smart Home
Operating Systems
1 56 (24.35%) Linux
2 50 (21.74%) Android
3 3 (1.30%) Unix
4 2 (0.87%) Mac OS
5 1 (0.43%) Apple iOS
5 1 (0.43%) Windows
Processes & Methodologies
1 119 (51.74%) Agile
2 105 (45.65%) Software Engineering
3 67 (29.13%) CI/CD
4 63 (27.39%) Kanban
5 61 (26.52%) Secure Coding
6 60 (26.09%) Line Management
7 55 (23.91%) Design Patterns
7 55 (23.91%) Mathematics
7 55 (23.91%) OOP
8 52 (22.61%) Collaborative Working
8 52 (22.61%) OWASP
9 50 (21.74%) Containerisation
10 49 (21.30%) Android Development
10 49 (21.30%) OO
10 49 (21.30%) Statistics
11 37 (16.09%) Full-Stack Development
12 31 (13.48%) Clean Code
13 25 (10.87%) Mentoring
14 24 (10.43%) DevOps
15 23 (10.00%) Computer Science
Programming Languages
1 103 (44.78%) JavaScript
2 100 (43.48%) Python
3 94 (40.87%) C#
4 86 (37.39%) SQL
5 82 (35.65%) Java
6 67 (29.13%) C++
7 51 (22.17%) Rust
8 50 (21.74%) Go
9 40 (17.39%) TypeScript
10 10 (4.35%) VB.NET
11 8 (3.48%) Delphi
12 7 (3.04%) C
13 6 (2.61%) PHP
14 3 (1.30%) PowerShell
14 3 (1.30%) T-SQL
15 2 (0.87%) Bash
15 2 (0.87%) Bicep
15 2 (0.87%) Fortran
15 2 (0.87%) Scala
15 2 (0.87%) VB
Qualifications
1 59 (25.65%) Security Cleared
2 49 (21.30%) DV Cleared
3 36 (15.65%) Degree
4 14 (6.09%) Computer Science Degree
5 10 (4.35%) SC Cleared
6 3 (1.30%) Numerate Degree
7 2 (0.87%) BPSS Clearance
7 2 (0.87%) DBS Check
7 2 (0.87%) Master's Degree
7 2 (0.87%) PhD
8 1 (0.43%) Azure Certification
8 1 (0.43%) Microsoft Certification
Quality Assurance & Compliance
1 26 (11.30%) QA
2 2 (0.87%) GDPR
3 1 (0.43%) Accessibility
System Software
1 57 (24.78%) Docker
2 1 (0.43%) Virtual Machines
Systems Management
1 53 (23.04%) Kubernetes
2 51 (22.17%) Terraform
3 49 (21.30%) Ansible
4 1 (0.43%) Grafana
Vendors
1 16 (6.96%) Microsoft
2 7 (3.04%) Infor
3 6 (2.61%) PayPal
4 2 (0.87%) Mercator
4 2 (0.87%) Xamarin
5 1 (0.43%) Google
5 1 (0.43%) MuleSoft
5 1 (0.43%) Optimizely
5 1 (0.43%) Oracle