Performance Analysis Jobs with Work from Home Options

Performance Analysis
UK > Work from Home

The table below provides summary statistics for permanent job vacancies with an option to work from home (WFH) and a requirement for Performance Analysis skills. Included is a benchmarking guide to the salaries offered in vacancies that have cited Performance Analysis over the 6 months to 9 May 2024 with a comparison to the same period in the previous 2 years.

6 months to
9 May 2024
Same period 2023 Same period 2022
Rank 500 610 720
Rank change year-on-year +110 +110 -180
Permanent jobs citing Performance Analysis 89 51 122
As % of all permanent jobs with a WFH option 0.26% 0.12% 0.18%
As % of the Processes & Methodologies category 0.29% 0.13% 0.18%
Number of salaries quoted 82 37 41
10th Percentile £36,250 £31,277 £42,500
25th Percentile £46,563 £43,067 £47,500
Median annual salary (50th Percentile) £60,000 £51,500 £52,306
Median % change year-on-year +16.50% -1.54% +74.35%
75th Percentile £65,000 £62,500 £65,000
90th Percentile £84,964 £80,000 £77,102
UK median annual salary £52,500 £57,500 £59,313
% change year-on-year -8.70% -3.06% +10.35%

All Process and Methodology Skills
Work from Home

Performance Analysis is in the Processes and Methodologies category. The following table is for comparison with the above and provides summary statistics for all permanent job vacancies with a WFH option and a requirement for process or methodology skills.

Permanent vacancies with a requirement for process or methodology skills 30,857 39,858 66,375
As % of all permanent jobs with a WFH option 91.38% 96.10% 96.97%
Number of salaries quoted 23,439 27,686 41,025
10th Percentile £33,750 £37,500 £36,250
25th Percentile £42,500 £47,500 £45,750
Median annual salary (50th Percentile) £57,500 £62,500 £60,000
Median % change year-on-year -8.00% +4.17% +9.09%
75th Percentile £75,000 £82,500 £80,000
90th Percentile £95,000 £100,000 £95,000
UK median annual salary £55,000 £61,180 £60,000
% change year-on-year -10.10% +1.97% +9.09%

Performance Analysis
Trend for Jobs with a WFH Option

Job vacancies with a work from home option citing Performance Analysis as a proportion of all IT jobs advertised.
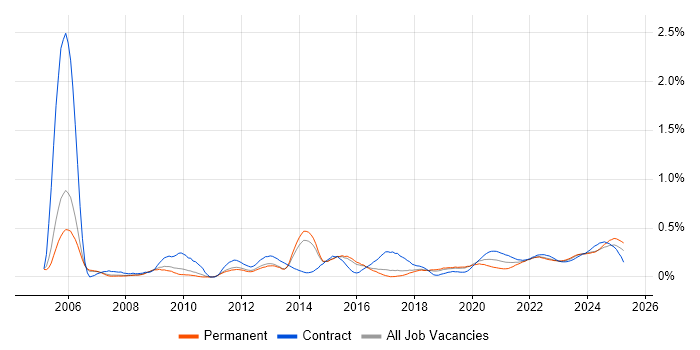
Performance Analysis trend for jobs with a WFH option

Performance Analysis
Salary Trend for Jobs with a WFH Option

3-month moving average salary quoted in job vacancies with a work from home option citing Performance Analysis.

Performance Analysis salary trend for jobs with a WFH option

Performance Analysis
Salary Histogram for Jobs with a WFH Option

Salary distribution for jobs with a work from home option citing Performance Analysis over the 6 months to 9 May 2024.

Performance Analysis salary histogram for jobs with a WFH option

Performance Analysis
Co-occurring Skills and Capabilities with WFH Options by Category

The follow tables expand on the table above by listing co-occurrences grouped by category. The same employment type, locality and period is covered with up to 20 co-occurrences shown in each of the following categories:

Application Platforms
1 2 (2.25%) CMS
Applications
1 7 (7.87%) Simulink
2 1 (1.12%) Adobe Creative Suite
2 1 (1.12%) Adobe Illustrator
2 1 (1.12%) Microsoft Excel
2 1 (1.12%) Microsoft PowerPoint
2 1 (1.12%) Photoshop
2 1 (1.12%) Spreadsheet
Cloud Services
1 33 (37.08%) Azure
2 20 (22.47%) IaaS
3 12 (13.48%) Nutanix
4 10 (11.24%) AWS
4 10 (11.24%) GitHub
5 8 (8.99%) Azure DevOps
5 8 (8.99%) GitHub Actions
5 8 (8.99%) PaaS
5 8 (8.99%) SaaS
6 7 (7.87%) Azure Monitor
6 7 (7.87%) Azure Sentinel
6 7 (7.87%) Microsoft 365
6 7 (7.87%) Power Platform
7 5 (5.62%) Power Automate
8 3 (3.37%) Google Analytics
9 2 (2.25%) GCP
9 2 (2.25%) Google Sheets
10 1 (1.12%) Facebook Ads
10 1 (1.12%) Google Ads
Communications & Networking
1 14 (15.73%) DNS
2 8 (8.99%) Ethernet
3 5 (5.62%) 5G
3 5 (5.62%) 5G NR
3 5 (5.62%) 802.11
3 5 (5.62%) LTE
3 5 (5.62%) Software-Defined Radio
3 5 (5.62%) Wireless
4 2 (2.25%) Firewall
4 2 (2.25%) Network Security
5 1 (1.12%) VPN
Database & Business Intelligence
1 7 (7.87%) Power BI
2 6 (6.74%) Data Warehouse
3 2 (2.25%) Metadata
Development Applications
1 8 (8.99%) SonarQube
2 6 (6.74%) Rational Rhapsody
3 5 (5.62%) Jenkins
4 3 (3.37%) Rational DOORS
4 3 (3.37%) Rational Team Concert
5 2 (2.25%) CircleCI
General
1 31 (34.83%) Finance
2 22 (24.72%) Analytical Skills
3 11 (12.36%) Social Skills
4 7 (7.87%) Public Sector
5 5 (5.62%) Legal
5 5 (5.62%) Marketing
6 4 (4.49%) Aerospace
6 4 (4.49%) Telecoms
7 3 (3.37%) Games
7 3 (3.37%) Italian Language
7 3 (3.37%) Organisational Skills
8 2 (2.25%) Electronics
8 2 (2.25%) Manufacturing
9 1 (1.12%) Advertising
9 1 (1.12%) Brand Awareness
9 1 (1.12%) Retail
Job Titles
1 15 (16.85%) Lead
2 12 (13.48%) Infrastructure Engineer
2 12 (13.48%) Senior
2 12 (13.48%) Senior Infrastructure Engineer
3 8 (8.99%) Software Engineer
4 6 (6.74%) Analyst
4 6 (6.74%) Team Leader
5 5 (5.62%) Business Intelligence Manager
5 5 (5.62%) Business Manager
5 5 (5.62%) Performance Specialist
5 5 (5.62%) Radio Specialist
5 5 (5.62%) Service Performance Specialist
5 5 (5.62%) Systems Engineer
5 5 (5.62%) Technical Specialist
6 4 (4.49%) Developer
7 3 (3.37%) Graduate
7 3 (3.37%) Principal Engineer
7 3 (3.37%) Principal Systems Engineer
7 3 (3.37%) Software Test Engineer
7 3 (3.37%) Test Engineer
Libraries, Frameworks & Software Standards
1 8 (8.99%) ARM Templates
1 8 (8.99%) Azure Blueprints
2 7 (7.87%) Microsoft Graph
3 6 (6.74%) Flash
4 5 (5.62%) 802.1X
5 3 (3.37%) Qt
6 2 (2.25%) DirectX
6 2 (2.25%) Flask
6 2 (2.25%) Middleware
6 2 (2.25%) OpenGL
6 2 (2.25%) OpenGL ES
6 2 (2.25%) RAML
6 2 (2.25%) REST
6 2 (2.25%) Skia Graphics Library
6 2 (2.25%) UIKit
6 2 (2.25%) Vulkan
Miscellaneous
1 12 (13.48%) Algorithms
1 12 (13.48%) IoT
2 8 (8.99%) Management Information System
2 8 (8.99%) Onboarding
2 8 (8.99%) PCIe
3 4 (4.49%) Self-Motivation
4 3 (3.37%) Analytical Mindset
4 3 (3.37%) Hybrid Cloud
4 3 (3.37%) Ray Tracing
5 2 (2.25%) 3D Graphics
5 2 (2.25%) Cloud Native
5 2 (2.25%) Distributed Systems
5 2 (2.25%) Mobile App
5 2 (2.25%) Social Media
5 2 (2.25%) Video Editing
5 2 (2.25%) Virtual Team
6 1 (1.12%) Blog
6 1 (1.12%) FMCG
6 1 (1.12%) Graphic Design
6 1 (1.12%) Security Operations Centre
Operating Systems
1 16 (17.98%) Windows
2 9 (10.11%) Linux
3 2 (2.25%) Android
3 2 (2.25%) Apple iOS
4 1 (1.12%) Unix
4 1 (1.12%) Windows Server
Processes & Methodologies
1 24 (26.97%) Problem-Solving
2 22 (24.72%) DevOps
3 21 (23.60%) Data Analysis
3 21 (23.60%) Software Engineering
4 19 (21.35%) Mentoring
5 17 (19.10%) Analytics
5 17 (19.10%) Decision-Making
6 16 (17.98%) Capacity Planning
7 12 (13.48%) Cloud Enablement
7 12 (13.48%) Disaster Recovery
7 12 (13.48%) Infrastructure Automation
7 12 (13.48%) Infrastructure Engineering
7 12 (13.48%) ITIL
7 12 (13.48%) Network Virtualisation
7 12 (13.48%) Signal Processing
7 12 (13.48%) Storage Management
7 12 (13.48%) Task Automation
7 12 (13.48%) Technical Leadership
7 12 (13.48%) Virtual Infrastructure
8 11 (12.36%) Systems Engineering
Programming Languages
1 26 (29.21%) Python
2 13 (14.61%) Bash
3 12 (13.48%) Perl
4 9 (10.11%) MATLAB
5 8 (8.99%) C
6 6 (6.74%) SQL
7 5 (5.62%) VB
8 2 (2.25%) Go
8 2 (2.25%) Java
8 2 (2.25%) Objective-C
8 2 (2.25%) Rust
8 2 (2.25%) Swift
9 1 (1.12%) Fortran
Qualifications
1 31 (34.83%) Security Cleared
2 26 (29.21%) BPSS Clearance
3 19 (21.35%) Degree
4 4 (4.49%) DBS Check
4 4 (4.49%) SC Cleared
5 3 (3.37%) PhD
6 2 (2.25%) CCNA
6 2 (2.25%) CCNP
6 2 (2.25%) Cisco Certification
6 2 (2.25%) Computer Science Degree
7 1 (1.12%) CISMP
7 1 (1.12%) CISSP
7 1 (1.12%) Master's Degree
Quality Assurance & Compliance
1 12 (13.48%) Data Quality
2 8 (8.99%) NCSC
3 5 (5.62%) Actionable Recommendations
4 3 (3.37%) Def Stans
4 3 (3.37%) MISRA
4 3 (3.37%) PMO
5 1 (1.12%) GDPR
5 1 (1.12%) ISO/IEC 27001
5 1 (1.12%) PCI DSS
System Software
1 12 (13.48%) Active Directory
1 12 (13.48%) Virtual Machines
1 12 (13.48%) VMware Infrastructure
2 10 (11.24%) Docker
3 8 (8.99%) Firmware
4 5 (5.62%) Embedded Firmware
5 2 (2.25%) Hyper-V
Systems Management
1 12 (13.48%) Kubernetes
2 10 (11.24%) Terraform
3 8 (8.99%) Ansible
4 7 (7.87%) SysTrack
Vendors
1 12 (13.48%) VMware
2 10 (11.24%) Microsoft
3 7 (7.87%) ServiceNow
3 7 (7.87%) Snow
4 4 (4.49%) Thales
5 3 (3.37%) Google
5 3 (3.37%) IBM
6 2 (2.25%) Cisco
6 2 (2.25%) Dynatrace
6 2 (2.25%) Screaming Frog
7 1 (1.12%) Adobe
7 1 (1.12%) Facebook
7 1 (1.12%) Instagram
7 1 (1.12%) TikTok