Virtual Desktop Jobs with Work from Home Options

Virtual Desktop
UK > Work from Home

The table below provides summary statistics for permanent remote or hybrid work requiring Virtual Desktop skills. It includes a benchmarking guide to the annual salaries offered in vacancies that cited Virtual Desktop over the 6 months leading up to 26 July 2024, comparing them to the same period in the previous two years.

6 months to
26 Jul 2024
Same period 2023 Same period 2022
Rank 408 459 678
Rank change year-on-year +51 +219 -143
Permanent jobs citing Virtual Desktop 127 121 238
As % of all permanent jobs with a WFH option 0.45% 0.37% 0.30%
As % of the System Software category 3.86% 2.59% 1.58%
Number of salaries quoted 100 79 122
10th Percentile £36,100 £37,397 £37,750
25th Percentile £47,188 £45,250 £45,472
Median annual salary (50th Percentile) £57,500 £70,000 £56,500
Median % change year-on-year -17.86% +23.89% -9.60%
75th Percentile £74,027 £74,250 £72,500
90th Percentile £85,000 £87,500 £77,500
UK median annual salary £55,000 £58,000 £55,000
% change year-on-year -5.17% +5.45% -

All System Software Skills
Work from Home

Virtual Desktop falls under the System Software category. For comparison with the information above, the following table provides summary statistics for all permanent job vacancies with remote or hybrid options requiring system software skills.

Permanent vacancies with a requirement for system software skills 3,287 4,676 15,106
As % of all permanent jobs with a WFH option 11.77% 14.25% 19.24%
Number of salaries quoted 2,404 3,848 8,000
10th Percentile £31,250 £32,000 £32,500
25th Percentile £41,250 £45,000 £45,000
Median annual salary (50th Percentile) £55,000 £62,500 £60,000
Median % change year-on-year -12.00% +4.17% -
75th Percentile £70,000 £80,000 £82,500
90th Percentile £85,000 £92,500 £95,000
UK median annual salary £50,000 £55,000 £55,000
% change year-on-year -9.09% - -

Virtual Desktop
Trend for Jobs with a WFH Option

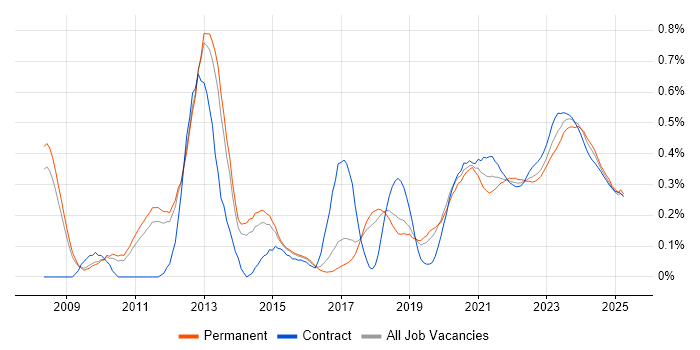
Job vacancies with a work from home option citing Virtual Desktop as a proportion of all IT jobs advertised.

Virtual Desktop trend for jobs with a WFH option

Virtual Desktop
Salary Trend for Jobs with a WFH Option

3-month moving average salary quoted in job vacancies with a work from home option citing Virtual Desktop.

Virtual Desktop salary trend for jobs with a WFH option

Virtual Desktop
Salary Histogram for Jobs with a WFH Option

Salary distribution for jobs with a work from home option citing Virtual Desktop over the 6 months to 26 July 2024.

Virtual Desktop salary histogram for jobs with a WFH option

Virtual Desktop
Co-occurring Skills and Capabilities with WFH Options by Category

The follow tables expand on the table above by listing co-occurrences grouped by category. The same employment type, locality and period is covered with up to 20 co-occurrences shown in each of the following categories:

Application Platforms
1 40 (31.50%) Microsoft Exchange
2 22 (17.32%) SharePoint
Applications
1 7 (5.51%) Microsoft Office
2 1 (0.79%) Microsoft Excel
2 1 (0.79%) Microsoft PowerPoint
Cloud Services
1 106 (83.46%) Azure
2 68 (53.54%) Microsoft 365
3 62 (48.82%) Entra ID
4 40 (31.50%) Azure Storage
5 19 (14.96%) Azure Monitor
6 18 (14.17%) Azure DevOps
7 17 (13.39%) Azure Event Grid
7 17 (13.39%) Azure Logic Apps
8 13 (10.24%) IaaS
8 13 (10.24%) PaaS
9 9 (7.09%) SaaS
10 6 (4.72%) Cloudflare
11 5 (3.94%) Azure Data Factory
11 5 (3.94%) Azure Table
11 5 (3.94%) Mimecast
12 4 (3.15%) AWS
12 4 (3.15%) OneDrive
12 4 (3.15%) Serverless
13 2 (1.57%) Nutanix
14 1 (0.79%) GCP
Communications & Networking
1 33 (25.98%) Firewall
2 25 (19.69%) DNS
3 19 (14.96%) DHCP
4 13 (10.24%) LAN
4 13 (10.24%) WAN
5 10 (7.87%) Remote Desktop
5 10 (7.87%) VPN
6 7 (5.51%) NetScaler
7 6 (4.72%) Wireless
8 5 (3.94%) iSCSI
9 4 (3.15%) BGP
9 4 (3.15%) OSPF
9 4 (3.15%) RIP
9 4 (3.15%) SAN
10 3 (2.36%) NGFW
10 3 (2.36%) Wi-Fi
11 2 (1.57%) Network Security
11 2 (1.57%) WLAN
12 1 (0.79%) IP Telephony
12 1 (0.79%) NAS
Database & Business Intelligence
1 9 (7.09%) SQL Server
2 4 (3.15%) MariaDB
2 4 (3.15%) MySQL
3 1 (0.79%) Amazon RDS
3 1 (0.79%) Power BI
Development Applications
1 17 (13.39%) Git
General
1 47 (37.01%) Social Skills
2 34 (26.77%) Finance
3 9 (7.09%) Public Sector
4 8 (6.30%) Retail
5 7 (5.51%) Analytical Skills
6 6 (4.72%) Presentation Skills
7 3 (2.36%) Banking
7 3 (2.36%) Documentation Skills
7 3 (2.36%) Police
8 2 (1.57%) Advertising
8 2 (1.57%) Organisational Skills
9 1 (0.79%) Legal
Job Titles
1 18 (14.17%) Azure Engineer
2 17 (13.39%) Automation Engineer
2 17 (13.39%) Azure Specialist
3 16 (12.60%) Active Directory Specialist
3 16 (12.60%) Active Directory Support
3 16 (12.60%) Cloud Engineer
3 16 (12.60%) Support Specialist
4 15 (11.81%) Senior
5 14 (11.02%) IT Support
6 12 (9.45%) Consultant
6 12 (9.45%) Infrastructure Engineer
7 11 (8.66%) Cloud Automation Engineer
8 9 (7.09%) Lead
9 8 (6.30%) 3rd Line Support
9 8 (6.30%) Analyst
9 8 (6.30%) Azure Consultant
10 7 (5.51%) 3rd Line Technical Support
10 7 (5.51%) IT Support Analyst
10 7 (5.51%) Support Analyst
10 7 (5.51%) Technical Support
Libraries, Frameworks & Software Standards
1 34 (26.77%) ARM Templates
2 18 (14.17%) YAML
3 6 (4.72%) Software Packaging
4 4 (3.15%) Web Services
5 1 (0.79%) JSON
Miscellaneous
1 19 (14.96%) Self-Motivation
2 18 (14.17%) PKI
3 8 (6.30%) Data Centre
3 8 (6.30%) Mobile App
4 6 (4.72%) iPhone
4 6 (4.72%) Management Information System
4 6 (4.72%) Team-Oriented Environment
5 5 (3.94%) Low-Code
6 4 (3.15%) Cloud Native
6 4 (3.15%) CMDB
6 4 (3.15%) PMI
7 3 (2.36%) Onboarding
8 2 (1.57%) Hybrid Cloud
8 2 (1.57%) Private Cloud
8 2 (1.57%) Product Ownership
9 1 (0.79%) Clustering
9 1 (0.79%) Cyberattack
9 1 (0.79%) NHS
9 1 (0.79%) Public Cloud
Operating Systems
1 72 (56.69%) Windows
2 39 (30.71%) Windows Server
3 21 (16.54%) Linux
4 18 (14.17%) Windows Server 2016
4 18 (14.17%) Windows Server 2019
5 12 (9.45%) Windows 10
6 10 (7.87%) Apple iOS
7 8 (6.30%) Android
8 6 (4.72%) Mac OS
9 4 (3.15%) Debian
9 4 (3.15%) Ubuntu
9 4 (3.15%) VMS
10 3 (2.36%) Windows 7
Processes & Methodologies
1 36 (28.35%) CI/CD
2 35 (27.56%) DevOps
3 30 (23.62%) ITIL
4 29 (22.83%) Agile
5 22 (17.32%) Identity Management
6 20 (15.75%) Analytics
6 20 (15.75%) Problem-Solving
6 20 (15.75%) Project Delivery
7 19 (14.96%) Infrastructure Engineering
7 19 (14.96%) Log Analytics
7 19 (14.96%) RBAC
7 19 (14.96%) Service Management
7 19 (14.96%) Task Automation
8 18 (14.17%) Release Management
9 17 (13.39%) Incident Response
9 17 (13.39%) Infrastructure as Code
9 17 (13.39%) Mentoring
9 17 (13.39%) Multi-Factor Authentication
9 17 (13.39%) Threat Detection
10 16 (12.60%) Privileged Identity Management
Programming Languages
1 52 (40.94%) PowerShell
2 33 (25.98%) Bicep
3 18 (14.17%) C#
4 17 (13.39%) Kusto Query Language
5 16 (12.60%) VB
5 16 (12.60%) VBScript
6 6 (4.72%) Bash
7 2 (1.57%) Go
7 2 (1.57%) JavaScript
7 2 (1.57%) Python
Qualifications
1 30 (23.62%) Degree
2 20 (15.75%) Security Cleared
3 16 (12.60%) Azure Certification
3 16 (12.60%) DV Cleared
3 16 (12.60%) ITIL Foundation Certificate
4 10 (7.87%) SC Cleared
5 6 (4.72%) Computer Science Degree
6 4 (3.15%) PMI Certification
7 3 (2.36%) BPSS Clearance
7 3 (2.36%) Microsoft Certification
8 1 (0.79%) CCA
8 1 (0.79%) CISM
8 1 (0.79%) CISSP
8 1 (0.79%) Citrix Certification
Quality Assurance & Compliance
1 7 (5.51%) QA
2 5 (3.94%) SLA
System Software
1 79 (62.20%) Active Directory
2 48 (37.80%) Virtual Machines
3 27 (21.26%) VMware Infrastructure
4 12 (9.45%) Hyper-V
5 5 (3.94%) pfSense
5 5 (3.94%) vSphere
6 4 (3.15%) Docker
6 4 (3.15%) Firmware
6 4 (3.15%) NFS
6 4 (3.15%) Virtual Servers
7 2 (1.57%) Microsoft Virtual Server
7 2 (1.57%) XenApp
7 2 (1.57%) XenDesktop
8 1 (0.79%) Terminal Server
8 1 (0.79%) VMware ESXi
Systems Management
1 55 (43.31%) Microsoft Intune
2 36 (28.35%) SCCM
3 20 (15.75%) Active Directory Federation Services
3 20 (15.75%) Kubernetes
3 20 (15.75%) Terraform
4 16 (12.60%) SCOM
4 16 (12.60%) WSUS
5 6 (4.72%) Jamf Pro
6 3 (2.36%) AirWatch
6 3 (2.36%) Nessus
7 2 (1.57%) Ansible
8 1 (0.79%) Failover Clustering
8 1 (0.79%) FortiGate
Vendors
1 76 (59.84%) Microsoft
2 27 (21.26%) VMware
3 15 (11.81%) Citrix
4 7 (5.51%) Aruba
4 7 (5.51%) ServiceNow
5 6 (4.72%) Cisco
6 5 (3.94%) CheckPoint
7 4 (3.15%) Dell
7 4 (3.15%) HP
7 4 (3.15%) NetApp
7 4 (3.15%) QNAP
7 4 (3.15%) Synology
7 4 (3.15%) Ubiquiti
8 3 (2.36%) Apple
8 3 (2.36%) Symantec
8 3 (2.36%) Toshiba
8 3 (2.36%) Veeam
9 2 (1.57%) Fortinet
10 1 (0.79%) Google
10 1 (0.79%) WatchGuard