Legal Contracts in London

Legal
England > London

The table below looks at the prevalence of the term Legal in contract job vacancies in London. Included is a benchmarking guide to the contractor rates offered in vacancies that cited Legal over the 6 months leading up to 31 May 2025, comparing them to the same period in the previous two years.

6 months to
31 May 2025
Same period 2024 Same period 2023
Rank 110 148 120
Rank change year-on-year +38 -28 +27
Contract jobs citing Legal 310 304 528
As % of all contract jobs advertised in London 2.53% 1.74% 2.07%
As % of the General category 3.74% 2.78% 3.27%
Number of daily rates quoted 208 182 363
10th Percentile £266 £208 £238
25th Percentile £429 £363 £413
Median daily rate (50th Percentile) £550 £525 £538
Median % change year-on-year +4.76% -2.33% -
75th Percentile £681 £622 £675
90th Percentile £799 £765 £788
England median daily rate £513 £500 £525
% change year-on-year +2.50% -4.76% +5.00%
Number of hourly rates quoted 11 23 5
10th Percentile £25.00 £11.95 £30.60
25th Percentile £26.25 £13.34 £37.50
Median hourly rate £47.50 £35.50 £47.50
Median % change year-on-year +33.80% -25.26% +9.52%
75th Percentile £54.50 £57.50 £62.50
90th Percentile £55.25 £63.50 £67.00
England median hourly rate £25.00 £40.00 £23.31
% change year-on-year -37.50% +71.60% -29.89%

All General Skills
London

Legal falls under the General Skills category. For comparison with the information above, the following table provides summary statistics for all contract job vacancies requiring common skills in London.

Contract vacancies with a requirement for common skills 8,290 10,943 16,128
As % of all contract IT jobs advertised in London 67.62% 62.70% 63.36%
Number of daily rates quoted 5,531 7,816 11,755
10th Percentile £346 £335 £375
25th Percentile £436 £450 £481
Median daily rate (50th Percentile) £560 £575 £600
Median % change year-on-year -2.61% -4.17% +3.45%
75th Percentile £700 £700 £725
90th Percentile £825 £825 £825
England median daily rate £525 £535 £550
% change year-on-year -1.87% -2.73% -
Number of hourly rates quoted 150 239 199
10th Percentile £15.84 £15.90 £16.13
25th Percentile £24.66 £18.25 £21.12
Median hourly rate £34.00 £30.00 £31.50
Median % change year-on-year +13.33% -4.76% -11.27%
75th Percentile £50.69 £47.00 £52.86
90th Percentile £63.88 £65.01 £70.00
England median hourly rate £28.00 £30.50 £31.96
% change year-on-year -8.20% -4.57% +48.65%

Legal
Job Vacancy Trend in London

Job postings citing Legal as a proportion of all IT jobs advertised in London.
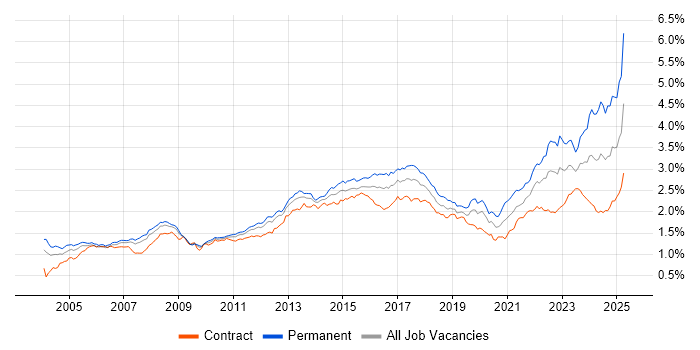
Job vacancy trend for Legal in London

Legal
Contractor Daily Rate Trend in London

3-month moving average daily rate quoted in jobs citing Legal in London.

Daily rate trend for Legal in London

Legal
Daily Rate Histogram in London

Daily rate distribution for jobs citing Legal in London over the 6 months to 31 May 2025.

Daily rate histogram for Legal in London

Legal
Contractor Hourly Rate Trend in London

3-month moving average hourly rates quoted in jobs citing Legal in London.

Hourly rate trend for Legal in London

Legal
Hourly Rate Histogram in London

Hourly rate distribution of jobs citing Legal in London over the 6 months to 31 May 2025.

Hourly rate histogram for Legal in London

Legal
Contract Job Locations in London

The table below looks at the demand and provides a guide to the median contractor rates quoted in IT jobs citing Legal within the London region over the 6 months to 31 May 2025. The 'Rank Change' column provides an indication of the change in demand within each location based on the same 6 month period last year.

Location Rank Change
on Same Period
Last Year
Matching
Contract
IT Job Ads
Median
Daily Rate
Past 6 Months
Median Daily Rate
% Change
on Same Period
Last Year
Live
Jobs
Central London -8 45 £575 +1.77% 73
East London +27 11 £585 +8.33% 16
West London +12 6 £297 -47.26% 15
South London +3 3 £555 - 8
Legal
England

Legal
Co-occurring Skills and Capabilities in London by Category

The follow tables expand on the table above by listing co-occurrences grouped by category. The same employment type, locality and period is covered with up to 20 co-occurrences shown in each of the following categories:

Application Platforms
1 9 (2.90%) SharePoint
2 7 (2.26%) Microsoft Exchange
3 6 (1.94%) CMS
4 4 (1.29%) Apache
5 2 (0.65%) Confluence
5 2 (0.65%) Drupal
6 1 (0.32%) Apache Airflow
6 1 (0.32%) ArcGIS
6 1 (0.32%) Facebook Platform
6 1 (0.32%) IIS
6 1 (0.32%) nginx
Applications
1 16 (5.16%) Microsoft Excel
2 15 (4.84%) Microsoft PowerPoint
3 9 (2.90%) Microsoft Office
4 5 (1.61%) MS Visio
5 4 (1.29%) Microsoft Project
6 3 (0.97%) Chatbot
6 3 (0.97%) Trello
7 1 (0.32%) Adobe Creative Suite
7 1 (0.32%) Adobe Premiere
7 1 (0.32%) FileZilla
Business Applications
1 5 (1.61%) SAP S/4HANA
2 2 (0.65%) Actimize
2 2 (0.65%) Relativity
2 2 (0.65%) SAP ERP
3 1 (0.32%) Oracle ERP
3 1 (0.32%) Orchestrade
3 1 (0.32%) SAP CO
3 1 (0.32%) SAP FI
3 1 (0.32%) SAP FI/CO
3 1 (0.32%) SAP GRC
3 1 (0.32%) SAP GTS
3 1 (0.32%) SAP Payroll
3 1 (0.32%) SAP R/3
3 1 (0.32%) Visualfiles
3 1 (0.32%) Workday HCM
Cloud Services
1 28 (9.03%) Azure
2 22 (7.10%) Microsoft 365
3 20 (6.45%) SaaS
4 14 (4.52%) AWS
5 8 (2.58%) Microsoft Purview
5 8 (2.58%) OneDrive
6 7 (2.26%) Cloud Computing
6 7 (2.26%) Entra ID
7 5 (1.61%) GCP
7 5 (1.61%) Power Platform
8 4 (1.29%) Figma
8 4 (1.29%) Google Workspace
9 3 (0.97%) Amazon SageMaker
9 3 (0.97%) Anthropic Claude
9 3 (0.97%) Collibra
9 3 (0.97%) GitHub
9 3 (0.97%) GitHub Actions
9 3 (0.97%) IaaS
9 3 (0.97%) PaaS
10 2 (0.65%) Vertex AI
Communications & Networking
1 8 (2.58%) DNS
1 8 (2.58%) VPN
1 8 (2.58%) WAN
2 7 (2.26%) Firewall
2 7 (2.26%) SD-WAN
3 5 (1.61%) LAN
3 5 (1.61%) TCP/IP
4 4 (1.29%) MPLS
5 3 (0.97%) Cisco Nexus
5 3 (0.97%) Internet
5 3 (0.97%) SAN
5 3 (0.97%) SMTP
5 3 (0.97%) Wireless
6 2 (0.65%) HTTP
6 2 (0.65%) Intranet
7 1 (0.32%) DMARC
7 1 (0.32%) IPsec
7 1 (0.32%) WebEx
7 1 (0.32%) Wi-Fi
7 1 (0.32%) WinSCP
Database & Business Intelligence
1 9 (2.90%) Data Warehouse
2 7 (2.26%) Metadata
2 7 (2.26%) Tableau
3 6 (1.94%) Big Data
4 5 (1.61%) Data Lake
4 5 (1.61%) Power BI
4 5 (1.61%) SQL Server
5 3 (0.97%) Elasticsearch
6 2 (0.65%) EDRMS
6 2 (0.65%) MS Access
6 2 (0.65%) MySQL
6 2 (0.65%) PostgreSQL
7 1 (0.32%) BusinessObjects
7 1 (0.32%) GIS
7 1 (0.32%) InterSystems Cache
7 1 (0.32%) NoSQL
7 1 (0.32%) SAP HANA
7 1 (0.32%) SQL Server Reporting Services
7 1 (0.32%) Tableau Desktop
7 1 (0.32%) Tableau Server
Development Applications
1 13 (4.19%) JIRA
2 4 (1.29%) Jenkins
3 3 (0.97%) Bitbucket
3 3 (0.97%) SonarQube
3 3 (0.97%) Sonatype Nexus
4 1 (0.32%) GitLab
4 1 (0.32%) MSI
4 1 (0.32%) Pa11y
4 1 (0.32%) SQL Server Management Studio (SSMS)
General
1 124 (40.00%) Finance
2 107 (34.52%) Social Skills
3 48 (15.48%) Analytical Skills
4 37 (11.94%) Law
5 25 (8.06%) Banking
6 18 (5.81%) Marketing
7 15 (4.84%) Public Sector
8 11 (3.55%) Pharmaceutical
9 10 (3.23%) Front Office
10 9 (2.90%) Publishing
11 8 (2.58%) Influencing Skills
11 8 (2.58%) Telecoms
12 7 (2.26%) Financial Institution
12 7 (2.26%) Presentation Skills
13 5 (1.61%) Documentation Skills
13 5 (1.61%) Retail
14 4 (1.29%) Inclusion and Diversity
14 4 (1.29%) Investment Banking
15 3 (0.97%) German Language
15 3 (0.97%) Manufacturing
Job Titles
1 47 (15.16%) Project Manager
2 43 (13.87%) Analyst
3 31 (10.00%) Lead
4 25 (8.06%) Architect
5 24 (7.74%) Business Analyst
6 23 (7.42%) Senior
7 17 (5.48%) Developer
8 11 (3.55%) Consultant
8 11 (3.55%) IT Manager
8 11 (3.55%) Procurement Manager
9 10 (3.23%) Solutions Architect
10 9 (2.90%) Designer
11 8 (2.58%) Product Manager
11 8 (2.58%) Security Architect
11 8 (2.58%) Senior Manager
12 7 (2.26%) Programme Manager
12 7 (2.26%) Senior Project Manager
13 6 (1.94%) Artificial Intelligence Engineer
13 6 (1.94%) Business Manager
13 6 (1.94%) Data Analyst
Libraries, Frameworks & Software Standards
1 7 (2.26%) HTML
2 6 (1.94%) CSS
3 5 (1.61%) .NET
4 3 (0.97%) Apache NiFi
4 3 (0.97%) ASP.NET
4 3 (0.97%) ASP.NET Core
4 3 (0.97%) Jinja
4 3 (0.97%) RabbitMQ
5 2 (0.65%) .NET Framework
5 2 (0.65%) Django
5 2 (0.65%) Gradio
5 2 (0.65%) LangChain
5 2 (0.65%) Oracle Fusion
6 1 (0.32%) JSON
6 1 (0.32%) LDAP
6 1 (0.32%) Middleware
6 1 (0.32%) ODBC
6 1 (0.32%) Visualforce
6 1 (0.32%) Web Services
6 1 (0.32%) XML
Miscellaneous
1 13 (4.19%) Product Ownership
2 12 (3.87%) Management Information System
3 11 (3.55%) Onboarding
4 9 (2.90%) Data Centre
4 9 (2.90%) Security Posture
5 7 (2.26%) Self-Motivation
6 6 (1.94%) Low-Code
6 6 (1.94%) Mobile App
7 5 (1.61%) Data Protection Act
8 4 (1.29%) Legacy Systems
8 4 (1.29%) NHS
8 4 (1.29%) Public Cloud
8 4 (1.29%) Replication
8 4 (1.29%) Security Operations Centre
9 3 (0.97%) Analytical Mindset
9 3 (0.97%) Cyber Defence
9 3 (0.97%) Insider Threat
9 3 (0.97%) Market Risk
9 3 (0.97%) Private Cloud
9 3 (0.97%) Social Media
Operating Systems
1 22 (7.10%) Windows
2 6 (1.94%) Linux
3 5 (1.61%) Windows 10
3 5 (1.61%) Windows Server
4 3 (0.97%) CentOS
4 3 (0.97%) Red Hat Enterprise Linux
5 2 (0.65%) Mac OS
6 1 (0.32%) Android
6 1 (0.32%) Windows Server 2012
6 1 (0.32%) Windows Server 2019
Processes & Methodologies
1 69 (22.26%) Project Management
2 55 (17.74%) Problem-Solving
3 53 (17.10%) Risk Management
4 51 (16.45%) Agile
5 50 (16.13%) Stakeholder Management
6 39 (12.58%) Artificial Intelligence
7 34 (10.97%) Stakeholder Engagement
8 31 (10.00%) Cybersecurity
9 28 (9.03%) Migration
10 24 (7.74%) Decision-Making
11 23 (7.42%) Analytics
12 21 (6.77%) Roadmaps
13 20 (6.45%) ERP
14 18 (5.81%) Change Management
14 18 (5.81%) Continuous Improvement
14 18 (5.81%) Data Protection
15 17 (5.48%) Machine Learning
15 17 (5.48%) Process Improvement
16 16 (5.16%) ITIL
16 16 (5.16%) User Experience
Programming Languages
1 21 (6.77%) Python
2 19 (6.13%) SQL
3 7 (2.26%) C#
4 6 (1.94%) JavaScript
5 5 (1.61%) PowerShell
6 2 (0.65%) Bash
6 2 (0.65%) Kusto Query Language
6 2 (0.65%) R
6 2 (0.65%) VBA
7 1 (0.32%) Dart
7 1 (0.32%) Go
7 1 (0.32%) TypeScript
Qualifications
1 38 (12.26%) Degree
2 35 (11.29%) Security Cleared
3 29 (9.35%) SC Cleared
4 12 (3.87%) CISM
4 12 (3.87%) CISSP
4 12 (3.87%) PMI Certification
4 12 (3.87%) PMP
5 7 (2.26%) DV Cleared
5 7 (2.26%) Master's Degree
6 6 (1.94%) CISA
7 5 (1.61%) Azure Certification
8 4 (1.29%) ITIL Certification
8 4 (1.29%) Microsoft Certification
9 3 (0.97%) ACCA
9 3 (0.97%) Computer Science Degree
9 3 (0.97%) SAP Certification
10 2 (0.65%) CIPD
10 2 (0.65%) CRISC
10 2 (0.65%) EMC Certification
10 2 (0.65%) TOGAF Certification
Quality Assurance & Compliance
1 26 (8.39%) GDPR
2 18 (5.81%) NIST
3 9 (2.90%) ISO/IEC 27001
4 7 (2.26%) Accessibility
4 7 (2.26%) EU AI Act
5 5 (1.61%) Data Quality
5 5 (1.61%) HIPAA
5 5 (1.61%) QA
6 4 (1.29%) GRC
6 4 (1.29%) MiFID
6 4 (1.29%) PMO
6 4 (1.29%) PSD2
7 3 (0.97%) California Consumer Privacy Act
7 3 (0.97%) EMIR
7 3 (0.97%) Sarbanes-Oxley
7 3 (0.97%) SEPA
7 3 (0.97%) SLA
7 3 (0.97%) SOC 2
7 3 (0.97%) WCAG
8 2 (0.65%) PCI DSS
System Software
1 15 (4.84%) Active Directory
2 6 (1.94%) VMware Infrastructure
3 3 (0.97%) Docker
3 3 (0.97%) Hyper-V
3 3 (0.97%) vCloud
3 3 (0.97%) Virtual Servers
3 3 (0.97%) VMware Workstation
3 3 (0.97%) vSphere
Systems Management
1 8 (2.58%) Microsoft Intune
2 4 (1.29%) SCCM
3 3 (0.97%) CASB
3 3 (0.97%) Cisco Prime
3 3 (0.97%) Kibana
3 3 (0.97%) Kubernetes
3 3 (0.97%) Terraform
4 2 (0.65%) AirWatch
4 2 (0.65%) Symantec Enterprise Vault
5 1 (0.32%) Ansible
5 1 (0.32%) CSIRT
5 1 (0.32%) Progress Chef
5 1 (0.32%) Puppet
5 1 (0.32%) QRadar
5 1 (0.32%) Salt
Vendors
1 47 (15.16%) Microsoft
2 25 (8.06%) SAP
3 16 (5.16%) ServiceNow
4 12 (3.87%) Google
5 9 (2.90%) Workday
6 8 (2.58%) Salesforce
7 7 (2.26%) Cisco
7 7 (2.26%) Oracle
8 6 (1.94%) Ariba
8 6 (1.94%) iManage
8 6 (1.94%) VMware
9 5 (1.61%) Dell
9 5 (1.61%) Palo Alto
10 4 (1.29%) Aruba
10 4 (1.29%) EMC
11 3 (0.97%) Alteryx
11 3 (0.97%) CrowdStrike
11 3 (0.97%) Instagram
11 3 (0.97%) Intapp
11 3 (0.97%) SolarWinds