Oracle Contracts in London

Oracle
England > London

The table below provides summary statistics for contract job vacancies advertised in London requiring knowledge or experience of Oracle products and/or services. It includes a benchmarking guide to contractor rates offered in vacancies that cited Oracle over the 6 months leading up to 30 May 2025, comparing them to the same period in the previous two years.

The figures below represent the IT contractor job market in general and are not representative of contractor rates within the Oracle Corporation.

6 months to
30 May 2025
Same period 2024 Same period 2023
Rank 32 36 38
Rank change year-on-year +4 +2 +7
Contract jobs citing Oracle 752 894 1,383
As % of all contract jobs advertised in London 6.18% 5.11% 5.43%
As % of the Vendors category 13.58% 12.50% 13.70%
Number of daily rates quoted 504 589 919
10th Percentile £385 £374 £400
25th Percentile £414 £450 £463
Median daily rate (50th Percentile) £550 £550 £575
Median % change year-on-year - -4.35% -1.71%
75th Percentile £725 £688 £727
90th Percentile £825 £775 £825
England median daily rate £530 £550 £550
% change year-on-year -3.64% - -
Number of hourly rates quoted 8 7 7
10th Percentile £21.85 - £36.91
25th Percentile - £18.25 £48.75
Median hourly rate £22.27 £19.50 £62.50
Median % change year-on-year +14.21% -68.80% +75.44%
75th Percentile £23.69 £26.50 £68.75
90th Percentile £46.35 - £74.65
England median hourly rate £30.40 £26.00 £62.50
% change year-on-year +16.92% -58.40% +78.57%

All Vendors
London

Oracle falls under the Vendor Products and Services category. For comparison with the information above, the following table provides summary statistics for all contract job vacancies requiring knowledge or experience of all vendor products and services in London.

Contract vacancies with a requirement for knowledge or experience of vendor products and services 5,538 7,154 10,093
As % of all contract IT jobs advertised in London 45.51% 40.92% 39.66%
Number of daily rates quoted 3,598 4,919 7,167
10th Percentile £330 £300 £331
25th Percentile £425 £425 £450
Median daily rate (50th Percentile) £545 £538 £568
Median % change year-on-year +1.30% -5.20% +3.18%
75th Percentile £675 £650 £688
90th Percentile £775 £775 £798
England median daily rate £520 £518 £535
% change year-on-year +0.48% -3.27% +1.90%
Number of hourly rates quoted 100 130 125
10th Percentile £15.84 £13.87 £16.13
25th Percentile £22.27 £17.00 £21.00
Median hourly rate £28.55 £23.65 £27.50
Median % change year-on-year +20.72% -14.00% -21.43%
75th Percentile £42.25 £38.25 £53.75
90th Percentile £63.88 £65.00 £70.00
England median hourly rate £26.48 £22.50 £37.50
% change year-on-year +17.67% -40.00% +74.42%

Oracle
Job Vacancy Trend in London

Job postings citing Oracle as a proportion of all IT jobs advertised in London.
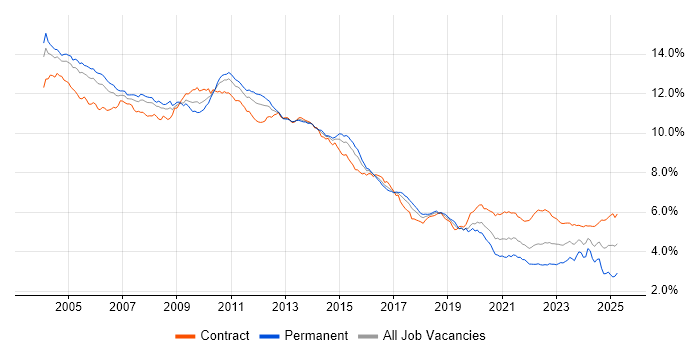
Job vacancy trend for Oracle in London

Oracle
Contractor Daily Rate Trend in London

3-month moving average daily rate quoted in jobs citing Oracle in London.

Daily rate trend for Oracle in London

Oracle
Daily Rate Histogram in London

Daily rate distribution for jobs citing Oracle in London over the 6 months to 30 May 2025.

Daily rate histogram for Oracle in London

Oracle
Contractor Hourly Rate Trend in London

3-month moving average hourly rates quoted in jobs citing Oracle in London.

Hourly rate trend for Oracle in London

Oracle
Hourly Rate Histogram in London

Hourly rate distribution of jobs citing Oracle in London over the 6 months to 30 May 2025.

Hourly rate histogram for Oracle in London

Oracle
Contract Job Locations in London

The table below looks at the demand and provides a guide to the median contractor rates quoted in IT jobs citing Oracle within the London region over the 6 months to 30 May 2025. The 'Rank Change' column provides an indication of the change in demand within each location based on the same 6 month period last year.

Location Rank Change
on Same Period
Last Year
Matching
Contract
IT Job Ads
Median
Daily Rate
Past 6 Months
Median Daily Rate
% Change
on Same Period
Last Year
Live
Jobs
Central London -1 111 £500 -12.09% 48
West London +10 9 £475 - 117
East London +10 7 £415 +3.75% 9
South London -10 4 £620 +24.00% 3
Oracle
England

Oracle
Co-occurring Skills and Capabilities in London by Category

The follow tables expand on the table above by listing co-occurrences grouped by category. The same employment type, locality and period is covered with up to 20 co-occurrences shown in each of the following categories:

Application Platforms
1 22 (2.93%) Confluence
2 20 (2.66%) Oracle Workflow
3 14 (1.86%) IIS
4 13 (1.73%) Oracle Coherence
5 12 (1.60%) SAS
6 11 (1.46%) WebSphere
7 10 (1.33%) WebLogic
8 9 (1.20%) Apache
8 9 (1.20%) Oracle SOA Suite
8 9 (1.20%) SharePoint
9 8 (1.06%) GemFire
9 8 (1.06%) JBoss
10 6 (0.80%) Apache Spark
11 5 (0.66%) Oracle Self-Service HR
12 4 (0.53%) BizTalk Server
13 3 (0.40%) Microsoft Exchange
14 2 (0.27%) ArcGIS
14 2 (0.27%) CMS
14 2 (0.27%) Tomcat
14 2 (0.27%) WebSphere Application Server
Applications
1 62 (8.24%) Microsoft Excel
2 23 (3.06%) Oracle Smart View
3 7 (0.93%) Microsoft Office
4 5 (0.66%) MS Visio
5 4 (0.53%) Microsoft PowerPoint
6 3 (0.40%) Microsoft Project
7 1 (0.13%) Chatbot
7 1 (0.13%) Notepad++
Business Applications
1 59 (7.85%) Oracle EBS
2 47 (6.25%) Oracle Payables
3 38 (5.05%) Oracle General Ledger
4 33 (4.39%) Oracle Assets
5 27 (3.59%) Oracle Financials
6 24 (3.19%) Oracle Receivables
7 23 (3.06%) Oracle EBS R12
8 19 (2.53%) Oracle E-Business Tax
9 18 (2.39%) Oracle ERP
10 16 (2.13%) Oracle BPM
11 15 (1.99%) Oracle Cash Management
12 13 (1.73%) FLEXCUBE
13 11 (1.46%) Oracle Procure-to-Pay
14 10 (1.33%) SAP S/4HANA
15 6 (0.80%) Oracle Payroll
15 6 (0.80%) Unit4 Business World
16 5 (0.66%) Oracle Applications
17 4 (0.53%) Cognos Business Intelligence
18 3 (0.40%) Actimize
18 3 (0.40%) OpenText MBPM
Cloud Services
1 105 (13.96%) AWS
2 98 (13.03%) OCI
3 96 (12.77%) Azure
4 41 (5.45%) SaaS
5 37 (4.92%) Power Platform
6 23 (3.06%) GCP
7 21 (2.79%) Amazon S3
8 19 (2.53%) Cloud Computing
8 19 (2.53%) PaaS
9 17 (2.26%) Serverless
10 16 (2.13%) AWS Lambda
11 13 (1.73%) GitHub
11 13 (1.73%) OpenShift
12 11 (1.46%) IaaS
13 8 (1.06%) Amazon SageMaker
13 8 (1.06%) AWS CodeCommit
13 8 (1.06%) Cloud9 IDE
13 8 (1.06%) Snowflake
13 8 (1.06%) Textract
14 7 (0.93%) Azure Stack
Communications & Networking
1 19 (2.53%) Firewall
2 14 (1.86%) Internet
3 7 (0.93%) DNS
4 5 (0.66%) DHCP
4 5 (0.66%) Network Security
4 5 (0.66%) TCP/IP
5 4 (0.53%) HTTP
5 4 (0.53%) VPN
6 3 (0.40%) Kerberos
6 3 (0.40%) NAS
6 3 (0.40%) SAN
6 3 (0.40%) Wireshark
7 2 (0.27%) FIX Connectivity
7 2 (0.27%) IPsec
7 2 (0.27%) LAN
7 2 (0.27%) WAN
8 1 (0.13%) HDSL
8 1 (0.13%) HTTPS
8 1 (0.13%) VLAN
8 1 (0.13%) Wi-Fi
Database & Business Intelligence
1 132 (17.55%) Oracle Database
2 124 (16.49%) SQL Server
3 78 (10.37%) Oracle Reports
4 42 (5.59%) PostgreSQL
5 41 (5.45%) Data Warehouse
6 37 (4.92%) Oracle BI Publisher
7 36 (4.79%) Relational Database
8 33 (4.39%) Power BI
9 26 (3.46%) MongoDB
10 22 (2.93%) Oracle ODI
11 21 (2.79%) MySQL
11 21 (2.79%) Tableau
12 18 (2.39%) NoSQL
13 16 (2.13%) RDBMS
14 14 (1.86%) Amazon RDS
14 14 (1.86%) DB2
14 14 (1.86%) SQL Server Reporting Services
15 13 (1.73%) Big Data
16 11 (1.46%) Amazon Redshift
17 9 (1.20%) BigQuery
Development Applications
1 69 (9.18%) JIRA
2 34 (4.52%) Jenkins
3 18 (2.39%) Git
4 16 (2.13%) Oracle Forms
5 12 (1.60%) Subversion
6 9 (1.20%) GitLab
6 9 (1.20%) Toad
7 8 (1.06%) JUnit
7 8 (1.06%) SoapUI
8 7 (0.93%) ERwin
8 7 (0.93%) Maven
8 7 (0.93%) TeamCity
9 6 (0.80%) Ant
9 6 (0.80%) Visual Studio
10 5 (0.66%) IBM UrbanCode
10 5 (0.66%) Mockito
10 5 (0.66%) Postman
10 5 (0.66%) REST Assured
11 4 (0.53%) SQL Server Management Studio (SSMS)
12 3 (0.40%) Zephyr
General
1 368 (48.94%) Finance
2 240 (31.91%) Social Skills
3 138 (18.35%) Banking
4 135 (17.95%) Analytical Skills
5 74 (9.84%) Public Sector
6 35 (4.65%) General Ledger
7 29 (3.86%) Front Office
8 23 (3.06%) Investment Banking
9 19 (2.53%) Military
10 15 (1.99%) Presentation Skills
11 14 (1.86%) Retail
12 13 (1.73%) Manufacturing
13 11 (1.46%) Local Government
14 10 (1.33%) Documentation Skills
14 10 (1.33%) Financial Institution
14 10 (1.33%) Inclusion and Diversity
15 8 (1.06%) Organisational Skills
16 7 (0.93%) Back Office
17 6 (0.80%) Legal
17 6 (0.80%) Retail Banking
Job Titles
1 209 (27.79%) Developer
2 105 (13.96%) Architect
3 85 (11.30%) Analyst
4 82 (10.90%) Consultant
5 74 (9.84%) C# Developer
6 63 (8.38%) Senior
7 52 (6.91%) Oracle Consultant
8 43 (5.72%) .NET Developer
9 42 (5.59%) Lead
10 41 (5.45%) Oracle Developer
11 40 (5.32%) C# .NET Developer
12 31 (4.12%) C# WPF Developer
12 31 (4.12%) WPF Developer
13 30 (3.99%) Oracle Architect
14 29 (3.86%) Data Analyst
15 25 (3.32%) Java Developer
16 22 (2.93%) Oracle Analyst
17 21 (2.79%) Oracle Functional Consultant
18 20 (2.66%) Solutions Architect
18 20 (2.66%) Technical Architect
Libraries, Frameworks & Software Standards
1 105 (13.96%) .NET
2 93 (12.37%) Oracle Fusion
3 48 (6.38%) Kafka
4 42 (5.59%) Web Services
5 38 (5.05%) .NET Framework
5 38 (5.05%) AngularJS
6 35 (4.65%) WPF
7 29 (3.86%) XML
8 28 (3.72%) WCF
9 25 (3.32%) REST
10 24 (3.19%) ASP.NET
10 24 (3.19%) Middleware
10 24 (3.19%) SOAP
10 24 (3.19%) Spring
11 22 (2.93%) .NET Core
12 17 (2.26%) React
12 17 (2.26%) Reactive Extensions
12 17 (2.26%) RESTful
13 15 (1.99%) HTML
14 14 (1.86%) Spring Boot
Miscellaneous
1 27 (3.59%) Legacy Systems
1 27 (3.59%) Management Information System
2 26 (3.46%) Foreign Exchange (FX)
3 24 (3.19%) Enterprise Software
4 16 (2.13%) Data Structures
4 16 (2.13%) Distributed Systems
5 14 (1.86%) Legacy Applications
6 13 (1.73%) Public Cloud
7 12 (1.60%) SWIFT Messaging Network
8 10 (1.33%) Data Protection Act
8 10 (1.33%) Onboarding
8 10 (1.33%) Product Ownership
9 8 (1.06%) Algorithms
10 7 (0.93%) Cloud Native
10 7 (0.93%) Clustering
10 7 (0.93%) Data Centre
10 7 (0.93%) Derivative
10 7 (0.93%) Reference Data
10 7 (0.93%) Replication
10 7 (0.93%) Security Posture
Operating Systems
1 86 (11.44%) Windows
2 77 (10.24%) Linux
3 48 (6.38%) Unix
4 14 (1.86%) Red Hat Enterprise Linux
5 11 (1.46%) Windows Server
6 9 (1.20%) AIX
7 6 (0.80%) Oracle Linux
7 6 (0.80%) Solaris
8 3 (0.40%) CentOS
8 3 (0.40%) VMS
9 2 (0.27%) Rocky
10 1 (0.13%) Amazon Linux
10 1 (0.13%) HPUX
10 1 (0.13%) Ubuntu
Processes & Methodologies
1 190 (25.27%) Agile
2 138 (18.35%) Problem-Solving
3 110 (14.63%) DevOps
4 101 (13.43%) Migration
5 89 (11.84%) ERP
6 79 (10.51%) Analytics
7 78 (10.37%) Data Modelling
8 71 (9.44%) Business Intelligence
9 63 (8.38%) Stakeholder Management
10 59 (7.85%) Software Engineering
11 58 (7.71%) User Acceptance Testing
12 57 (7.58%) CI/CD
13 56 (7.45%) Data Migration
14 54 (7.18%) Computer Science
14 54 (7.18%) Data Analysis
15 47 (6.25%) Validation
16 46 (6.12%) Visualisation
17 44 (5.85%) Microservices
18 42 (5.59%) Test Automation
19 41 (5.45%) Roadmaps
Programming Languages
1 329 (43.75%) SQL
2 136 (18.09%) PL/SQL
3 122 (16.22%) Java
4 112 (14.89%) C#
5 97 (12.90%) Python
6 45 (5.98%) JavaScript
7 36 (4.79%) VBA
8 35 (4.65%) VB
9 28 (3.72%) C++
10 23 (3.06%) T-SQL
10 23 (3.06%) TypeScript
11 19 (2.53%) Shell Script
12 18 (2.39%) VB.NET
13 16 (2.13%) Perl
14 14 (1.86%) Bash
15 8 (1.06%) Groovy
15 8 (1.06%) PowerShell
16 6 (0.80%) Go
17 5 (0.66%) R
17 5 (0.66%) Scala
Qualifications
1 131 (17.42%) Security Cleared
2 117 (15.56%) SC Cleared
3 86 (11.44%) Degree
4 29 (3.86%) Computer Science Degree
5 11 (1.46%) DV Cleared
6 10 (1.33%) Azure Certification
7 8 (1.06%) Numerate Degree
8 7 (0.93%) AWS Certification
8 7 (0.93%) OCP
8 7 (0.93%) Oracle Certification
8 7 (0.93%) PMI Certification
9 6 (0.80%) AAT
9 6 (0.80%) BPSS Clearance
10 5 (0.66%) CCAB
11 3 (0.40%) CIPFA
11 3 (0.40%) PMP
11 3 (0.40%) SAP Certification
12 2 (0.27%) CEH
12 2 (0.27%) CIMA
12 2 (0.27%) PRINCE2 Certification
Quality Assurance & Compliance
1 44 (5.85%) QA
2 30 (3.99%) Data Quality
3 15 (1.99%) GDPR
3 15 (1.99%) Sarbanes-Oxley
4 9 (1.20%) ISO 20022
4 9 (1.20%) ISO/IEC 27001
5 7 (0.93%) NIST
5 7 (0.93%) SEPA
6 6 (0.80%) ISO/IEC 27002 (supersedes ISO/IEC 17799)
7 5 (0.66%) PCI DSS
7 5 (0.66%) SLA
8 3 (0.40%) COREP
8 3 (0.40%) GAAP
8 3 (0.40%) MiFID
8 3 (0.40%) PMO
9 2 (0.27%) Actionable Recommendations
9 2 (0.27%) IFRS
9 2 (0.27%) ISO 15022
9 2 (0.27%) ITGC
10 1 (0.13%) Accessibility
System Software
1 26 (3.46%) Docker
2 13 (1.73%) VMware Infrastructure
3 10 (1.33%) Virtual Machines
4 9 (1.20%) Active Directory
5 8 (1.06%) GridGain
5 8 (1.06%) Oracle RAC
6 5 (0.66%) Tivoli Workload Scheduler
7 3 (0.40%) VMware ESXi
8 2 (0.27%) Veritas Cluster Server
9 1 (0.13%) NFS
9 1 (0.13%) Veritas File System
9 1 (0.13%) Veritas Volume Manager
9 1 (0.13%) Virtual Desktop
Systems Management
1 35 (4.65%) Kubernetes
2 30 (3.99%) Ansible
3 17 (2.26%) Terraform
4 11 (1.46%) Data Guard
5 10 (1.33%) Puppet
6 8 (1.06%) Oracle Enterprise Manager
6 8 (1.06%) Tivoli
6 8 (1.06%) VxRail
7 7 (0.93%) Oracle RMAN
8 6 (0.80%) Progress Chef
9 5 (0.66%) CEMLI
10 4 (0.53%) Control-M
11 3 (0.40%) Prometheus
12 2 (0.27%) EMC NetWorker
12 2 (0.27%) Grafana
12 2 (0.27%) Podman
12 2 (0.27%) QRadar
12 2 (0.27%) Rundeck
12 2 (0.27%) Tivoli Storage Manager
12 2 (0.27%) ZABBIX
Vendors
1 67 (8.91%) Microsoft
2 61 (8.11%) SAP
3 32 (4.26%) IBM
4 26 (3.46%) ServiceNow
5 22 (2.93%) Red Hat
6 18 (2.39%) Salesforce
7 17 (2.26%) Informatica
8 16 (2.13%) VMware
9 14 (1.86%) Splunk
10 13 (1.73%) Citrix
10 13 (1.73%) Sybase
11 12 (1.60%) MuleSoft
11 12 (1.60%) Workday
12 11 (1.46%) Google
13 10 (1.33%) EMC
14 9 (1.20%) Databricks
14 9 (1.20%) Siebel
14 9 (1.20%) TIBCO
15 7 (0.93%) CyberArk
15 7 (0.93%) UiPath