QA Contract Job Trends in London

Quality Assurance (QA)
England > London

The table below provides summary statistics and contractor rates for jobs advertised in London requiring QA skills. It covers vacancies from the 6 months leading up to 26 September 2025, with comparisons to the same periods in the previous two years.

6 months to
26 Sep 2025
Same period 2024 Same period 2023
Rank 61 65 61
Rank change year-on-year +4 -4 +12
Contract jobs citing QA 551 588 836
As % of all contract jobs advertised in London 4.09% 3.61% 3.86%
As % of the Quality Assurance & Compliance category 23.59% 26.29% 27.25%
Number of daily rates quoted 378 375 662
10th Percentile £313 £300 £360
25th Percentile £400 £390 £431
Median daily rate (50th Percentile) £500 £495 £550
Median % change year-on-year +1.01% -10.00% -
75th Percentile £605 £601 £710
90th Percentile £688 £798 £798
England median daily rate £475 £488 £525
% change year-on-year -2.56% -7.14% -
Number of hourly rates quoted 8 4 11
10th Percentile £30.29 £48.56 £19.00
25th Percentile £31.49 £59.53 £21.25
Median hourly rate £34.50 £68.75 £27.50
Median % change year-on-year -49.82% +150.00% +66.67%
75th Percentile £44.28 £73.59 £52.50
90th Percentile £47.65 £76.69 £53.75
England median hourly rate £15.96 £13.26 £50.00
% change year-on-year +20.36% -73.48% +62.60%

All Quality Assurance and Compliance Skills
London

QA falls under the Quality Assurance and Compliance category. For comparison with the information above, the following table provides summary statistics for all contract job vacancies requiring quality assurance or compliance skills in London.

Contract vacancies with a requirement for quality assurance or compliance skills 2,336 2,237 3,068
As % of all contract IT jobs advertised in London 17.33% 13.72% 14.15%
Number of daily rates quoted 1,550 1,420 2,298
10th Percentile £325 £331 £363
25th Percentile £413 £425 £450
Median daily rate (50th Percentile) £525 £550 £561
Median % change year-on-year -4.55% -2.00% +2.05%
75th Percentile £650 £688 £700
90th Percentile £750 £800 £798
England median daily rate £500 £525 £538
% change year-on-year -4.76% -2.33% +2.38%
Number of hourly rates quoted 50 42 40
10th Percentile £24.91 £18.13 £16.83
25th Percentile £25.15 £23.80 £19.75
Median hourly rate £34.00 £29.73 £28.13
Median % change year-on-year +14.36% +5.71% +33.93%
75th Percentile £41.75 £49.69 £44.15
90th Percentile £54.05 £71.88 £62.03
England median hourly rate £32.50 £33.93 £36.00
% change year-on-year -4.21% -5.75% +61.22%

QA
Job Vacancy Trend in London

Job postings citing QA as a proportion of all IT jobs advertised in London.
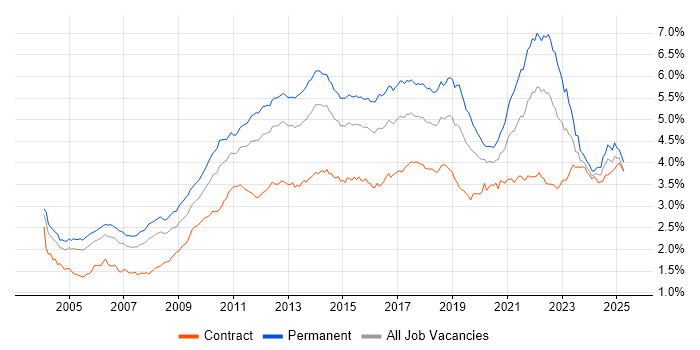
Job vacancy trend for QA in London

QA
Daily Rate Trend in London

Contractor daily rate distribution trend for jobs in London citing QA.

Contractor daily rate distribution trend for jobs in London citing QA

QA
Daily Rate Histogram in London

Daily rate distribution for jobs citing QA in London over the 6 months to 26 September 2025.

Daily rate histogram for QA in London

QA
Hourly Rate Trend in London

Contractor hourly rate distribution trend for jobs in London citing QA.

Contractor hourly rate distribution trend for jobs in London citing QA

QA
Hourly Rate Histogram in London

Hourly rate distribution of jobs citing QA in London over the 6 months to 26 September 2025.

Hourly rate histogram for QA in London

QA
Contract Job Locations in London

The table below looks at the demand and provides a guide to the median contractor rates quoted in IT jobs citing QA within the London region over the 6 months to 26 September 2025. The 'Rank Change' column provides an indication of the change in demand within each location based on the same 6 month period last year.

Location Rank Change
on Same Period
Last Year
Matching
Contract
IT Job Ads
Median
Daily Rate
Past 6 Months
Median Daily Rate
% Change
on Same Period
Last Year
Live
Jobs
Central London -7 88 £557 +3.15% 154
West London +1 16 £364 -9.06% 22
South London -4 10 £582 +29.28% 9
East London +5 9 £520 +29.19% 19
North London -4 2 £550 +62.96% 3
QA
England

QA
Co-occurring Skills and Capabilities in London by Category

The follow tables expand on the table above by listing co-occurrences grouped by category. The same employment type, locality and period is covered with up to 20 co-occurrences shown in each of the following categories:

Application Platforms
1 43 (7.80%) Confluence
2 10 (1.81%) IIS
3 9 (1.63%) Apache
3 9 (1.63%) SharePoint
4 8 (1.45%) Apache Airflow
4 8 (1.45%) Apache Spark
4 8 (1.45%) CMS
5 7 (1.27%) Oracle Workflow
6 5 (0.91%) Anypoint
7 4 (0.73%) MQSeries
8 3 (0.54%) Adobe Experience Manager
8 3 (0.54%) Drupal
8 3 (0.54%) Jupyter
9 2 (0.36%) Sitecore CMS
9 2 (0.36%) WordPress
10 1 (0.18%) ArcGIS
10 1 (0.18%) JBoss
10 1 (0.18%) Moodle
10 1 (0.18%) SugarCRM
10 1 (0.18%) WebSphere
Applications
1 36 (6.53%) Microsoft Excel
2 15 (2.72%) MS Visio
3 11 (2.00%) Microsoft Office
4 8 (1.45%) Microsoft PowerPoint
5 7 (1.27%) Microsoft Project
6 3 (0.54%) Autodesk Inventor
6 3 (0.54%) Sketch
6 3 (0.54%) Trello
7 2 (0.36%) Spreadsheet
8 1 (0.18%) Chatbot
8 1 (0.18%) EViews
Business Applications
1 15 (2.72%) SAP S/4HANA
2 7 (1.27%) OpenText MBPM
2 7 (1.27%) Oracle BPM
2 7 (1.27%) Temenos T24
3 6 (1.09%) Dynamics CRM
4 5 (0.91%) ION Anvil
5 4 (0.73%) Unit4 Business World
6 3 (0.54%) Endur
6 3 (0.54%) SAP ERP
6 3 (0.54%) SAP MDG
7 2 (0.36%) Oracle Cash Management
7 2 (0.36%) Oracle EBS
7 2 (0.36%) Oracle EBS R12
7 2 (0.36%) Oracle General Ledger
7 2 (0.36%) Oracle Procure-to-Pay
7 2 (0.36%) Payment Gateway
8 1 (0.18%) Oracle Assets
8 1 (0.18%) Oracle Payables
8 1 (0.18%) Oracle Receivables
8 1 (0.18%) Oracle Subledger Accounting
Cloud Services
1 95 (17.24%) Azure
2 89 (16.15%) AWS
3 34 (6.17%) GitHub
4 31 (5.63%) Azure DevOps
5 26 (4.72%) GCP
5 26 (4.72%) Power Platform
6 23 (4.17%) GitHub Actions
7 18 (3.27%) Serverless
8 15 (2.72%) AWS Lambda
9 14 (2.54%) SaaS
10 13 (2.36%) Amazon S3
11 12 (2.18%) Amazon EC2
12 11 (2.00%) Amazon CloudWatch
13 10 (1.81%) dbt
13 10 (1.81%) Dynamics 365
14 9 (1.63%) AWS CloudFormation
15 8 (1.45%) Snowflake
16 7 (1.27%) Amazon ECS
16 7 (1.27%) Amazon SQS
17 6 (1.09%) Azure Synapse Analytics
Communications & Networking
1 11 (2.00%) Internet
2 5 (0.91%) OpenLDAP
3 4 (0.73%) HTTP
3 4 (0.73%) WAN
4 3 (0.54%) LAN
4 3 (0.54%) SMS
5 2 (0.36%) SSL
6 1 (0.18%) Cisco IPT
6 1 (0.18%) DNS
6 1 (0.18%) Ethernet
6 1 (0.18%) Firewall
6 1 (0.18%) FIX Connectivity
6 1 (0.18%) MPLS
6 1 (0.18%) SSH
6 1 (0.18%) Structured Cabling
6 1 (0.18%) TCP/IP
6 1 (0.18%) TETRA
6 1 (0.18%) VoWiFi
6 1 (0.18%) Wi-Fi
6 1 (0.18%) Wireless
Database & Business Intelligence
1 40 (7.26%) SQL Server
2 28 (5.08%) PostgreSQL
3 22 (3.99%) Power BI
4 21 (3.81%) Relational Database
5 18 (3.27%) Data Warehouse
6 15 (2.72%) MongoDB
7 14 (2.54%) Oracle Database
8 12 (2.18%) BigQuery
9 11 (2.00%) MySQL
10 10 (1.81%) Big Data
10 10 (1.81%) NoSQL
11 8 (1.45%) Metadata
12 7 (1.27%) DynamoDB
12 7 (1.27%) Redis
12 7 (1.27%) Tableau
13 6 (1.09%) Amazon Redshift
13 6 (1.09%) Azure SQL Database
13 6 (1.09%) Data Lake
14 4 (0.73%) Amazon RDS
14 4 (0.73%) Oracle Reports
Development Applications
1 86 (15.61%) JIRA
2 43 (7.80%) Selenium
3 37 (6.72%) Git
4 36 (6.53%) Jenkins
5 34 (6.17%) Cucumber
6 25 (4.54%) GitLab
6 25 (4.54%) Postman
7 22 (3.99%) Cypress.io
8 18 (3.27%) JUnit
9 12 (2.18%) Appium
9 12 (2.18%) JMeter
10 11 (2.00%) WebDriver
11 9 (1.63%) REST Assured
11 9 (1.63%) SpecFlow
12 7 (1.27%) Maven
12 7 (1.27%) TestNG
12 7 (1.27%) webpack
13 6 (1.09%) XCUITest
14 5 (0.91%) Bitbucket
14 5 (0.91%) IntelliJ
General
1 227 (41.20%) Social Skills
2 177 (32.12%) Finance
3 96 (17.42%) Analytical Skills
4 82 (14.88%) Banking
5 38 (6.90%) Public Sector
6 24 (4.36%) Investment Banking
7 20 (3.63%) Front Office
7 20 (3.63%) Telecoms
8 19 (3.45%) Back Office
9 18 (3.27%) Marketing
10 17 (3.09%) Presentation Skills
11 14 (2.54%) Documentation Skills
12 12 (2.18%) Financial Institution
12 12 (2.18%) Legal
13 11 (2.00%) Manufacturing
14 10 (1.81%) Inclusion and Diversity
15 8 (1.45%) Influencing Skills
15 8 (1.45%) Retail
16 6 (1.09%) Law
17 5 (0.91%) Electronics
Job Titles
1 105 (19.06%) Analyst
2 72 (13.07%) Developer
3 65 (11.80%) Business Analyst
4 56 (10.16%) Senior
5 50 (9.07%) Lead
6 48 (8.71%) QA Engineer
7 35 (6.35%) Tester
8 22 (3.99%) Architect
9 19 (3.45%) QA Tester
10 17 (3.09%) Consultant
10 17 (3.09%) Java Engineer
11 16 (2.90%) Automation Tester
12 15 (2.72%) DevOps Engineer
12 15 (2.72%) Project Manager
12 15 (2.72%) Test Analyst
13 14 (2.54%) Automation Engineer
14 13 (2.36%) Senior Analyst
14 13 (2.36%) Test Engineer
14 13 (2.36%) Test Manager
15 12 (2.18%) C# Developer
Libraries, Frameworks & Software Standards
1 40 (7.26%) REST
2 39 (7.08%) .NET
3 30 (5.44%) React
4 29 (5.26%) HTML
5 28 (5.08%) CSS
6 25 (4.54%) Web Services
7 24 (4.36%) RESTful
8 21 (3.81%) Spring Boot
9 20 (3.63%) AngularJS
9 20 (3.63%) Spring
10 15 (2.72%) JSON
10 15 (2.72%) Playwright
11 13 (2.36%) .NET Framework
11 13 (2.36%) pytest
12 12 (2.18%) HTML5
12 12 (2.18%) Kafka
12 12 (2.18%) SOAP
12 12 (2.18%) WPF
13 11 (2.00%) Jest
13 11 (2.00%) jQuery
Miscellaneous
1 49 (8.89%) Product Ownership
2 21 (3.81%) Mobile App
3 20 (3.63%) Onboarding
4 16 (2.90%) Virtual Team
5 15 (2.72%) Analytical Mindset
6 14 (2.54%) Cloud Native
6 14 (2.54%) Management Information System
7 11 (2.00%) Distributed Systems
7 11 (2.00%) Reinsurance
8 10 (1.81%) Data Structures
9 9 (1.63%) Derivative
9 9 (1.63%) Fixed Income
9 9 (1.63%) SWIFT Messaging Network
10 8 (1.45%) Algorithms
11 7 (1.27%) CMDB
11 7 (1.27%) Data Protection Act
12 6 (1.09%) Greenfield Project
12 6 (1.09%) Self-Motivation
13 5 (0.91%) Foreign Exchange (FX)
13 5 (0.91%) PMI
Operating Systems
1 26 (4.72%) Windows
2 15 (2.72%) Android
2 15 (2.72%) Apple iOS
3 13 (2.36%) Linux
4 9 (1.63%) Unix
5 3 (0.54%) Windows 10
6 1 (0.18%) CentOS
6 1 (0.18%) Debian
6 1 (0.18%) Mac OS
6 1 (0.18%) Red Hat Enterprise Linux
6 1 (0.18%) Ubuntu
6 1 (0.18%) VMS
6 1 (0.18%) Windows Server
Processes & Methodologies
1 261 (47.37%) Agile
2 141 (25.59%) Test Automation
3 120 (21.78%) CI/CD
4 115 (20.87%) Problem-Solving
5 114 (20.69%) DevOps
6 79 (14.34%) Scrum
7 75 (13.61%) Stakeholder Management
8 68 (12.34%) User Acceptance Testing
9 58 (10.53%) Continuous Improvement
9 58 (10.53%) Test Scripting
9 58 (10.53%) Test Strategy
9 58 (10.53%) Validation
10 56 (10.16%) SDLC
11 55 (9.98%) Stakeholder Engagement
12 51 (9.26%) Microservices
13 46 (8.35%) User Stories
14 45 (8.17%) Data Analysis
14 45 (8.17%) Migration
15 44 (7.99%) User Experience
16 37 (6.72%) Artificial Intelligence
Programming Languages
1 108 (19.60%) SQL
2 85 (15.43%) Python
3 76 (13.79%) Java
4 65 (11.80%) JavaScript
5 54 (9.80%) C#
6 29 (5.26%) TypeScript
7 19 (3.45%) PL/SQL
8 13 (2.36%) Kotlin
8 13 (2.36%) T-SQL
9 12 (2.18%) Go
10 10 (1.81%) C++
10 10 (1.81%) VBA
11 9 (1.63%) PowerShell
11 9 (1.63%) VB
12 6 (1.09%) Shell Script
13 5 (0.91%) Swift
14 4 (0.73%) RPG
15 3 (0.54%) Bash
15 3 (0.54%) R
15 3 (0.54%) VB.NET
Qualifications
1 53 (9.62%) Security Cleared
2 47 (8.53%) Degree
3 43 (7.80%) SC Cleared
4 20 (3.63%) BPSS Clearance
5 17 (3.09%) ISTQB
6 15 (2.72%) PMI Certification
7 13 (2.36%) Computer Science Degree
7 13 (2.36%) Master's Degree
8 11 (2.00%) PMP
9 9 (1.63%) AWS Certification
10 5 (0.91%) Oracle Certification
11 4 (0.73%) CBAP
12 3 (0.54%) Azure Certification
12 3 (0.54%) CFA
12 3 (0.54%) DV Cleared
12 3 (0.54%) GIAC
12 3 (0.54%) OCA
12 3 (0.54%) SAP Certification
13 2 (0.36%) CEH
13 2 (0.36%) CSPO
Quality Assurance & Compliance
1 32 (5.81%) Accessibility
2 25 (4.54%) Data Quality
3 12 (2.18%) PMO
4 11 (2.00%) GDPR
5 8 (1.45%) SLA
6 5 (0.91%) WCAG
7 4 (0.73%) SEPA
8 3 (0.54%) Cyber Essentials
8 3 (0.54%) Cyber Essentials PLUS
8 3 (0.54%) GRC
8 3 (0.54%) IFRS
8 3 (0.54%) NIST
9 2 (0.36%) California Consumer Privacy Act
9 2 (0.36%) COBIT
9 2 (0.36%) ECSS
9 2 (0.36%) EMIR
9 2 (0.36%) FATCA
9 2 (0.36%) ISO 20022
9 2 (0.36%) PSD2
9 2 (0.36%) Software Quality Assurance
System Software
1 38 (6.90%) Docker
2 7 (1.27%) Active Directory
3 2 (0.36%) Virtual Machines
4 1 (0.18%) GridGain
4 1 (0.18%) Tivoli Workload Scheduler
4 1 (0.18%) Virtual Desktop
4 1 (0.18%) VirtualBox
4 1 (0.18%) VMware Infrastructure
Systems Management
1 32 (5.81%) Kubernetes
2 16 (2.90%) Terraform
3 6 (1.09%) Ansible
4 5 (0.91%) Grafana
5 4 (0.73%) Control-M
5 4 (0.73%) Prometheus
6 3 (0.54%) Istio
7 2 (0.36%) Argo
7 2 (0.36%) Puppet
8 1 (0.18%) Computer Emergency Response Teams
8 1 (0.18%) HP ALM
8 1 (0.18%) HP Quality Center
8 1 (0.18%) Icinga
8 1 (0.18%) Kibana
8 1 (0.18%) Microsoft Intune
8 1 (0.18%) Nagios
8 1 (0.18%) Progress Chef
8 1 (0.18%) Salt
8 1 (0.18%) SCCM
8 1 (0.18%) Tivoli
Vendors
1 55 (9.98%) Oracle
2 51 (9.26%) Microsoft
3 25 (4.54%) SAP
4 18 (3.27%) Salesforce
4 18 (3.27%) ServiceNow
5 13 (2.36%) Databricks
6 11 (2.00%) Citrix
7 10 (1.81%) UiPath
8 9 (1.63%) Google
8 9 (1.63%) Splunk
9 7 (1.27%) Duck Creek
9 7 (1.27%) ION Trading
9 7 (1.27%) Temenos
10 6 (1.09%) IBM
10 6 (1.09%) MuleSoft
10 6 (1.09%) OpenText
11 5 (0.91%) Adobe
11 5 (0.91%) Atlassian
11 5 (0.91%) Informatica
12 4 (0.73%) CA Agile Central