Telecoms Contracts in London

Telecommunications
England > London

The table below looks at the prevalence of the term Telecoms in contract job vacancies in London. Included is a benchmarking guide to the contractor rates offered in vacancies that cited Telecoms over the 6 months leading up to 28 May 2025, comparing them to the same period in the previous two years.

6 months to
28 May 2025
Same period 2024 Same period 2023
Rank 157 138 130
Rank change year-on-year -19 -8 -5
Contract jobs citing Telecoms 219 332 512
As % of all contract jobs advertised in London 1.81% 1.90% 1.99%
As % of the General category 2.67% 3.02% 3.14%
Number of daily rates quoted 121 192 371
10th Percentile £356 £250 £350
25th Percentile £409 £372 £425
Median daily rate (50th Percentile) £488 £475 £515
Median % change year-on-year +2.63% -7.77% -1.90%
75th Percentile £600 £615 £650
90th Percentile £700 £811 £750
England median daily rate £495 £450 £493
% change year-on-year +10.00% -8.63% -1.50%
Number of hourly rates quoted 6 10 11
10th Percentile £39.63 £29.33 £20.22
25th Percentile £51.81 £52.50 £20.95
Median hourly rate £57.75 £57.50 £51.50
Median % change year-on-year +0.43% +11.65% +30.35%
75th Percentile £63.56 £65.75 £68.00
90th Percentile £75.00 £68.15 £87.50
England median hourly rate £22.00 £55.00 £52.50
% change year-on-year -60.00% +4.76% +50.00%

All General Skills
London

Telecoms falls under the General Skills category. For comparison with the information above, the following table provides summary statistics for all contract job vacancies requiring common skills in London.

Contract vacancies with a requirement for common skills 8,193 10,980 16,304
As % of all contract IT jobs advertised in London 67.79% 62.96% 63.40%
Number of daily rates quoted 5,476 7,858 11,865
10th Percentile £341 £336 £375
25th Percentile £438 £450 £481
Median daily rate (50th Percentile) £563 £575 £600
Median % change year-on-year -2.17% -4.17% +3.45%
75th Percentile £700 £700 £725
90th Percentile £825 £825 £825
England median daily rate £525 £538 £550
% change year-on-year -2.33% -2.27% -
Number of hourly rates quoted 146 237 206
10th Percentile £15.84 £15.80 £16.37
25th Percentile £23.90 £18.25 £21.06
Median hourly rate £31.17 £30.00 £31.71
Median % change year-on-year +3.91% -5.39% -10.68%
75th Percentile £50.50 £46.48 £53.75
90th Percentile £63.50 £65.01 £70.00
England median hourly rate £27.50 £30.16 £31.96
% change year-on-year -8.82% -5.63% +47.79%

Telecoms
Job Vacancy Trend in London

Job postings citing Telecoms as a proportion of all IT jobs advertised in London.
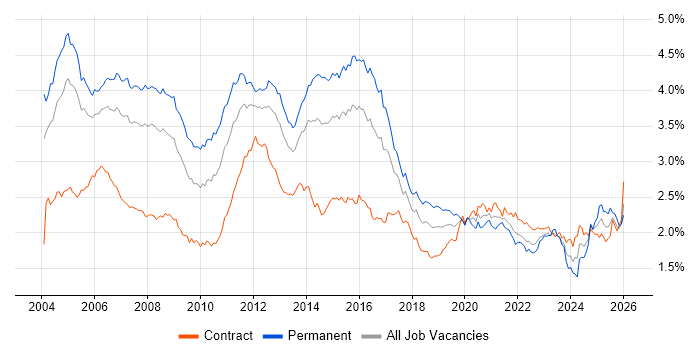
Job vacancy trend for Telecoms in London

Telecoms
Contractor Daily Rate Trend in London

3-month moving average daily rate quoted in jobs citing Telecoms in London.

Daily rate trend for Telecoms in London

Telecoms
Daily Rate Histogram in London

Daily rate distribution for jobs citing Telecoms in London over the 6 months to 28 May 2025.

Daily rate histogram for Telecoms in London

Telecoms
Contractor Hourly Rate Trend in London

3-month moving average hourly rates quoted in jobs citing Telecoms in London.

Hourly rate trend for Telecoms in London

Telecoms
Hourly Rate Histogram in London

Hourly rate distribution of jobs citing Telecoms in London over the 6 months to 28 May 2025.

Hourly rate histogram for Telecoms in London

Telecoms
Contract Job Locations in London

The table below looks at the demand and provides a guide to the median contractor rates quoted in IT jobs citing Telecoms within the London region over the 6 months to 28 May 2025. The 'Rank Change' column provides an indication of the change in demand within each location based on the same 6 month period last year.

Location Rank Change
on Same Period
Last Year
Matching
Contract
IT Job Ads
Median
Daily Rate
Past 6 Months
Median Daily Rate
% Change
on Same Period
Last Year
Live
Jobs
Central London -14 23 £495 +10.00% 20
West London +8 13 £425 +11.48% 22
South London +10 7 - - 8
East London +15 1 £313 +38.89% 9
Telecoms
England

Telecoms
Co-occurring Skills and Capabilities in London by Category

The follow tables expand on the table above by listing co-occurrences grouped by category. The same employment type, locality and period is covered with up to 20 co-occurrences shown in each of the following categories:

Application Platforms
1 9 (4.11%) CMS
2 8 (3.65%) Headless CMS
2 8 (3.65%) OpenStack
3 6 (2.74%) Confluence
4 5 (2.28%) SharePoint
5 4 (1.83%) Microsoft Exchange
6 3 (1.37%) Apache Spark
7 1 (0.46%) WinCC
Applications
1 9 (4.11%) Microsoft Office
2 2 (0.91%) MS Visio
3 1 (0.46%) AutoCAD
3 1 (0.46%) InVision
3 1 (0.46%) Microsoft Excel
3 1 (0.46%) Microsoft PowerPoint
3 1 (0.46%) Revit
3 1 (0.46%) Sketch
Business Applications
1 3 (1.37%) SAP S/4HANA
2 1 (0.46%) Oracle EBS
2 1 (0.46%) Primavera
2 1 (0.46%) SAP CO
2 1 (0.46%) SAP FI
2 1 (0.46%) SAP FI/CO
Cloud Services
1 25 (11.42%) Azure
2 20 (9.13%) AWS
3 10 (4.57%) GCP
4 6 (2.74%) Microsoft 365
4 6 (2.74%) Power Platform
5 5 (2.28%) Azure DevOps
6 4 (1.83%) OpenShift
6 4 (1.83%) Salesforce Sales Cloud
6 4 (1.83%) Salesforce Service Cloud
7 3 (1.37%) Entra ID
7 3 (1.37%) IaaS
8 2 (0.91%) Amazon OpenSearch
8 2 (0.91%) BrowserStack
8 2 (0.91%) GitHub
8 2 (0.91%) Google Workspace
8 2 (0.91%) Microsoft Copilot
8 2 (0.91%) Yammer
9 1 (0.46%) Apigee
9 1 (0.46%) Slack
9 1 (0.46%) Stackdriver
Communications & Networking
1 16 (7.31%) Firewall
2 14 (6.39%) 5G
3 13 (5.94%) Network Security
4 11 (5.02%) Radio Access Network
5 10 (4.57%) BGP
5 10 (4.57%) OSPF
5 10 (4.57%) Wireless
6 9 (4.11%) MPLS
6 9 (4.11%) VPN
7 8 (3.65%) 4G
8 6 (2.74%) LTE
9 5 (2.28%) 3G
9 5 (2.28%) VSAN
9 5 (2.28%) Wi-Fi
10 4 (1.83%) 2G
10 4 (1.83%) DNS
10 4 (1.83%) HTTP
10 4 (1.83%) LAN
10 4 (1.83%) Structured Cabling
10 4 (1.83%) Wireshark
Database & Business Intelligence
1 13 (5.94%) PostgreSQL
2 12 (5.48%) Relational Database
2 12 (5.48%) Tableau
3 9 (4.11%) GIS
4 8 (3.65%) Geospatial Data
5 6 (2.74%) Power BI
6 5 (2.28%) Big Data
7 3 (1.37%) QGIS
8 2 (0.91%) BigQuery
9 1 (0.46%) Airbyte
9 1 (0.46%) Data Warehouse
9 1 (0.46%) Elasticsearch
9 1 (0.46%) IDMS
9 1 (0.46%) Metadata
9 1 (0.46%) Oracle Reports
9 1 (0.46%) Power Query
9 1 (0.46%) SAP HANA
9 1 (0.46%) SQL Server
9 1 (0.46%) Star Schema
Development Applications
1 15 (6.85%) Jenkins
2 13 (5.94%) GitLab
3 12 (5.48%) Git
3 12 (5.48%) Gradle
4 11 (5.02%) JUnit
4 11 (5.02%) Liquibase
4 11 (5.02%) Mockito
5 9 (4.11%) JIRA
6 3 (1.37%) Cypress.io
7 2 (0.91%) Appium
7 2 (0.91%) Postman
7 2 (0.91%) Snyk
7 2 (0.91%) SoapUI
7 2 (0.91%) SonarQube
8 1 (0.46%) Axure RP
8 1 (0.46%) Maven
8 1 (0.46%) Sonatype Nexus
General
1 71 (32.42%) Social Skills
2 58 (26.48%) Finance
3 47 (21.46%) Public Sector
4 45 (20.55%) Marketing
5 42 (19.18%) Manufacturing
6 41 (18.72%) Electronics
7 28 (12.79%) Analytical Skills
8 8 (3.65%) Legal
8 8 (3.65%) Organisational Skills
9 5 (2.28%) Banking
9 5 (2.28%) Billing
10 4 (1.83%) Brand Awareness
11 3 (1.37%) French Language
11 3 (1.37%) Influencing Skills
12 2 (0.91%) Aviation
12 2 (0.91%) Documentation Skills
12 2 (0.91%) Inclusion and Diversity
12 2 (0.91%) Investment Banking
13 1 (0.46%) Fire and Rescue
13 1 (0.46%) Police
Job Titles
1 37 (16.89%) Developer
2 27 (12.33%) Architect
2 27 (12.33%) Senior
3 17 (7.76%) Network Engineer
4 15 (6.85%) Consultant
4 15 (6.85%) Lead
5 13 (5.94%) Analyst
6 10 (4.57%) Project Manager
7 9 (4.11%) Angular Developer
8 8 (3.65%) Telecoms Architect
8 8 (3.65%) Telecoms Developer
9 7 (3.20%) Domain Architect
9 7 (3.20%) React Developer
10 6 (2.74%) Business Analyst
10 6 (2.74%) Core Network Engineer
10 6 (2.74%) Lead Developer
10 6 (2.74%) SC Cleared Java Developer
10 6 (2.74%) Senior Architect
10 6 (2.74%) Senior Developer
10 6 (2.74%) Software Engineer
Libraries, Frameworks & Software Standards
1 19 (8.68%) React
2 12 (5.48%) Spring
2 12 (5.48%) Spring Boot
3 11 (5.02%) Kafka
3 11 (5.02%) OpenAPI
3 11 (5.02%) Swagger
4 9 (4.11%) AngularJS
4 9 (4.11%) Next.js
5 7 (3.20%) HTML
5 7 (3.20%) Node.js
6 6 (2.74%) CSS
7 5 (2.28%) XML
8 4 (1.83%) .NET
8 4 (1.83%) JSON
8 4 (1.83%) Vue
9 3 (1.37%) .NET Core
9 3 (1.37%) GraphQL
9 3 (1.37%) HTML5
9 3 (1.37%) PostGIS
9 3 (1.37%) Web Services
Miscellaneous
1 14 (6.39%) Data Centre
2 12 (5.48%) Onboarding
3 8 (3.65%) Self-Motivation
4 5 (2.28%) Algorithms
4 5 (2.28%) CCTV
4 5 (2.28%) PKI
4 5 (2.28%) Product Ownership
5 4 (1.83%) Private Cloud
6 3 (1.37%) Distributed Computing
6 3 (1.37%) Fibre Optics
6 3 (1.37%) Management Information System
6 3 (1.37%) Replication
6 3 (1.37%) Social Media
7 2 (0.91%) Data Protection Act
7 2 (0.91%) Distributed Systems
7 2 (0.91%) FPGA
7 2 (0.91%) Legacy Systems
7 2 (0.91%) Life Science
7 2 (0.91%) Verilog
7 2 (0.91%) VHDL
Operating Systems
1 18 (8.22%) Linux
2 10 (4.57%) Windows
3 4 (1.83%) Windows 10
4 3 (1.37%) Unix
5 2 (0.91%) Mac OS X
5 2 (0.91%) Red Hat Enterprise Linux
5 2 (0.91%) VMS
5 2 (0.91%) Windows 8
5 2 (0.91%) Windows XP
6 1 (0.46%) Windows Server
Processes & Methodologies
1 62 (28.31%) Problem-Solving
2 48 (21.92%) Business Intelligence
3 43 (19.63%) Agile
3 43 (19.63%) Programme Management
4 41 (18.72%) Digital Marketing
5 27 (12.33%) DevOps
6 26 (11.87%) CI/CD
6 26 (11.87%) Migration
7 25 (11.42%) Continuous Improvement
8 22 (10.05%) Software Engineering
9 19 (8.68%) Microservices
10 18 (8.22%) Containerisation
11 16 (7.31%) Project Management
12 15 (6.85%) Roadmaps
13 14 (6.39%) TDD
14 12 (5.48%) Stakeholder Engagement
14 12 (5.48%) Stakeholder Management
14 12 (5.48%) Validation
14 12 (5.48%) Visualisation
15 11 (5.02%) Data Visualisation
Programming Languages
1 35 (15.98%) Python
1 35 (15.98%) SQL
2 21 (9.59%) Java
3 18 (8.22%) TypeScript
4 13 (5.94%) JavaScript
5 8 (3.65%) PowerShell
6 4 (1.83%) C#
7 3 (1.37%) Bash
7 3 (1.37%) C++
8 2 (0.91%) SystemVerilog
9 1 (0.46%) ABAP
9 1 (0.46%) Data Analysis Expressions
9 1 (0.46%) Kusto Query Language
9 1 (0.46%) VB
Qualifications
1 30 (13.70%) Security Cleared
2 24 (10.96%) SC Cleared
3 23 (10.50%) Degree
4 7 (3.20%) Cisco Certification
5 6 (2.74%) CISSP
6 5 (2.28%) CCIE
6 5 (2.28%) CISM
6 5 (2.28%) Master's Degree
7 4 (1.83%) ACCA
7 4 (1.83%) CIMA
8 3 (1.37%) PMI Certification
8 3 (1.37%) PMP
8 3 (1.37%) RHCSA
9 2 (0.91%) BICSI Certification
9 2 (0.91%) Chartered Engineer
9 2 (0.91%) Computer Science Degree
9 2 (0.91%) CRISC
9 2 (0.91%) ISO 27001 Lead Auditor
9 2 (0.91%) PhD
9 2 (0.91%) SANS
Quality Assurance & Compliance
1 10 (4.57%) QA
2 8 (3.65%) SLA
3 6 (2.74%) ISO/IEC 27001
3 6 (2.74%) NIST
4 4 (1.83%) Accessibility
4 4 (1.83%) GDPR
5 3 (1.37%) Data Quality
5 3 (1.37%) GRC
6 2 (0.91%) California Consumer Privacy Act
7 1 (0.46%) Def Stans
7 1 (0.46%) ISO 9001
7 1 (0.46%) NCSC
7 1 (0.46%) PMO
7 1 (0.46%) Sarbanes-Oxley
7 1 (0.46%) SOC 2
7 1 (0.46%) Software Quality Assurance
7 1 (0.46%) WCAG
System Software
1 15 (6.85%) Docker
2 8 (3.65%) Active Directory
3 7 (3.20%) VMware Infrastructure
3 7 (3.20%) vSphere
4 5 (2.28%) iptables
4 5 (2.28%) VMware NSX
5 4 (1.83%) Firmware
6 3 (1.37%) FreeRADIUS
7 2 (0.91%) XenApp
8 1 (0.46%) Virtual Machines
Systems Management
1 17 (7.76%) Kubernetes
2 13 (5.94%) Ansible
3 11 (5.02%) Terraform
4 4 (1.83%) Puppet
5 3 (1.37%) Cacti
5 3 (1.37%) Grafana
5 3 (1.37%) Nagios
5 3 (1.37%) Netcool
5 3 (1.37%) Proxmox
5 3 (1.37%) ZABBIX
6 2 (0.91%) McAfee ePO
6 2 (0.91%) Microsoft Intune
6 2 (0.91%) Norton AntiVirus
6 2 (0.91%) SELinux
7 1 (0.46%) Cisco CUCM
7 1 (0.46%) Graylog
7 1 (0.46%) Istio
7 1 (0.46%) logstash
7 1 (0.46%) NSN NetAct
7 1 (0.46%) VxRail
Vendors
1 50 (22.83%) Microsoft
2 45 (20.55%) SAP
3 14 (6.39%) VMware
4 13 (5.94%) Nokia
5 11 (5.02%) Ericsson
5 11 (5.02%) Google
6 10 (4.57%) ServiceNow
7 9 (4.11%) Cisco
8 7 (3.20%) Salesforce
8 7 (3.20%) Splunk
9 6 (2.74%) Fortinet
9 6 (2.74%) Red Hat
10 5 (2.28%) Databricks
10 5 (2.28%) Oracle
10 5 (2.28%) Virgin Media
11 3 (1.37%) Adobe
11 3 (1.37%) Citrix
11 3 (1.37%) Palo Alto
11 3 (1.37%) SolarWinds
12 2 (0.91%) HP