Vulnerability Management Jobs in England

Vulnerability Management
UK > England

The table below provides summary statistics for permanent job vacancies advertised in England requiring Vulnerability Management skills. It includes a benchmarking guide to the annual salaries offered in vacancies that cited Vulnerability Management over the 6 months leading up to 28 May 2025, comparing them to the same period in the previous two years.

6 months to
28 May 2025
Same period 2024 Same period 2023
Rank 388 408 282
Rank change year-on-year +20 -126 +285
Permanent jobs citing Vulnerability Management 323 503 1,076
As % of all permanent jobs advertised in England 0.67% 0.57% 1.24%
As % of the Processes & Methodologies category 0.71% 0.68% 1.29%
Number of salaries quoted 251 392 427
10th Percentile £41,280 £40,000 £44,071
25th Percentile £52,500 £50,750 £50,000
Median annual salary (50th Percentile) £67,500 £65,000 £65,000
Median % change year-on-year +3.85% - -
75th Percentile £85,000 £89,063 £75,000
90th Percentile £107,500 £97,475 £100,000
UK median annual salary £67,500 £65,000 £62,500
% change year-on-year +3.85% +4.00% -0.33%

All Process and Methodology Skills
England

Vulnerability Management falls under the Processes and Methodologies category. For comparison with the information above, the following table provides summary statistics for all permanent job vacancies requiring process or methodology skills in England.

Permanent vacancies with a requirement for process or methodology skills 45,477 74,482 83,229
As % of all permanent jobs advertised in England 94.01% 84.24% 95.56%
Number of salaries quoted 22,533 54,432 49,691
10th Percentile £29,625 £29,000 £34,375
25th Percentile £41,250 £40,000 £46,105
Median annual salary (50th Percentile) £57,500 £55,000 £62,500
Median % change year-on-year +4.55% -12.00% +4.17%
75th Percentile £75,000 £72,500 £82,500
90th Percentile £98,695 £93,750 £102,500
UK median annual salary £57,500 £55,000 £61,000
% change year-on-year +4.55% -9.84% +1.67%

Vulnerability Management
Job Vacancy Trend in England

Job postings citing Vulnerability Management as a proportion of all IT jobs advertised in England.
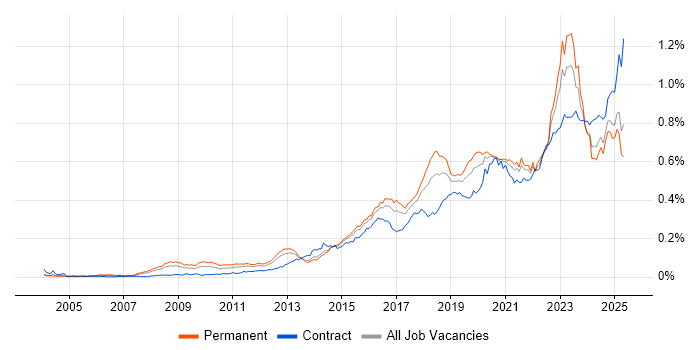
Job vacancy trend for Vulnerability Management in England

Vulnerability Management
Salary Trend in England

3-month moving average salary quoted in jobs citing Vulnerability Management in England.

Salary trend for Vulnerability Management in England

Vulnerability Management
Salary Histogram in England

Salary distribution for jobs citing Vulnerability Management in England over the 6 months to 28 May 2025.

Salary histogram for Vulnerability Management in England

Vulnerability Management
Job Locations in England

The table below looks at the demand and provides a guide to the median salaries quoted in IT jobs citing Vulnerability Management within the England region over the 6 months to 28 May 2025. The 'Rank Change' column provides an indication of the change in demand within each location based on the same 6 month period last year.

Location Rank Change
on Same Period
Last Year
Matching
Permanent
IT Job Ads
Median Salary
Past 6 Months
Median Salary
% Change
on Same Period
Last Year
Live
Jobs
London +72 144 £75,000 -6.25% 176
North of England +24 68 £57,500 +10.40% 171
South East +68 64 £55,000 -12.00% 224
Yorkshire +69 35 £45,000 -20.35% 63
North West -22 32 £75,000 +44.00% 83
Midlands +38 18 £51,250 +28.13% 109
South West +85 16 £55,000 -12.00% 88
West Midlands +50 13 £53,688 +43.17% 58
East of England +20 11 £42,085 -41.95% 95
East Midlands +31 5 £50,000 -4.76% 44
North East +47 1 £29,000 -18.88% 26
Vulnerability Management
UK

Vulnerability Management
Co-occurring Skills and Capabilities in England by Category

The follow tables expand on the table above by listing co-occurrences grouped by category. The same employment type, locality and period is covered with up to 20 co-occurrences shown in each of the following categories:

Application Platforms
1 5 (1.55%) SharePoint
2 3 (0.93%) Microsoft Exchange
2 3 (0.93%) WordPress
3 2 (0.62%) Apache
3 2 (0.62%) CMS
3 2 (0.62%) Drupal
4 1 (0.31%) Confluence
4 1 (0.31%) IIS
Applications
1 6 (1.86%) Microsoft Office
2 1 (0.31%) Microsoft Excel
2 1 (0.31%) Microsoft PowerPoint
2 1 (0.31%) MS Visio
Business Applications
1 2 (0.62%) Shopify
2 1 (0.31%) SAP Oil and Gas
2 1 (0.31%) SAP S/4HANA
Cloud Services
1 111 (34.37%) Azure
2 62 (19.20%) Microsoft 365
3 32 (9.91%) AWS
4 26 (8.05%) PaaS
5 23 (7.12%) Azure DevOps
6 21 (6.50%) Azure Sentinel
7 20 (6.19%) Entra ID
7 20 (6.19%) GCP
8 15 (4.64%) SaaS
9 9 (2.79%) Google Workspace
10 7 (2.17%) IaaS
11 5 (1.55%) Amazon EC2
11 5 (1.55%) Amazon S3
12 3 (0.93%) Amazon GuardDuty
12 3 (0.93%) Azure AKS
12 3 (0.93%) Microsoft Purview
12 3 (0.93%) Slack
13 2 (0.62%) Azure Data Factory
13 2 (0.62%) Azure Monitor
13 2 (0.62%) Mimecast
Communications & Networking
1 93 (28.79%) Firewall
2 64 (19.81%) Network Security
3 20 (6.19%) DNS
4 19 (5.88%) VPN
5 16 (4.95%) Intrusion Detection
6 13 (4.02%) TCP/IP
7 12 (3.72%) HTTP
7 12 (3.72%) SMTP
7 12 (3.72%) Wireless
8 10 (3.10%) SSL
8 10 (3.10%) VLAN
9 9 (2.79%) Cisco IOS
10 7 (2.17%) BGP
10 7 (2.17%) OSPF
10 7 (2.17%) Spanning Tree
10 7 (2.17%) Wireshark
11 6 (1.86%) LAN
12 5 (1.55%) WAN
12 5 (1.55%) Wi-Fi
13 3 (0.93%) SAN
Database & Business Intelligence
1 4 (1.24%) SQL Server
2 2 (0.62%) MySQL
3 1 (0.31%) Oracle Reports
3 1 (0.31%) Power BI
Development Applications
1 8 (2.48%) Burp Suite
2 2 (0.62%) Bitbucket
2 2 (0.62%) Git
3 1 (0.31%) CircleCI
3 1 (0.31%) GitLab
3 1 (0.31%) Jenkins
3 1 (0.31%) JIRA
3 1 (0.31%) Metasploit
3 1 (0.31%) Postman
3 1 (0.31%) REST Assured
3 1 (0.31%) SoapUI
General
1 81 (25.08%) Social Skills
2 66 (20.43%) Finance
3 31 (9.60%) Analytical Skills
4 23 (7.12%) Law
4 23 (7.12%) Legal
5 21 (6.50%) Retail
6 18 (5.57%) Banking
7 11 (3.41%) Inclusion and Diversity
7 11 (3.41%) Pharmaceutical
7 11 (3.41%) Telecoms
8 7 (2.17%) Mandarin Language
9 5 (1.55%) Front Office
9 5 (1.55%) Organisational Skills
10 4 (1.24%) Local Government
10 4 (1.24%) Public Sector
11 3 (0.93%) Military
12 2 (0.62%) Advertising
12 2 (0.62%) Investment Banking
12 2 (0.62%) Manufacturing
12 2 (0.62%) Presentation Skills
Job Titles
1 66 (20.43%) Security Engineer
2 53 (16.41%) Analyst
3 44 (13.62%) Security Analyst
4 43 (13.31%) Lead
5 28 (8.67%) Senior
6 24 (7.43%) Vulnerability Manager
7 23 (7.12%) Cybersecurity Analyst
8 20 (6.19%) Infrastructure Engineer
8 20 (6.19%) Security Manager
9 19 (5.88%) Security Specialist
10 16 (4.95%) Consultant
11 15 (4.64%) Cybersecurity Engineer
12 14 (4.33%) Cybersecurity Specialist
13 12 (3.72%) Architect
13 12 (3.72%) Information Analyst
13 12 (3.72%) Information Security Analyst
13 12 (3.72%) SOC Analyst
14 11 (3.41%) Infrastructure Security Engineer
14 11 (3.41%) IT Engineer
15 10 (3.10%) Security Architect
Libraries, Frameworks & Software Standards
1 19 (5.88%) YAML
2 3 (0.93%) 802.1X
3 2 (0.62%) Azure Blueprints
3 2 (0.62%) CSS
3 2 (0.62%) HTML
3 2 (0.62%) HTML5
3 2 (0.62%) jQuery
3 2 (0.62%) Leaflet
3 2 (0.62%) React
3 2 (0.62%) Vue
4 1 (0.31%) EDI
4 1 (0.31%) JWT
4 1 (0.31%) LAMP
4 1 (0.31%) LDAP
4 1 (0.31%) Loki
4 1 (0.31%) OAuth
4 1 (0.31%) OAuth2
4 1 (0.31%) REST
4 1 (0.31%) SAP Basis
4 1 (0.31%) XML
Miscellaneous
1 103 (31.89%) Security Posture
2 76 (23.53%) Management Information System
3 30 (9.29%) Cyber Threat
4 19 (5.88%) Data Centre
5 16 (4.95%) Security Operations Centre
6 11 (3.41%) Self-Motivation
7 9 (2.79%) Cyberattack
8 8 (2.48%) Cloud Security Posture
8 8 (2.48%) Cyber Security Posture
8 8 (2.48%) Social Media
8 8 (2.48%) Team-Oriented Environment
9 7 (2.17%) Cloud Native
9 7 (2.17%) Cyber Kill Chain
9 7 (2.17%) Onboarding
9 7 (2.17%) Taxonomies
10 6 (1.86%) Data Protection Act
11 5 (1.55%) Cyber Defence
11 5 (1.55%) iPhone
11 5 (1.55%) Operational Technology
12 4 (1.24%) Distributed Denial-of-Service
Operating Systems
1 76 (23.53%) Windows
2 30 (9.29%) Linux
3 16 (4.95%) Windows Server
4 9 (2.79%) Android
5 8 (2.48%) Mac OS
5 8 (2.48%) Windows Vista
6 6 (1.86%) Windows 10
7 5 (1.55%) Windows Server 2016
8 3 (0.93%) Windows Server 2019
9 2 (0.62%) VMS
10 1 (0.31%) AIX
10 1 (0.31%) CentOS
10 1 (0.31%) Oracle Linux
10 1 (0.31%) Red Hat Enterprise Linux
10 1 (0.31%) Unix
10 1 (0.31%) Windows Server 2012
Processes & Methodologies
1 203 (62.85%) Cybersecurity
2 153 (47.37%) Incident Response
3 122 (37.77%) Information Security
4 110 (34.06%) SIEM
5 80 (24.77%) Security Operations
6 75 (23.22%) Risk Management
7 65 (20.12%) Continuous Improvement
8 63 (19.50%) Penetration Testing
8 63 (19.50%) Problem-Solving
9 54 (16.72%) Data Protection
10 52 (16.10%) Cloud Security
11 47 (14.55%) Threat and Vulnerability Management
12 46 (14.24%) Data Loss Prevention
12 46 (14.24%) DevOps
12 46 (14.24%) Incident Management
13 44 (13.62%) Computer Science
14 43 (13.31%) Security Testing
15 42 (13.00%) Vulnerability Scanning
16 41 (12.69%) DevSecOps
17 40 (12.38%) Threat Intelligence
Programming Languages
1 60 (18.58%) PowerShell
2 36 (11.15%) Python
3 16 (4.95%) Bash
4 4 (1.24%) Perl
5 3 (0.93%) PHP
6 2 (0.62%) Bicep
6 2 (0.62%) JavaScript
7 1 (0.31%) AWK
7 1 (0.31%) C
7 1 (0.31%) C++
7 1 (0.31%) Go
7 1 (0.31%) Korn
7 1 (0.31%) Kusto Query Language
7 1 (0.31%) SAPscript
7 1 (0.31%) SQL
Qualifications
1 96 (29.72%) Degree
2 56 (17.34%) CISSP
3 47 (14.55%) CISM
4 40 (12.38%) Computer Science Degree
5 33 (10.22%) Master's Degree
6 26 (8.05%) CEH
7 22 (6.81%) CRISC
8 20 (6.19%) Security Cleared
9 17 (5.26%) CISA
10 16 (4.95%) Cisco Certification
10 16 (4.95%) GCIH
11 15 (4.64%) SC Cleared
12 11 (3.41%) (ISC)2 CCSP
13 10 (3.10%) GCIA
14 9 (2.79%) AWS Certification
14 9 (2.79%) DBS Check
14 9 (2.79%) GCFA
14 9 (2.79%) GIAC
14 9 (2.79%) Microsoft Certification
15 8 (2.48%) CompTIA Security+
Quality Assurance & Compliance
1 114 (35.29%) NIST
2 109 (33.75%) ISO/IEC 27001
3 71 (21.98%) GDPR
4 28 (8.67%) PCI DSS
5 26 (8.05%) NCSC
6 24 (7.43%) Cyber Essentials
7 18 (5.57%) GRC
8 12 (3.72%) SOC 2
9 11 (3.41%) Accessibility
10 10 (3.10%) COBIT
11 9 (2.79%) NIST 800
12 8 (2.48%) ISO/IEC 27002 (supersedes ISO/IEC 17799)
13 7 (2.17%) Cyber Essentials PLUS
13 7 (2.17%) SOC 1
14 6 (1.86%) HIPAA
14 6 (1.86%) SLA
15 4 (1.24%) Sarbanes-Oxley
16 3 (0.93%) JSP 440
System Software
1 26 (8.05%) Active Directory
2 21 (6.50%) Virtual Machines
3 9 (2.79%) VMware Infrastructure
4 5 (1.55%) Hyper-V
5 4 (1.24%) VMware ESXi
5 4 (1.24%) vSphere
6 3 (0.93%) Docker
6 3 (0.93%) Virtual Desktop
7 2 (0.62%) Firmware
7 2 (0.62%) NFS
8 1 (0.31%) BitLocker
8 1 (0.31%) KVM
8 1 (0.31%) Postfix
8 1 (0.31%) Sendmail
Systems Management
1 27 (8.36%) Microsoft Intune
2 13 (4.02%) Nessus
2 13 (4.02%) Terraform
3 12 (3.72%) Single Sign-On
4 10 (3.10%) CASB
5 8 (2.48%) Jamf Pro
5 8 (2.48%) RSA Archer
6 7 (2.17%) FortiGate
7 6 (1.86%) Kubernetes
8 4 (1.24%) Ansible
9 3 (0.93%) CSIRT
9 3 (0.93%) Progress Chef
9 3 (0.93%) Puppet
10 2 (0.62%) Computer Emergency Response Teams
10 2 (0.62%) Istio
10 2 (0.62%) linkerd
10 2 (0.62%) SCCM
11 1 (0.31%) Active Directory Federation Services
11 1 (0.31%) cPanel
11 1 (0.31%) Grafana
Vendors
1 134 (41.49%) Microsoft
2 38 (11.76%) Tenable
3 36 (11.15%) Cisco
4 25 (7.74%) Qualys
5 24 (7.43%) VMware
6 21 (6.50%) Google
7 11 (3.41%) Juniper
8 10 (3.10%) Meraki
9 9 (2.79%) CrowdStrike
10 6 (1.86%) Splunk
11 5 (1.55%) Fortinet
11 5 (1.55%) Palo Alto
11 5 (1.55%) Rapid7
11 5 (1.55%) SAP
11 5 (1.55%) Tanium
11 5 (1.55%) Zscaler
12 4 (1.24%) Extreme Networks
13 3 (0.93%) Apple
13 3 (0.93%) Concur
13 3 (0.93%) HubSpot