HTTP Jobs in England

HTTP (Hypertext Transfer Protocol)
UK > England

The table below provides summary statistics for permanent job vacancies advertised in England requiring HTTP skills. It includes a benchmarking guide to the annual salaries offered in vacancies that cited HTTP over the 6 months leading up to 1 May 2025, comparing them to the same period in the previous two years.

6 months to
1 May 2025
Same period 2024 Same period 2023
Rank 520 545 506
Rank change year-on-year +25 -39 -239
Permanent jobs citing HTTP 129 291 520
As % of all permanent jobs advertised in England 0.28% 0.34% 0.56%
As % of the Communications & Networking category 2.13% 2.39% 3.62%
Number of salaries quoted 84 190 299
10th Percentile £46,500 £32,450 £42,500
25th Percentile £56,250 £42,813 £52,500
Median annual salary (50th Percentile) £62,500 £55,000 £69,447
Median % change year-on-year +13.64% -20.80% +11.12%
75th Percentile £75,000 £69,688 £85,000
90th Percentile £100,000 £87,500 £100,000
UK median annual salary £62,500 £55,000 £69,447
% change year-on-year +13.64% -20.80% +11.12%

All Communications and Computer Networking Skills
England

HTTP falls under the Communications and Computer Networking category. For comparison with the information above, the following table provides summary statistics for all permanent job vacancies requiring communications or computer networking skills in England.

Permanent vacancies with a requirement for communications or computer networking skills 6,049 12,183 14,383
As % of all permanent jobs advertised in England 13.14% 14.30% 15.55%
Number of salaries quoted 3,727 8,619 7,434
10th Percentile £25,087 £26,250 £27,750
25th Percentile £31,250 £32,500 £35,750
Median annual salary (50th Percentile) £47,500 £47,500 £50,000
Median % change year-on-year - -5.00% -4.76%
75th Percentile £67,500 £62,500 £70,000
90th Percentile £85,100 £77,500 £87,500
UK median annual salary £47,500 £47,875 £50,250
% change year-on-year -0.78% -4.73% -4.29%

HTTP
Job Vacancy Trend in England

Job postings citing HTTP as a proportion of all IT jobs advertised in England.
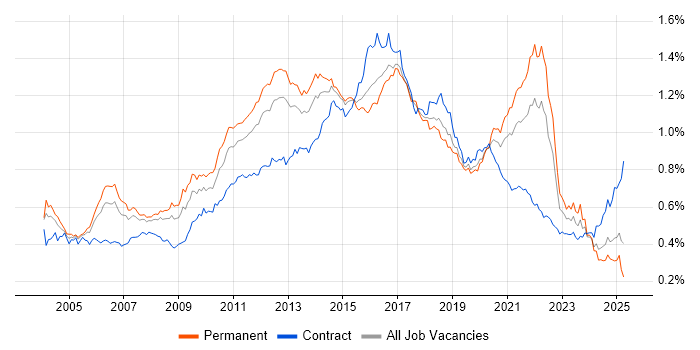
Job vacancy trend for HTTP in England

HTTP
Salary Trend in England

3-month moving average salary quoted in jobs citing HTTP in England.

Salary trend for HTTP in England

HTTP
Salary Histogram in England

Salary distribution for jobs citing HTTP in England over the 6 months to 1 May 2025.

Salary histogram for HTTP in England

HTTP
Job Locations in England

The table below looks at the demand and provides a guide to the median salaries quoted in IT jobs citing HTTP within the England region over the 6 months to 1 May 2025. The 'Rank Change' column provides an indication of the change in demand within each location based on the same 6 month period last year.

Location Rank Change
on Same Period
Last Year
Matching
Permanent
IT Job Ads
Median Salary
Past 6 Months
Median Salary
% Change
on Same Period
Last Year
Live
Jobs
London +97 71 £62,500 -3.85% 93
North of England +82 24 £65,000 - 26
North West +33 18 £65,000 -7.14% 15
East of England +60 15 £62,000 +79.71% 28
South East +68 12 £75,000 +76.47% 41
Yorkshire +75 6 £85,253 +55.00% 8
Midlands +57 5 £60,000 +9.09% 14
West Midlands +28 5 £60,000 -2.04% 7
South West +26 2 £51,250 -4.65% 7
HTTP
UK

HTTP
Co-occurring Skills and Capabilities in England by Category

The follow tables expand on the table above by listing co-occurrences grouped by category. The same employment type, locality and period is covered with up to 20 co-occurrences shown in each of the following categories:

Application Platforms
1 21 (16.28%) Apache Spark
2 3 (2.33%) Apache
2 3 (2.33%) IIS
3 2 (1.55%) Confluence
4 1 (0.78%) Apache Airflow
4 1 (0.78%) CMS
4 1 (0.78%) Microsoft Exchange
4 1 (0.78%) Oracle HTTP Server
4 1 (0.78%) Tomcat
4 1 (0.78%) Umbraco
4 1 (0.78%) WebLogic
Business Applications
1 8 (6.20%) Oracle EBS
2 2 (1.55%) SAP Oil and Gas
3 1 (0.78%) Dynamics CRM
Cloud Services
1 33 (25.58%) Azure
2 25 (19.38%) AWS
3 19 (14.73%) Serverless
4 16 (12.40%) Azure DevOps
5 15 (11.63%) Cloud Computing
6 9 (6.98%) GCP
7 7 (5.43%) SaaS
8 4 (3.10%) Azure Logic Apps
8 4 (3.10%) GitHub
8 4 (3.10%) Nutanix
9 3 (2.33%) Microsoft 365
10 1 (0.78%) Azure API Management
10 1 (0.78%) Azure Functions
10 1 (0.78%) Azure Service Bus
10 1 (0.78%) Dynamics 365
10 1 (0.78%) Mimecast
10 1 (0.78%) Sage Pay
Communications & Networking
1 34 (26.36%) TCP/IP
2 24 (18.60%) DNS
2 24 (18.60%) Firewall
3 19 (14.73%) SMTP
4 17 (13.18%) VPN
5 12 (9.30%) FTP
5 12 (9.30%) LAN
6 11 (8.53%) WAN
7 9 (6.98%) Network Security
8 8 (6.20%) Internet
9 7 (5.43%) SSL
10 6 (4.65%) HTTPS
10 6 (4.65%) SSH
11 4 (3.10%) Cisco IOS
11 4 (3.10%) VLAN
12 2 (1.55%) DHCP
12 2 (1.55%) Intrusion Detection
12 2 (1.55%) RS-232
13 1 (0.78%) SAN
13 1 (0.78%) Wireless
Database & Business Intelligence
1 21 (16.28%) SQL Server
2 11 (8.53%) NoSQL
3 8 (6.20%) Amazon QuickSight
3 8 (6.20%) Relational Database
4 5 (3.88%) MongoDB
5 4 (3.10%) MySQL
6 2 (1.55%) DynamoDB
6 2 (1.55%) Oracle Reports
7 1 (0.78%) DB2
7 1 (0.78%) MariaDB
7 1 (0.78%) Metadata
7 1 (0.78%) PostgreSQL
7 1 (0.78%) SQLite
Development Applications
1 23 (17.83%) Git
2 21 (16.28%) JIRA
3 13 (10.08%) Jenkins
4 12 (9.30%) JUnit
5 10 (7.75%) PowerBuilder
6 8 (6.20%) NUnit
7 4 (3.10%) Appium
7 4 (3.10%) Postman
7 4 (3.10%) Selenium
7 4 (3.10%) Spinnaker
8 3 (2.33%) Subversion
8 3 (2.33%) XCUITest
9 2 (1.55%) Xcode
10 1 (0.78%) Log4Net
10 1 (0.78%) Maven
10 1 (0.78%) Sonatype Nexus
10 1 (0.78%) Team Foundation Server
General
1 46 (35.66%) Finance
2 42 (32.56%) Social Skills
3 40 (31.01%) Inclusion and Diversity
4 27 (20.93%) Retail
5 22 (17.05%) Advertising
5 22 (17.05%) Games
6 19 (14.73%) Analytical Skills
7 11 (8.53%) Manufacturing
8 10 (7.75%) Telecoms
9 9 (6.98%) Electronics
9 9 (6.98%) Law
9 9 (6.98%) Pharmaceutical
10 5 (3.88%) Banking
11 4 (3.10%) Influencing Skills
12 1 (0.78%) Aerospace
12 1 (0.78%) Automotive
12 1 (0.78%) Documentation Skills
12 1 (0.78%) Marketing
12 1 (0.78%) Public Sector
12 1 (0.78%) Wearables
Job Titles
1 42 (32.56%) Senior
2 29 (22.48%) Software Engineer
3 26 (20.16%) Senior Software Engineer
4 19 (14.73%) Lead
5 17 (13.18%) Automation Engineer
6 13 (10.08%) Developer
6 13 (10.08%) Security Engineer
7 11 (8.53%) Development Engineer
8 10 (7.75%) Technical Leader
9 9 (6.98%) C# Developer
9 9 (6.98%) Information Security Engineer
9 9 (6.98%) Systems Engineer
10 8 (6.20%) Reliability Engineer
10 8 (6.20%) Robotics Engineer
11 7 (5.43%) .NET Developer
11 7 (5.43%) Senior Developer
12 6 (4.65%) C# .NET Developer
12 6 (4.65%) Technical Support
13 5 (3.88%) Technical Manager
13 5 (3.88%) Technical Support Manager
Libraries, Frameworks & Software Standards
1 28 (21.71%) Kafka
2 23 (17.83%) JSON
3 22 (17.05%) .NET
4 20 (15.50%) React
4 20 (15.50%) REST
5 19 (14.73%) HTML
6 16 (12.40%) SOAP
7 14 (10.85%) XML
8 13 (10.08%) LDAP
9 12 (9.30%) CSS
10 10 (7.75%) GraphQL
11 8 (6.20%) .NET Core
11 8 (6.20%) Jest
11 8 (6.20%) Node.js
12 7 (5.43%) RESTful
13 5 (3.88%) AngularJS
13 5 (3.88%) gRPC
13 5 (3.88%) Pandas
13 5 (3.88%) Puppeteer
13 5 (3.88%) Scrapy
Miscellaneous
1 25 (19.38%) Distributed Systems
2 21 (16.28%) Product Ownership
3 10 (7.75%) Reinsurance
4 8 (6.20%) Client/Server
4 8 (6.20%) Management Information System
4 8 (6.20%) Robotics
4 8 (6.20%) SCADA
5 7 (5.43%) Linux Command Line
5 7 (5.43%) Security Operations Centre
5 7 (5.43%) Self-Motivation
6 6 (4.65%) Mobile App
7 5 (3.88%) Cloud Native
8 4 (3.10%) Anti-Spyware
8 4 (3.10%) Data Centre
8 4 (3.10%) Low-Code
8 4 (3.10%) Security Posture
9 3 (2.33%) Driving Licence
9 3 (2.33%) Enterprise Software
9 3 (2.33%) Smartphone
10 2 (1.55%) Derivative
Operating Systems
1 20 (15.50%) Linux
2 17 (13.18%) Windows
3 10 (7.75%) Android
4 8 (6.20%) Apple iOS
5 7 (5.43%) Unix
6 6 (4.65%) Windows Server
7 3 (2.33%) CentOS
8 2 (1.55%) AIX
8 2 (1.55%) Oracle Linux
9 1 (0.78%) Debian
9 1 (0.78%) Red Hat Enterprise Linux
9 1 (0.78%) Ubuntu
9 1 (0.78%) Windows Server 2016
9 1 (0.78%) Windows Server 2019
Processes & Methodologies
1 54 (41.86%) Agile
2 44 (34.11%) Computer Science
3 34 (26.36%) Problem-Solving
4 32 (24.81%) DevOps
4 32 (24.81%) Software Engineering
5 31 (24.03%) CI/CD
6 28 (21.71%) API Integration
7 27 (20.93%) Microservices
8 25 (19.38%) Performance Metrics
9 21 (16.28%) Information Security
9 21 (16.28%) Machine Learning
9 21 (16.28%) Programmatic Advertising
10 20 (15.50%) Containerisation
11 19 (14.73%) Cybersecurity
12 17 (13.18%) Continuous Integration
12 17 (13.18%) Unit Testing
13 16 (12.40%) Roadmaps
13 16 (12.40%) Security Operations
14 14 (10.85%) Design Patterns
14 14 (10.85%) SDLC
Programming Languages
1 65 (50.39%) Python
2 38 (29.46%) SQL
3 28 (21.71%) JavaScript
4 24 (18.60%) C#
5 22 (17.05%) C
6 21 (16.28%) Scala
7 15 (11.63%) Bash
7 15 (11.63%) C++
8 12 (9.30%) Perl
9 11 (8.53%) Java
9 11 (8.53%) PowerShell
10 8 (6.20%) R
11 5 (3.88%) Kotlin
11 5 (3.88%) TypeScript
12 4 (3.10%) Jython
12 4 (3.10%) Objective-C
12 4 (3.10%) PHP
13 3 (2.33%) Swift
14 2 (1.55%) Korn
14 2 (1.55%) Ruby
Qualifications
1 53 (41.09%) Degree
2 14 (10.85%) Computer Science Degree
3 8 (6.20%) Numerate Degree
3 8 (6.20%) Security Cleared
4 6 (4.65%) CISSP
4 6 (4.65%) DV Cleared
4 6 (4.65%) Master's Degree
4 6 (4.65%) SC Cleared
5 4 (3.10%) CISM
6 2 (1.55%) A+ Certification
6 2 (1.55%) CEH
6 2 (1.55%) CompTIA Security+
7 1 (0.78%) RHCSA
Quality Assurance & Compliance
1 10 (7.75%) SLA
2 6 (4.65%) ISO/IEC 27001
2 6 (4.65%) NIST
3 4 (3.10%) Accessibility
3 4 (3.10%) QA
3 4 (3.10%) Sarbanes-Oxley
4 1 (0.78%) ISO 9001
System Software
1 16 (12.40%) Docker
2 8 (6.20%) Active Directory
3 6 (4.65%) VMware Infrastructure
4 2 (1.55%) KVM
4 2 (1.55%) Postfix
4 2 (1.55%) Sendmail
5 1 (0.78%) Embedded Firmware
5 1 (0.78%) Firmware
5 1 (0.78%) VMware ESXi
5 1 (0.78%) vSphere
Systems Management
1 15 (11.63%) Kubernetes
2 6 (4.65%) QRadar
3 4 (3.10%) Ansible
3 4 (3.10%) Single Sign-On
4 3 (2.33%) Nagios
4 3 (2.33%) Nessus
5 2 (1.55%) Grafana
5 2 (1.55%) Graylog
6 1 (0.78%) Microsoft Intune
6 1 (0.78%) Puppet
6 1 (0.78%) Terraform
6 1 (0.78%) vCenter Server
Vendors
1 50 (38.76%) Microsoft
2 33 (25.58%) Google
3 21 (16.28%) Apple
4 13 (10.08%) Oracle
5 12 (9.30%) Okta
6 11 (8.53%) VMware
7 9 (6.98%) Splunk
8 4 (3.10%) Cisco
8 4 (3.10%) Dynatrace
8 4 (3.10%) Perforce
8 4 (3.10%) ServiceNow
9 3 (2.33%) Bloomberg
9 3 (2.33%) IBM
9 3 (2.33%) Red Hat
9 3 (2.33%) SAP
10 2 (1.55%) Tenable
11 1 (0.78%) ForgeRock
11 1 (0.78%) PayPal
11 1 (0.78%) SolarWinds
11 1 (0.78%) Sophos