Enterprise Software Jobs in London

Enterprise Application Software
England > London

The table below looks at the prevalence of the term Enterprise Software in permanent job vacancies in London. Included is a benchmarking guide to the salaries offered in vacancies that cited Enterprise Software over the 6 months leading up to 28 May 2025, comparing them to the same period in the previous two years.

6 months to
28 May 2025
Same period 2024 Same period 2023
Rank 243 309 277
Rank change year-on-year +66 -32 -49
Permanent jobs citing Enterprise Software 154 221 412
As % of all permanent jobs advertised in London 1.23% 0.93% 1.24%
As % of the Miscellaneous category 2.77% 2.30% 2.69%
Number of salaries quoted 62 173 278
10th Percentile £47,500 £38,150 £55,000
25th Percentile £58,125 £51,000 £62,500
Median annual salary (50th Percentile) £80,000 £80,000 £80,000
Median % change year-on-year - - +18.52%
75th Percentile £100,000 £95,000 £101,250
90th Percentile £112,500 £117,500 £129,625
England median annual salary £65,000 £62,783 £66,250
% change year-on-year +3.53% -5.23% +6.00%

All Generic Skills
London

Enterprise Software falls under the General and Transferable Skills category. For comparison with the information above, the following table provides summary statistics for all permanent job vacancies requiring generic IT skills in London.

Permanent vacancies with a requirement for generic IT skills 5,552 9,615 15,323
As % of all permanent jobs advertised in London 44.37% 40.42% 46.25%
Number of salaries quoted 2,975 6,776 10,409
10th Percentile £41,750 £37,500 £44,192
25th Percentile £56,250 £51,250 £56,250
Median annual salary (50th Percentile) £80,000 £75,000 £76,391
Median % change year-on-year +6.67% -1.82% +1.85%
75th Percentile £110,000 £100,000 £100,000
90th Percentile £136,250 £130,000 £123,750
England median annual salary £60,000 £55,000 £65,000
% change year-on-year +9.09% -15.38% +4.00%

Enterprise Software
Job Vacancy Trend in London

Job postings citing Enterprise Software as a proportion of all IT jobs advertised in London.
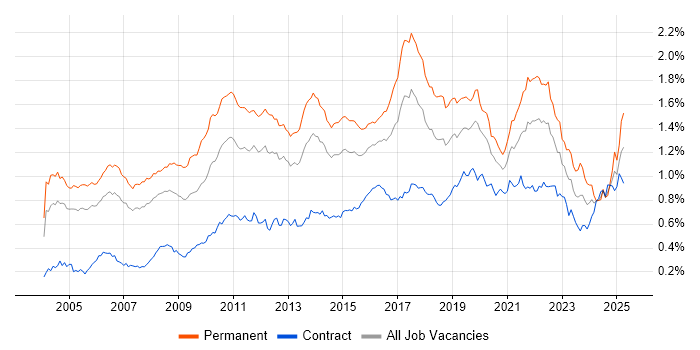
Job vacancy trend for Enterprise Software in London

Enterprise Software
Salary Trend in London

3-month moving average salary quoted in jobs citing Enterprise Software in London.

Salary trend for Enterprise Software in London

Enterprise Software
Salary Histogram in London

Salary distribution for jobs citing Enterprise Software in London over the 6 months to 28 May 2025.

Salary histogram for Enterprise Software in London

Enterprise Software
Job Locations in London

The table below looks at the demand and provides a guide to the median salaries quoted in IT jobs citing Enterprise Software within the London region over the 6 months to 28 May 2025. The 'Rank Change' column provides an indication of the change in demand within each location based on the same 6 month period last year.

Location Rank Change
on Same Period
Last Year
Matching
Permanent
IT Job Ads
Median Salary
Past 6 Months
Median Salary
% Change
on Same Period
Last Year
Live
Jobs
Central London +41 38 £76,250 -10.29% 14
South London -3 2 £52,656 +31.64%
Enterprise Software
England

Enterprise Software
Co-occurring Skills and Capabilities in London by Category

The follow tables expand on the table above by listing co-occurrences grouped by category. The same employment type, locality and period is covered with up to 20 co-occurrences shown in each of the following categories:

Application Platforms
1 6 (3.90%) Microsoft Exchange
1 6 (3.90%) SharePoint
2 2 (1.30%) CMS
3 1 (0.65%) Apache Spark
3 1 (0.65%) nginx
Applications
1 32 (20.78%) Maya
2 5 (3.25%) Chatbot
2 5 (3.25%) Microsoft Office
3 2 (1.30%) MS Visio
Business Applications
1 14 (9.09%) SAP S/4HANA
2 13 (8.44%) Dynamics CRM
3 10 (6.49%) SAP IBP
4 4 (2.60%) SAP CO
4 4 (2.60%) SAP FI
4 4 (2.60%) SAP FI/CO
4 4 (2.60%) SAP FSCM
5 3 (1.95%) Elite 3E
5 3 (1.95%) SAP CX
5 3 (1.95%) SAP IS-U
6 2 (1.30%) Carpe Diem
6 2 (1.30%) SAP Hybris
7 1 (0.65%) Eikon
7 1 (0.65%) Lorenzo
7 1 (0.65%) Salesforce CRM
7 1 (0.65%) SystmOne
7 1 (0.65%) Workday HCM
Cloud Services
1 46 (29.87%) AWS
2 42 (27.27%) Azure
3 19 (12.34%) SaaS
4 15 (9.74%) Cloud Computing
4 15 (9.74%) Microsoft Copilot
4 15 (9.74%) Power Platform
5 14 (9.09%) Amazon EC2
5 14 (9.09%) Amazon EKS
5 14 (9.09%) Amazon S3
5 14 (9.09%) AWS Lambda
5 14 (9.09%) Datadog
5 14 (9.09%) Serverless
6 13 (8.44%) GCP
6 13 (8.44%) Salesforce Commerce Cloud
7 11 (7.14%) Azure AI
7 11 (7.14%) Boomi
7 11 (7.14%) Microsoft 365
8 7 (4.55%) Entra ID
9 5 (3.25%) Dynamics 365
10 4 (2.60%) Microsoft Purview
Communications & Networking
1 6 (3.90%) Internet
2 2 (1.30%) DNS
3 1 (0.65%) DHCP
3 1 (0.65%) F5 BIG-IP LTM
3 1 (0.65%) IP Telephony
3 1 (0.65%) LAN
3 1 (0.65%) Network Security
3 1 (0.65%) TCP/IP
3 1 (0.65%) WAN
Database & Business Intelligence
1 14 (9.09%) Power BI
2 12 (7.79%) Data Lake
2 12 (7.79%) MongoDB
3 10 (6.49%) SAP BW
4 9 (5.84%) Tableau
5 8 (5.19%) Redis
6 7 (4.55%) Data Warehouse
6 7 (4.55%) MySQL
7 5 (3.25%) Azure SQL Database
8 2 (1.30%) Relational Database
9 1 (0.65%) CockroachDB
9 1 (0.65%) Electronic Patient Records
9 1 (0.65%) Flink
9 1 (0.65%) NoSQL
9 1 (0.65%) SQL Server
Development Applications
1 17 (11.04%) GitLab
2 15 (9.74%) Git
2 15 (9.74%) JUnit
2 15 (9.74%) Mockito
3 14 (9.09%) Cucumber
3 14 (9.09%) IntelliJ
3 14 (9.09%) Jenkins
3 14 (9.09%) Maven
4 5 (3.25%) Eclipse
5 2 (1.30%) JIRA
5 2 (1.30%) TeamCity
6 1 (0.65%) Postman
6 1 (0.65%) SoapUI
General
1 68 (44.16%) Finance
2 62 (40.26%) Law
3 60 (38.96%) Analytical Skills
4 47 (30.52%) Games
5 44 (28.57%) Social Skills
6 24 (15.58%) Banking
7 19 (12.34%) Presentation Skills
8 17 (11.04%) Marketing
9 14 (9.09%) Dutch Language
9 14 (9.09%) French Language
10 13 (8.44%) Retail
11 12 (7.79%) Manufacturing
11 12 (7.79%) Telecoms
12 10 (6.49%) Legal
13 7 (4.55%) Automotive
13 7 (4.55%) Turkish Language
14 5 (3.25%) Advertising
14 5 (3.25%) Inclusion and Diversity
15 4 (2.60%) Billing
15 4 (2.60%) Public Sector
Job Titles
1 64 (41.56%) Senior
2 50 (32.47%) Architect
3 34 (22.08%) Developer
4 27 (17.53%) IT Architect
5 22 (14.29%) Senior Architect
6 19 (12.34%) Solutions Architect
7 15 (9.74%) Analyst
7 15 (9.74%) Java Developer
7 15 (9.74%) Senior Developer
7 15 (9.74%) Senior Java Developer
8 14 (9.09%) AWS Developer
8 14 (9.09%) AWS DevOps
8 14 (9.09%) DevOps Developer
8 14 (9.09%) Java Pricing Developer
8 14 (9.09%) Pricing Developer
8 14 (9.09%) Senior DevOps
9 12 (7.79%) CRM Architect
9 12 (7.79%) Senior Analyst
10 11 (7.14%) Consultant
10 11 (7.14%) Salesforce Architect
Libraries, Frameworks & Software Standards
1 15 (9.74%) JMS
1 15 (9.74%) Spring
1 15 (9.74%) Spring Boot
2 14 (9.09%) ActiveMQ
2 14 (9.09%) RESTful
3 12 (7.79%) REST
4 10 (6.49%) .NET
5 8 (5.19%) .NET Core
5 8 (5.19%) Laravel
5 8 (5.19%) Middleware
6 7 (4.55%) AngularJS
6 7 (4.55%) HTML
6 7 (4.55%) Memcached
7 6 (3.90%) ASP.NET
8 5 (3.25%) ASP.NET MVC
8 5 (3.25%) ASP.NET Web API
8 5 (3.25%) HTML5
8 5 (3.25%) LINQ
9 4 (2.60%) Node.js
10 3 (1.95%) XML
Miscellaneous
1 16 (10.39%) Management Information System
2 14 (9.09%) Credit Derivative
3 12 (7.79%) Cloud Native
4 11 (7.14%) Algorithms
4 11 (7.14%) Analytical Mindset
4 11 (7.14%) IoT
5 9 (5.84%) Blockchain
6 8 (5.19%) Onboarding
6 8 (5.19%) PMI
7 7 (4.55%) Reinsurance
8 6 (3.90%) Mobile App
9 4 (2.60%) Data Centre
10 3 (1.95%) Distributed Systems
10 3 (1.95%) Foreign Exchange (FX)
10 3 (1.95%) Product Ownership
10 3 (1.95%) Shadow IT
11 2 (1.30%) NHS
11 2 (1.30%) Public Cloud
11 2 (1.30%) Self-Motivation
12 1 (0.65%) Legacy Systems
Operating Systems
1 15 (9.74%) Linux
2 8 (5.19%) Windows
3 2 (1.30%) Windows 10
3 2 (1.30%) Windows Server
4 1 (0.65%) Android
4 1 (0.65%) Windows Server 2012
4 1 (0.65%) Windows Server 2016
4 1 (0.65%) Windows Server 2019
Processes & Methodologies
1 59 (38.31%) Analytics
2 45 (29.22%) Business Strategy
3 44 (28.57%) Agile
4 43 (27.92%) Cybersecurity
5 37 (24.03%) Roadmaps
6 36 (23.38%) Problem-Solving
6 36 (23.38%) Risk Management
7 33 (21.43%) ERP
7 33 (21.43%) IT Strategy
8 30 (19.48%) Artificial Intelligence
9 29 (18.83%) CI/CD
9 29 (18.83%) DevOps
10 27 (17.53%) Mathematics
10 27 (17.53%) Project Management
11 26 (16.88%) Mentoring
11 26 (16.88%) Microservices
12 25 (16.23%) Technology Strategy
13 24 (15.58%) Project Delivery
14 23 (14.94%) Software Engineering
15 21 (13.64%) Integration Patterns
Programming Languages
1 23 (14.94%) Python
2 21 (13.64%) Java
3 19 (12.34%) SQL
4 17 (11.04%) C++
5 13 (8.44%) C#
6 9 (5.84%) JavaScript
7 8 (5.19%) PHP
8 2 (1.30%) Go
8 2 (1.30%) Rust
9 1 (0.65%) ActionScript
9 1 (0.65%) ActionScript 2.0
9 1 (0.65%) C
9 1 (0.65%) Kotlin
9 1 (0.65%) PowerShell
9 1 (0.65%) R
9 1 (0.65%) Ruby
9 1 (0.65%) TypeScript
Qualifications
1 60 (38.96%) Degree
2 11 (7.14%) Azure Certification
2 11 (7.14%) Computer Science Degree
3 10 (6.49%) PMI Certification
4 4 (2.60%) ACCA
4 4 (2.60%) CIMA
5 3 (1.95%) Master's Degree
6 2 (1.30%) PMP
7 1 (0.65%) APMP
7 1 (0.65%) AWS Certification
7 1 (0.65%) CCNA
7 1 (0.65%) CCNP
7 1 (0.65%) Cisco Certification
7 1 (0.65%) Microsoft Certification
7 1 (0.65%) PhD
7 1 (0.65%) SC Cleared
7 1 (0.65%) Security Cleared
Quality Assurance & Compliance
1 12 (7.79%) GDPR
2 11 (7.14%) California Consumer Privacy Act
3 2 (1.30%) Cyber Essentials
4 1 (0.65%) Accessibility
4 1 (0.65%) COSO
4 1 (0.65%) DICOM
4 1 (0.65%) HL7
4 1 (0.65%) ISO/IEC 27001
4 1 (0.65%) QA
4 1 (0.65%) SNOMED CT
System Software
1 8 (5.19%) Active Directory
2 3 (1.95%) BitLocker
3 1 (0.65%) Virtual Desktop
3 1 (0.65%) Virtual Machines
Systems Management
1 16 (10.39%) Terraform
2 14 (9.09%) Ansible
3 5 (3.25%) Kubernetes
4 4 (2.60%) Microsoft Intune
4 4 (2.60%) Single Sign-On
5 1 (0.65%) Active Directory Federation Services
5 1 (0.65%) SCCM
Vendors
1 45 (29.22%) Microsoft
1 45 (29.22%) SAP
2 17 (11.04%) Salesforce
3 15 (9.74%) IBM
4 13 (8.44%) Google
4 13 (8.44%) Workday
5 12 (7.79%) Dell
5 12 (7.79%) Oracle
5 12 (7.79%) ServiceNow
6 11 (7.14%) Adobe
6 11 (7.14%) MuleSoft
6 11 (7.14%) OpenAI
7 7 (4.55%) Ariba
8 5 (3.25%) Facebook
8 5 (3.25%) YouTube
9 3 (1.95%) Intapp
9 3 (1.95%) Proofpoint
9 3 (1.95%) Zoho
10 2 (1.30%) Bloomberg
10 2 (1.30%) Cisco