Use Case Jobs in London

Use Cases
England > London

The table below provides summary statistics for permanent job vacancies advertised in London requiring Use Case skills. It includes a benchmarking guide to the annual salaries offered in vacancies that cited Use Case over the 6 months leading up to 18 May 2025, comparing them to the same period in the previous two years.

6 months to
18 May 2025
Same period 2024 Same period 2023
Rank 229 208 198
Rank change year-on-year -21 -10 -7
Permanent jobs citing Use Case 173 354 624
As % of all permanent jobs advertised in London 1.34% 1.50% 1.86%
As % of the Processes & Methodologies category 1.39% 1.64% 1.95%
Number of salaries quoted 91 186 292
10th Percentile £61,250 £50,134 £53,017
25th Percentile £69,375 £62,500 £59,750
Median annual salary (50th Percentile) £80,000 £75,000 £70,000
Median % change year-on-year +6.67% +7.14% -9.68%
75th Percentile £97,500 £95,000 £87,500
90th Percentile £120,000 £115,000 £105,000
England median annual salary £65,000 £57,500 £65,000
% change year-on-year +13.04% -11.54% -3.70%

All Process and Methodology Skills
London

Use Case falls under the Processes and Methodologies category. For comparison with the information above, the following table provides summary statistics for all permanent job vacancies requiring process or methodology skills in London.

Permanent vacancies with a requirement for process or methodology skills 12,445 21,520 32,059
As % of all permanent jobs advertised in London 96.16% 90.99% 95.36%
Number of salaries quoted 7,282 15,899 23,123
10th Percentile £42,000 £37,500 £43,180
25th Percentile £55,813 £51,500 £55,000
Median annual salary (50th Percentile) £75,000 £70,073 £75,000
Median % change year-on-year +7.03% -6.57% +7.14%
75th Percentile £100,000 £95,000 £95,000
90th Percentile £122,500 £115,000 £115,000
England median annual salary £57,500 £55,000 £62,500
% change year-on-year +4.55% -12.00% +4.17%

Use Case
Job Vacancy Trend in London

Job postings citing Use Case as a proportion of all IT jobs advertised in London.
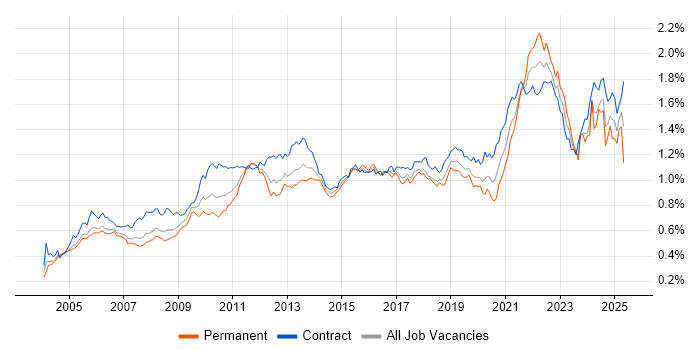
Job vacancy trend for Use Case in London

Use Case
Salary Trend in London

3-month moving average salary quoted in jobs citing Use Case in London.

Salary trend for Use Case in London

Use Case
Salary Histogram in London

Salary distribution for jobs citing Use Case in London over the 6 months to 18 May 2025.

Salary histogram for Use Case in London

Use Case
Job Locations in London

The table below looks at the demand and provides a guide to the median salaries quoted in IT jobs citing Use Case within the London region over the 6 months to 18 May 2025. The 'Rank Change' column provides an indication of the change in demand within each location based on the same 6 month period last year.

Location Rank Change
on Same Period
Last Year
Matching
Permanent
IT Job Ads
Median Salary
Past 6 Months
Median Salary
% Change
on Same Period
Last Year
Live
Jobs
Central London +31 44 £75,000 -9.09% 21
Use Case
England

Use Case
Co-occurring Skills and Capabilities in London by Category

The follow tables expand on the table above by listing co-occurrences grouped by category. The same employment type, locality and period is covered with up to 20 co-occurrences shown in each of the following categories:

Application Platforms
1 9 (5.20%) Apache Spark
2 7 (4.05%) Confluence
3 3 (1.73%) Apache
4 1 (0.58%) Ethereum
4 1 (0.58%) Hyperledger
Applications
1 12 (6.94%) MS Visio
2 5 (2.89%) Microsoft Excel
3 4 (2.31%) Chatbot
4 3 (1.73%) Microsoft Office
5 2 (1.16%) Adobe XD
5 2 (1.16%) Microsoft Project
6 1 (0.58%) Microsoft PowerPoint
Business Applications
1 4 (2.31%) Aladdin
1 4 (2.31%) Remedy ITSM
2 3 (1.73%) Distributed Ledger
2 3 (1.73%) SAP S/4HANA
3 1 (0.58%) Dynamics CRM
3 1 (0.58%) Oracle Payroll
3 1 (0.58%) SAP CO
3 1 (0.58%) SAP FI
3 1 (0.58%) SAP FI/CO
3 1 (0.58%) SAP LE
3 1 (0.58%) SAP MM
3 1 (0.58%) SAP PS
3 1 (0.58%) Workday HCM
Cloud Services
1 46 (26.59%) Azure
2 25 (14.45%) AWS
3 18 (10.40%) Power Platform
4 16 (9.25%) Microsoft Purview
5 15 (8.67%) Collibra
6 14 (8.09%) GCP
7 6 (3.47%) Azure Sentinel
7 6 (3.47%) dbt
7 6 (3.47%) Google Analytics
7 6 (3.47%) SaaS
8 5 (2.89%) Amazon Bedrock
8 5 (2.89%) Azure Data Factory
8 5 (2.89%) Azure Synapse Analytics
8 5 (2.89%) Snowflake
9 4 (2.31%) Azure AI
9 4 (2.31%) Azure DevOps
9 4 (2.31%) Microsoft 365
9 4 (2.31%) PaaS
10 3 (1.73%) Fivetran
10 3 (1.73%) Miro
Communications & Networking
1 4 (2.31%) Firewall
2 3 (1.73%) DNS
3 1 (0.58%) 4G
3 1 (0.58%) 5G
3 1 (0.58%) Network Security
3 1 (0.58%) Radio Access Network
3 1 (0.58%) WAN
Database & Business Intelligence
1 18 (10.40%) Power BI
2 16 (9.25%) Metadata
3 13 (7.51%) Tableau
4 11 (6.36%) Data Warehouse
5 9 (5.20%) IBM InfoSphere
6 7 (4.05%) Amazon Redshift
7 6 (3.47%) Hadoop
7 6 (3.47%) NoSQL
7 6 (3.47%) Relational Database
8 5 (2.89%) Data Lake
9 4 (2.31%) Apache Hive
9 4 (2.31%) Big Data
9 4 (2.31%) Data Vault
9 4 (2.31%) Oracle Database
10 3 (1.73%) Delta Lake
10 3 (1.73%) Neo4j
10 3 (1.73%) Parquet
10 3 (1.73%) SQL Server Integration Services
11 2 (1.16%) QlikView
11 2 (1.16%) RDBMS
Development Applications
1 9 (5.20%) JIRA
2 6 (3.47%) Grunt
2 6 (3.47%) Jasmine
2 6 (3.47%) Mocha
2 6 (3.47%) webpack
3 5 (2.89%) Eclipse
4 1 (0.58%) Git
4 1 (0.58%) Selenium
4 1 (0.58%) Team Foundation Server
General
1 67 (38.73%) Social Skills
2 61 (35.26%) Finance
3 56 (32.37%) Analytical Skills
4 43 (24.86%) Law
5 38 (21.97%) Marketing
6 19 (10.98%) Banking
7 17 (9.83%) Presentation Skills
8 12 (6.94%) Inclusion and Diversity
8 12 (6.94%) Retail
9 11 (6.36%) Publishing
10 10 (5.78%) Advertising
10 10 (5.78%) Retail Banking
11 6 (3.47%) Brand Awareness
11 6 (3.47%) Legal
12 5 (2.89%) Financial Institution
13 4 (2.31%) Back Office
13 4 (2.31%) Organisational Skills
14 2 (1.16%) Public Sector
14 2 (1.16%) Telecoms
15 1 (0.58%) Manufacturing
Job Titles
1 40 (23.12%) Analyst
2 35 (20.23%) Senior
3 34 (19.65%) Lead
4 23 (13.29%) Business Analyst
5 17 (9.83%) Architect
6 15 (8.67%) Senior Manager
7 14 (8.09%) Senior Analyst
8 11 (6.36%) Consultant
9 10 (5.78%) Data Engineer
10 9 (5.20%) Data Steward
10 9 (5.20%) Head of Business Intelligence
11 8 (4.62%) Developer
11 8 (4.62%) Senior Transformation Manager
11 8 (4.62%) Solutions Architect
11 8 (4.62%) Transformation Manager
12 7 (4.05%) Data Scientist
12 7 (4.05%) Lead Developer
12 7 (4.05%) Senior Data Scientist
12 7 (4.05%) SOC Analyst
13 6 (3.47%) IT Manager
Libraries, Frameworks & Software Standards
1 8 (4.62%) CSS
2 7 (4.05%) AngularJS
2 7 (4.05%) RESTful
3 6 (3.47%) Ajax
3 6 (3.47%) Bootstrap
3 6 (3.47%) Chai
3 6 (3.47%) Enzyme
3 6 (3.47%) Jest
3 6 (3.47%) Kafka
3 6 (3.47%) LESS
3 6 (3.47%) Material-UI
3 6 (3.47%) Next.js
3 6 (3.47%) OAuth
3 6 (3.47%) OAuth2
3 6 (3.47%) OpenID
3 6 (3.47%) React
3 6 (3.47%) Redux
3 6 (3.47%) Sass
3 6 (3.47%) Semantic UI
3 6 (3.47%) Vue
Miscellaneous
1 21 (12.14%) Management Information System
2 14 (8.09%) Onboarding
3 11 (6.36%) Cloud Native
4 9 (5.20%) Product Ownership
5 8 (4.62%) CSOC
5 8 (4.62%) Virtual Team
6 7 (4.05%) Foreign Exchange (FX)
7 6 (3.47%) Algorithms
7 6 (3.47%) Derivative
7 6 (3.47%) Digital Media
7 6 (3.47%) Enterprise Software
7 6 (3.47%) Multi-touch
7 6 (3.47%) Reference Data
8 5 (2.89%) Analytical Mindset
9 3 (1.73%) Blockchain
9 3 (1.73%) Distributed Denial-of-Service
9 3 (1.73%) Security Posture
10 2 (1.16%) Cyber Kill Chain
10 2 (1.16%) DTCC
10 2 (1.16%) SWIFT Messaging Network
Operating Systems
1 4 (2.31%) Windows
2 3 (1.73%) Windows 10
2 3 (1.73%) Windows Server
3 2 (1.16%) Linux
3 2 (1.16%) Unix
4 1 (0.58%) Android
4 1 (0.58%) Apple iOS
Processes & Methodologies
1 66 (38.15%) Agile
2 59 (34.10%) Artificial Intelligence
3 46 (26.59%) Analytics
4 40 (23.12%) Data Modelling
5 34 (19.65%) Problem-Solving
6 30 (17.34%) Machine Learning
7 29 (16.76%) User Stories
8 28 (16.18%) Business Intelligence
9 27 (15.61%) Data Management
9 27 (15.61%) Roadmaps
10 25 (14.45%) Data Governance
10 25 (14.45%) Data Science
10 25 (14.45%) Decision-Making
10 25 (14.45%) Stakeholder Management
11 24 (13.87%) Data Architecture
11 24 (13.87%) Project Management
12 23 (13.29%) CI/CD
12 23 (13.29%) DevOps
13 22 (12.72%) Business Strategy
13 22 (12.72%) Mentoring
Programming Languages
1 40 (23.12%) SQL
2 35 (20.23%) Python
3 8 (4.62%) JavaScript
4 6 (3.47%) Java
4 6 (3.47%) TypeScript
5 5 (2.89%) Apex Code
5 5 (2.89%) C
5 5 (2.89%) C++
6 4 (2.31%) Data Analysis Expressions
7 3 (1.73%) Cypher
7 3 (1.73%) Kusto Query Language
7 3 (1.73%) T-SQL
8 2 (1.16%) Scala
9 1 (0.58%) Bash
9 1 (0.58%) C#
9 1 (0.58%) Go
9 1 (0.58%) SOQL
Qualifications
1 36 (20.81%) Degree
2 11 (6.36%) SC Cleared
2 11 (6.36%) Security Cleared
3 9 (5.20%) Computer Science Degree
4 5 (2.89%) Master's Degree
5 4 (2.31%) CISSP
5 4 (2.31%) CompTIA Security+
5 4 (2.31%) PhD
6 3 (1.73%) CBAP
7 2 (1.16%) GCFA
7 2 (1.16%) GCIA
7 2 (1.16%) GCIH
7 2 (1.16%) TOGAF Certification
8 1 (0.58%) ACSA
8 1 (0.58%) ACSP
8 1 (0.58%) Azure Certification
8 1 (0.58%) CCSK
8 1 (0.58%) Cisco Certification
8 1 (0.58%) ISEB
8 1 (0.58%) ISSAP
Quality Assurance & Compliance
1 19 (10.98%) Data Quality
2 17 (9.83%) GDPR
3 15 (8.67%) Accessibility
4 4 (2.31%) MiFID
5 3 (1.73%) HIPAA
5 3 (1.73%) NIST
6 2 (1.16%) EMIR
6 2 (1.16%) ISO 20022
6 2 (1.16%) SEPA
7 1 (0.58%) COBIT
7 1 (0.58%) Dodd-Frank
7 1 (0.58%) NCSC
7 1 (0.58%) PSD2
7 1 (0.58%) QA
System Software
1 7 (4.05%) Docker
2 4 (2.31%) Active Directory
Systems Management
1 8 (4.62%) Kubernetes
1 8 (4.62%) QRadar
2 2 (1.16%) Terraform
3 1 (0.58%) Ansible
3 1 (0.58%) Automic
3 1 (0.58%) Grafana
3 1 (0.58%) Kibana
3 1 (0.58%) logstash
3 1 (0.58%) Prometheus
3 1 (0.58%) SCCM
3 1 (0.58%) Single Sign-On
Vendors
1 38 (21.97%) Microsoft
2 17 (9.83%) Informatica
3 15 (8.67%) Databricks
4 10 (5.78%) IBM
5 8 (4.62%) Google
5 8 (4.62%) Salesforce
6 6 (3.47%) SAP
6 6 (3.47%) Yahoo!
7 5 (2.89%) OpenAI
7 5 (2.89%) Oracle
8 4 (2.31%) Avaloq
8 4 (2.31%) Bloomberg
8 4 (2.31%) Remedy
8 4 (2.31%) ServiceNow
9 3 (1.73%) CheckPoint
9 3 (1.73%) Foundry
9 3 (1.73%) LogRhythm
9 3 (1.73%) Qualys
9 3 (1.73%) Splunk
9 3 (1.73%) VMware