Configuration Management Jobs in the UK excluding London

Configuration Management
UK > UK excluding London

The table below provides summary statistics for permanent job vacancies advertised in the UK excluding London requiring Configuration Management skills. It includes a benchmarking guide to the annual salaries offered in vacancies that cited Configuration Management over the 6 months leading up to 27 May 2025, comparing them to the same period in the previous two years.

6 months to
27 May 2025
Same period 2024 Same period 2023
Rank 218 242 248
Rank change year-on-year +24 +6 -40
Permanent jobs citing Configuration Management 517 830 823
As % of all permanent jobs advertised in the UK excluding London 1.33% 1.13% 1.41%
As % of the Processes & Methodologies category 1.44% 1.37% 1.47%
Number of salaries quoted 389 440 419
10th Percentile £48,869 £34,000 £37,347
25th Percentile £55,000 £43,750 £46,250
Median annual salary (50th Percentile) £60,000 £55,000 £62,500
Median % change year-on-year +9.09% -12.00% +13.64%
75th Percentile £68,000 £66,294 £77,500
90th Percentile £73,000 £81,275 £85,250
UK median annual salary £65,000 £60,000 £70,000
% change year-on-year +8.33% -14.29% +12.00%

All Process and Methodology Skills
UK excluding London

Configuration Management falls under the Processes and Methodologies category. For comparison with the information above, the following table provides summary statistics for all permanent job vacancies requiring process or methodology skills in the UK excluding London.

Permanent vacancies with a requirement for process or methodology skills 35,974 60,639 55,898
As % of all permanent jobs advertised in the UK excluding London 92.75% 82.65% 95.57%
Number of salaries quoted 17,037 41,817 28,998
10th Percentile £26,500 £27,300 £30,500
25th Percentile £37,500 £36,250 £40,000
Median annual salary (50th Percentile) £51,645 £50,000 £55,000
Median % change year-on-year +3.29% -9.09% +4.76%
75th Percentile £65,000 £65,000 £70,000
90th Percentile £77,500 £77,500 £82,500
UK median annual salary £57,500 £55,000 £61,000
% change year-on-year +4.55% -9.84% +1.67%

Configuration Management
Job Vacancy Trend in the UK excluding London

Job postings citing Configuration Management as a proportion of all IT jobs advertised in the UK excluding London.
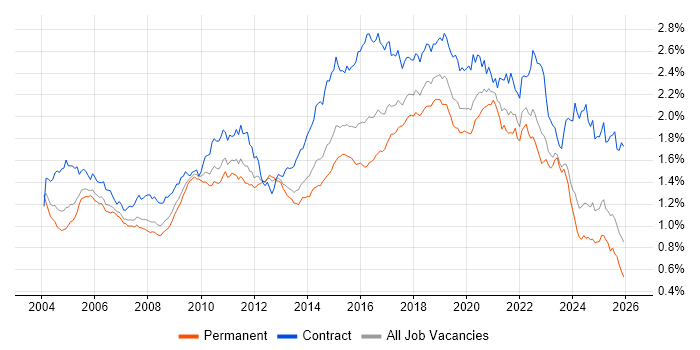
Job vacancy trend for Configuration Management in the UK excluding London

Configuration Management
Salary Trend in the UK excluding London

3-month moving average salary quoted in jobs citing Configuration Management in the UK excluding London.

Salary trend for Configuration Management in the UK excluding London

Configuration Management
Salary Histogram in the UK excluding London

Salary distribution for jobs citing Configuration Management in the UK excluding London over the 6 months to 27 May 2025.

Salary histogram for Configuration Management in the UK excluding London

Configuration Management
Job Locations in the UK excluding London

The table below looks at the demand and provides a guide to the median salaries quoted in IT jobs citing Configuration Management within the UK excluding London region over the 6 months to 27 May 2025. The 'Rank Change' column provides an indication of the change in demand within each location based on the same 6 month period last year.

Location Rank Change
on Same Period
Last Year
Matching
Permanent
IT Job Ads
Median Salary
Past 6 Months
Median Salary
% Change
on Same Period
Last Year
Live
Jobs
South East +74 266 £65,000 +23.69% 271
North of England +26 87 £50,818 -3.20% 174
North West +10 77 £50,818 -11.62% 88
South West +1 45 £52,500 -4.55% 105
Wales +58 38 £65,000 +30.00% 20
Midlands +6 36 £67,500 +17.39% 131
Scotland +54 33 £44,000 -41.33% 52
West Midlands +23 31 £70,000 +21.74% 71
Yorkshire +41 9 £72,500 +61.11% 71
East of England -18 8 £57,500 - 117
East Midlands +24 5 £57,000 +14.00% 51
Northern Ireland +32 4 - - 13
North East +38 1 - - 16
Configuration Management
UK

Configuration Management
Co-occurring Skills and Capabilities in the UK excluding London by Category

The follow tables expand on the table above by listing co-occurrences grouped by category. The same employment type, locality and period is covered with up to 20 co-occurrences shown in each of the following categories:

Application Platforms
1 31 (6.00%) SharePoint
2 14 (2.71%) Confluence
3 11 (2.13%) IIS
4 5 (0.97%) nginx
5 1 (0.19%) CMS
5 1 (0.19%) Microsoft Exchange
Applications
1 32 (6.19%) Microsoft Office
2 24 (4.64%) Windchill
3 5 (0.97%) Mozilla Thunderbird
4 4 (0.77%) Simulink
5 1 (0.19%) GNU Octave
5 1 (0.19%) MS Visio
Business Applications
1 24 (4.64%) Teamcenter
2 1 (0.19%) Dynamics CRM
2 1 (0.19%) Remedy ITSM
Cloud Services
1 69 (13.35%) AWS
2 55 (10.64%) Azure
3 26 (5.03%) Amazon EC2
4 24 (4.64%) Amazon S3
5 22 (4.26%) Virtual Private Cloud
6 21 (4.06%) Amazon CloudWatch
7 19 (3.68%) Microsoft 365
8 18 (3.48%) IaaS
8 18 (3.48%) SaaS
9 17 (3.29%) PaaS
10 16 (3.09%) Amazon ELB
10 16 (3.09%) AWS KMS
10 16 (3.09%) Serverless
11 14 (2.71%) Amazon Glacier
12 11 (2.13%) AWS Lambda
12 11 (2.13%) Azure DevOps
12 11 (2.13%) GCP
13 8 (1.55%) Amazon ECS
13 8 (1.55%) Entra ID
14 5 (0.97%) OneDrive
Communications & Networking
1 20 (3.87%) Firewall
2 17 (3.29%) DNS
2 17 (3.29%) VoIP
3 12 (2.32%) MPLS
4 11 (2.13%) Cisco ISE
4 11 (2.13%) DHCP
4 11 (2.13%) Ethernet
5 8 (1.55%) HTTP
6 7 (1.35%) FTP
6 7 (1.35%) SAN
6 7 (1.35%) SMTP
6 7 (1.35%) SSH
6 7 (1.35%) WAN
7 6 (1.16%) NAS
7 6 (1.16%) SD-WAN
7 6 (1.16%) VSAN
8 5 (0.97%) Network Security
8 5 (0.97%) VPN
8 5 (0.97%) Wi-Fi
9 4 (0.77%) SSL
Database & Business Intelligence
1 20 (3.87%) Amazon RDS
2 14 (2.71%) SQL Server
3 8 (1.55%) OLTP
4 4 (0.77%) PostgreSQL
5 3 (0.58%) Data Lake
5 3 (0.58%) DB2
5 3 (0.58%) MariaDB
5 3 (0.58%) NoSQL
5 3 (0.58%) Power BI
5 3 (0.58%) SQL Server Reporting Services
6 2 (0.39%) Amazon Aurora
7 1 (0.19%) Azure SQL Database
7 1 (0.19%) DynamoDB
7 1 (0.19%) MongoDB
7 1 (0.19%) MySQL
7 1 (0.19%) RDBMS
7 1 (0.19%) Relational Database
Development Applications
1 88 (17.02%) Rational DOORS
2 48 (9.28%) JIRA
3 29 (5.61%) Jenkins
4 23 (4.45%) Git
5 17 (3.29%) Vagrant
6 16 (3.09%) Atlassian Bamboo
7 15 (2.90%) Bitbucket
8 11 (2.13%) GitLab
9 6 (1.16%) Visual Studio
10 5 (0.97%) Sonatype Nexus
11 4 (0.77%) Subversion
12 3 (0.58%) Bitbucket Server
13 2 (0.39%) CircleCI
13 2 (0.39%) Team Foundation Server
14 1 (0.19%) Cucumber
14 1 (0.19%) FitNesse
14 1 (0.19%) LabVIEW
14 1 (0.19%) Newman
14 1 (0.19%) Selenium
14 1 (0.19%) TeamCity
General
1 121 (23.40%) Social Skills
2 27 (5.22%) Analytical Skills
3 26 (5.03%) Manufacturing
4 21 (4.06%) Public Sector
5 11 (2.13%) Finance
5 11 (2.13%) Inclusion and Diversity
6 10 (1.93%) Banking
7 9 (1.74%) Electronics
7 9 (1.74%) Retail
8 8 (1.55%) Marketing
9 7 (1.35%) Private Banking
10 6 (1.16%) Legal
10 6 (1.16%) Telecoms
11 5 (0.97%) Aerospace
11 5 (0.97%) Military
11 5 (0.97%) Presentation Skills
12 3 (0.58%) Advertising
12 3 (0.58%) Law
13 2 (0.39%) Automotive
13 2 (0.39%) Pharmaceutical
Job Titles
1 170 (32.88%) Senior
2 127 (24.56%) Architect
3 98 (18.96%) Software Engineer
4 56 (10.83%) Software Architect
4 56 (10.83%) Systems Architect
5 54 (10.44%) Senior Software Engineer
6 51 (9.86%) Test Engineer
7 50 (9.67%) Senior Software Test Engineer
7 50 (9.67%) Senior Test Engineer
7 50 (9.67%) Software Test Engineer
8 39 (7.54%) Principal Engineer
9 38 (7.35%) Principal Software Engineer
10 34 (6.58%) Lead
11 22 (4.26%) Configuration Manager
11 22 (4.26%) Project Manager
12 20 (3.87%) DevOps Engineer
13 19 (3.68%) Infrastructure Engineer
14 17 (3.29%) Cloud Engineer
15 16 (3.09%) Instrumentation Engineer
15 16 (3.09%) Senior Electrical Engineer
Libraries, Frameworks & Software Standards
1 65 (12.57%) Middleware
2 11 (2.13%) .NET
3 10 (1.93%) JSON
4 9 (1.74%) HTML
5 7 (1.35%) ARM Templates
6 4 (0.77%) AWS CDK
6 4 (0.77%) Elastic Stack
6 4 (0.77%) LDAP
7 3 (0.58%) REST
8 1 (0.19%) AngularJS
8 1 (0.19%) JWT
8 1 (0.19%) ModSecurity
8 1 (0.19%) Node.js
8 1 (0.19%) OAuth
8 1 (0.19%) OAuth2
8 1 (0.19%) OpenID
8 1 (0.19%) React
8 1 (0.19%) RESTful
8 1 (0.19%) Spring Boot
8 1 (0.19%) YAML
Miscellaneous
1 83 (16.05%) Management Information System
2 13 (2.51%) Public Cloud
3 12 (2.32%) CMDB
4 11 (2.13%) Client/Server
4 11 (2.13%) Hybrid Cloud
4 11 (2.13%) Private Cloud
4 11 (2.13%) Replication
5 9 (1.74%) Self-Motivation
6 8 (1.55%) Clustering
7 4 (0.77%) GNSS
7 4 (0.77%) Self-Driving Car
8 3 (0.58%) Algorithms
8 3 (0.58%) Data Centre
8 3 (0.58%) Data Structures
8 3 (0.58%) Virtual Team
9 2 (0.39%) Embedded Systems
9 2 (0.39%) Onboarding
10 1 (0.19%) Enterprise Software
10 1 (0.19%) IoT
10 1 (0.19%) Mobile App
Operating Systems
1 50 (9.67%) Linux
2 40 (7.74%) Windows
3 17 (3.29%) VMS
4 14 (2.71%) Red Hat Enterprise Linux
5 13 (2.51%) Windows Server
6 8 (1.55%) Amazon Linux
6 8 (1.55%) Ubuntu
7 5 (0.97%) Android
8 4 (0.77%) Unix
9 2 (0.39%) Apple iOS
9 2 (0.39%) Debian
9 2 (0.39%) FreeRTOS
9 2 (0.39%) Windows 10
10 1 (0.19%) SafeRTOS
10 1 (0.19%) VxWorks
10 1 (0.19%) Windows Server 2008
10 1 (0.19%) Windows Server 2012
10 1 (0.19%) Windows Server 2019
Processes & Methodologies
1 237 (45.84%) Agile
2 197 (38.10%) Computer Science
3 192 (37.14%) Waterfall
4 184 (35.59%) UML
5 129 (24.95%) DevOps
6 128 (24.76%) Mentoring
7 114 (22.05%) Software Engineering
8 90 (17.41%) Systems Engineering
9 88 (17.02%) Continuous Improvement
10 76 (14.70%) Requirements Management
11 74 (14.31%) Design Patterns
11 74 (14.31%) Test Automation
12 71 (13.73%) Customer Requirements
13 65 (12.57%) Software Testing
14 64 (12.38%) SDLC
14 64 (12.38%) Validation
15 57 (11.03%) Business Case
16 56 (10.83%) Cost-Benefit Analysis
16 56 (10.83%) Open Source
16 56 (10.83%) Systems Thinking
Programming Languages
1 99 (19.15%) Ada
2 47 (9.09%) Python
3 44 (8.51%) Java
4 35 (6.77%) Ada 95
5 34 (6.58%) PowerShell
6 26 (5.03%) C
7 22 (4.26%) SQL
8 18 (3.48%) C#
9 17 (3.29%) Bash
10 16 (3.09%) Groovy
10 16 (3.09%) VB
11 12 (2.32%) Perl
12 11 (2.13%) JavaScript
13 10 (1.93%) C++
14 8 (1.55%) PL/SQL
15 6 (1.16%) MATLAB
16 5 (0.97%) Ruby
17 4 (0.77%) R
17 4 (0.77%) Shell Script
17 4 (0.77%) TypeScript
Qualifications
1 337 (65.18%) Degree
2 298 (57.64%) BPSS Clearance
3 193 (37.33%) Chartered Engineer
4 71 (13.73%) Computer Science Degree
5 43 (8.32%) Security Cleared
6 31 (6.00%) SC Cleared
7 22 (4.26%) DV Cleared
8 16 (3.09%) Azure Certification
9 15 (2.90%) ITIL Certification
10 12 (2.32%) AWS Certification
11 6 (1.16%) HNC
11 6 (1.16%) HND
11 6 (1.16%) VMware Certified Professional (VCP)
12 4 (0.77%) ITIL Foundation Certificate
13 3 (0.58%) Cisco Certification
14 2 (0.39%) CCNA
15 1 (0.19%) CCNP
15 1 (0.19%) Microsoft Certification
15 1 (0.19%) PMI Certification
15 1 (0.19%) PMP
Quality Assurance & Compliance
1 176 (34.04%) ISO/IEC 12207
2 56 (10.83%) ISO/IEC 15288
3 25 (4.84%) SLA
4 21 (4.06%) QA
5 5 (0.97%) ISO/IEC 27001
6 4 (0.77%) PMO
7 3 (0.58%) Accessibility
8 2 (0.39%) Sarbanes-Oxley
9 1 (0.19%) Cyber Essentials
9 1 (0.19%) DO-178B
9 1 (0.19%) DO-254
9 1 (0.19%) GDPR
9 1 (0.19%) IEC 61508
9 1 (0.19%) IEC 62304
9 1 (0.19%) ISO 26262
9 1 (0.19%) ISO 9001
9 1 (0.19%) NCSC
9 1 (0.19%) NIST
9 1 (0.19%) PCI DSS
9 1 (0.19%) SOC 2
System Software
1 34 (6.58%) Docker
2 28 (5.42%) Active Directory
3 18 (3.48%) VMware Infrastructure
4 9 (1.74%) DFS Replication
5 7 (1.35%) Hyper-V
6 6 (1.16%) VMware ESXi
6 6 (1.16%) vSphere
7 4 (0.77%) Firmware
7 4 (0.77%) Virtual Machines
8 3 (0.58%) Virtual Desktop
9 2 (0.39%) Dovecot
9 2 (0.39%) Embedded Firmware
9 2 (0.39%) Postfix
9 2 (0.39%) Squid
10 1 (0.19%) NDS
10 1 (0.19%) NFS
Systems Management
1 49 (9.48%) Ansible
2 42 (8.12%) Terraform
3 31 (6.00%) Kubernetes
4 21 (4.06%) Puppet
5 18 (3.48%) Grafana
5 18 (3.48%) Prometheus
6 12 (2.32%) Progress Chef
7 7 (1.35%) vRealize
8 6 (1.16%) PowerCLI
8 6 (1.16%) vCenter Server
8 6 (1.16%) vMotion
9 5 (0.97%) Nessus
9 5 (0.97%) Proxmox
10 4 (0.77%) Microsoft Intune
10 4 (0.77%) Nagios
11 3 (0.58%) SCOM
12 2 (0.39%) SCCM
13 1 (0.19%) CA Single Sign-On
13 1 (0.19%) cPanel
13 1 (0.19%) FortiGate
Vendors
1 70 (13.54%) IBM
2 60 (11.61%) Microsoft
3 26 (5.03%) ServiceNow
3 26 (5.03%) VMware
4 23 (4.45%) SAP
5 22 (4.26%) Juniper
6 19 (3.68%) Oracle
7 18 (3.48%) Cisco
8 16 (3.09%) Siemens
9 13 (2.51%) Red Hat
10 11 (2.13%) SevOne
11 8 (1.55%) HP
12 7 (1.35%) Avaloq
12 7 (1.35%) Citrix
12 7 (1.35%) Veeam
13 4 (0.77%) Intel
13 4 (0.77%) Splunk
14 3 (0.58%) Sybase
15 2 (0.39%) ArcSight
15 2 (0.39%) Jaspersoft