IT/Technology Strategy
UK

The following table provides summary statistics for permanent job vacancies with a requirement for IT Strategy skills. Included is a benchmarking guide to the salaries offered in vacancies that have cited IT Strategy over the 6 months to 4 December 2023 with a comparison to the same period in the previous 2 years.

6 months to
4 Dec 2023
Same period 2022 Same period 2021
Rank 141 188 250
Rank change year-on-year +47 +62 -21
Permanent jobs citing IT Strategy 1,306 2,489 1,908
As % of all permanent jobs advertised in the UK 2.45% 2.01% 1.49%
As % of the Processes & Methodologies category 2.61% 2.10% 1.56%
Number of salaries quoted 743 1,399 1,360
10th Percentile £46,569 £46,250 £40,000
25th Percentile £58,750 £56,500 £50,000
Median annual salary (50th Percentile) £72,500 £75,000 £70,000
Median % change year-on-year -3.33% +7.14% +2.19%
75th Percentile £90,625 £95,916 £88,750
90th Percentile £115,000 £110,000 £110,000
UK excluding London median annual salary £65,351 £70,000 £60,000
% change year-on-year -6.64% +16.67% +4.35%

All Process and Methodology Skills
UK

IT Strategy is in the Processes and Methodologies category. The following table is for comparison with the above and provides summary statistics for all permanent job vacancies with a requirement for process or methodology skills.

Permanent vacancies with a requirement for process or methodology skills 50,088 118,671 122,416
As % of all permanent jobs advertised in the UK 94.09% 95.74% 95.45%
Number of salaries quoted 36,209 72,079 81,851
10th Percentile £32,500 £34,492 £32,500
25th Percentile £43,750 £45,000 £42,500
Median annual salary (50th Percentile) £60,000 £60,000 £60,000
Median % change year-on-year - - +9.09%
75th Percentile £80,000 £82,000 £77,500
90th Percentile £99,025 £100,000 £95,000
UK excluding London median annual salary £52,500 £53,219 £50,000
% change year-on-year -1.35% +6.44% +4.17%

IT Strategy
Job Vacancy Trend

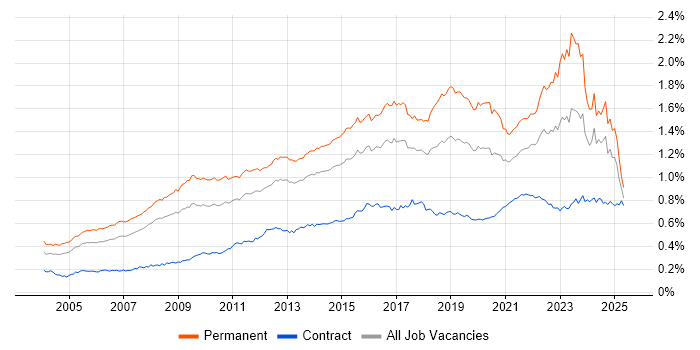
Job postings citing IT Strategy as a proportion of all IT jobs advertised.

Job vacancy trend for IT Strategy in the UK

IT Strategy
Salary Trend

3-month moving average salary quoted in jobs citing IT Strategy.

Salary trend for IT Strategy in the UK

IT Strategy
Salary Histogram

Salary distribution for jobs citing IT Strategy over the 6 months to 4 December 2023.

Salary histogram for IT Strategy in the UK

IT Strategy
Top 18 Job Locations

The table below looks at the demand and provides a guide to the median salaries quoted in IT jobs citing IT Strategy within the UK over the 6 months to 4 December 2023. The 'Rank Change' column provides an indication of the change in demand within each location based on the same 6 month period last year.

Location Rank Change
on Same Period
Last Year
Matching
Permanent
IT Job Ads
Median Salary
Past 6 Months
Median Salary
% Change
on Same Period
Last Year
Live
Jobs
England +36 1,058 £75,000 - 459
UK excluding London +26 806 £65,351 -6.64% 268
Work from Home +93 709 £75,000 +4.17% 160
London +70 412 £85,000 - 219
North of England +48 251 £67,500 +3.85% 88
South East +24 151 £70,000 -11.39% 68
Yorkshire +26 125 £69,038 +6.21% 41
Scotland +29 115 £56,318 -22.32% 9
North West +68 114 £66,757 +3.60% 42
Midlands +28 108 £71,250 +5.56% 36
South West -13 77 £64,500 -0.77% 25
East Midlands +41 64 £60,000 +9.09% 14
West Midlands +19 44 £73,750 +1.72% 21
Wales +27 42 £50,000 -4.76% 9
Northern Ireland +63 31 £85,000 +25.93% 12
East of England -10 31 £86,250 +7.81% 25
North East +26 12 £67,500 -21.74% 9
Channel Islands - 2 £85,000 -

IT Strategy
Co-occurring Skills and Capabilities by Category

The follow tables expand on the table above by listing co-occurrences grouped by category. The same employment type, locality and period is covered with up to 20 co-occurrences shown in each of the following categories:

Application Platforms
1 48 (3.68%) SharePoint
2 31 (2.37%) Apache Spark
3 13 (1.00%) Apache
3 13 (1.00%) SAS
4 8 (0.61%) Confluence
5 6 (0.46%) IIS
6 5 (0.38%) MS Exchange
7 3 (0.23%) CMS
7 3 (0.23%) Exchange Server 2003
7 3 (0.23%) Skype for Business
7 3 (0.23%) WebLogic
7 3 (0.23%) WebSphere
8 2 (0.15%) Drupal
8 2 (0.15%) JBoss
8 2 (0.15%) nginx
9 1 (0.077%) ArcGIS
9 1 (0.077%) Exchange Server 2007
9 1 (0.077%) Exchange Server 2010
9 1 (0.077%) Oracle SOA Suite
9 1 (0.077%) WordPress
Applications
1 14 (1.07%) Microsoft Excel
2 11 (0.84%) Microsoft Office
3 10 (0.77%) AutoCAD
3 10 (0.77%) Microsoft PowerPoint
4 6 (0.46%) Revit
5 5 (0.38%) Chatbot
5 5 (0.38%) MS Visio
6 4 (0.31%) Microsoft Project
7 1 (0.077%) SketchUp
Business Applications
1 22 (1.68%) Endur
2 11 (0.84%) Dynamics CRM
3 10 (0.77%) SAP S/4HANA
4 7 (0.54%) SAP ERP
5 4 (0.31%) Magento
5 4 (0.31%) SAP MM
6 3 (0.23%) Dynamics NAV
6 3 (0.23%) Primavera
6 3 (0.23%) ReMetrica
6 3 (0.23%) SAP CO
6 3 (0.23%) SAP FI
6 3 (0.23%) SAP FI/CO
6 3 (0.23%) Sparx Enterprise Architect
7 2 (0.15%) Distributed Ledger
7 2 (0.15%) SAP MDM
7 2 (0.15%) SAP WM
7 2 (0.15%) Temenos T24
8 1 (0.077%) Epicor Tropos
8 1 (0.077%) Oracle EBS
8 1 (0.077%) Sage X3
Cloud Services
1 334 (25.57%) Azure
2 169 (12.94%) AWS
3 130 (9.95%) Microsoft 365
4 113 (8.65%) GCP
5 96 (7.35%) Power Platform
6 89 (6.81%) PaaS
7 84 (6.43%) SaaS
8 67 (5.13%) IaaS
9 34 (2.60%) Dynamics 365
10 28 (2.14%) Azure DevOps
10 28 (2.14%) PowerApps
11 23 (1.76%) Entra ID
12 21 (1.61%) Serverless
13 19 (1.45%) WhatsApp
14 18 (1.38%) Cloud Computing
15 15 (1.15%) Azure Cosmos DB
16 13 (1.00%) AWS Lambda
17 12 (0.92%) Amazon EC2
17 12 (0.92%) Amazon S3
18 11 (0.84%) Amazon EMR
Communications & Networking
1 43 (3.29%) Firewall
2 32 (2.45%) LAN
3 31 (2.37%) DNS
3 31 (2.37%) WAN
4 30 (2.30%) VPN
5 26 (1.99%) DHCP
5 26 (1.99%) SAN
5 26 (1.99%) Wi-Fi
6 25 (1.91%) Network Security
7 16 (1.23%) VLAN
8 14 (1.07%) Wireless
9 13 (1.00%) TCP/IP
10 11 (0.84%) Internet
10 11 (0.84%) Unified Communications
11 7 (0.54%) MPLS
12 6 (0.46%) BGP
12 6 (0.46%) WLAN
13 5 (0.38%) Remote Desktop
13 5 (0.38%) SD-WAN
14 4 (0.31%) Cisco Wireless
Database & Business Intelligence
1 105 (8.04%) SQL Server
2 64 (4.90%) Data Lake
2 64 (4.90%) Data Warehouse
3 61 (4.67%) Power BI
4 54 (4.13%) NoSQL
5 40 (3.06%) Relational Database
6 28 (2.14%) RDBMS
7 19 (1.45%) Data Mining
8 18 (1.38%) Elasticsearch
8 18 (1.38%) Hadoop
9 17 (1.30%) Apache Ignite
10 15 (1.15%) MySQL
11 13 (1.00%) Azure SQL Database
11 13 (1.00%) PostgreSQL
12 11 (0.84%) DynamoDB
13 10 (0.77%) Metadata
14 9 (0.69%) SQL Server Integration Services
15 8 (0.61%) Big Data
15 8 (0.61%) DB2
16 7 (0.54%) SQL Server Reporting Services
Development Applications
1 40 (3.06%) Git
2 28 (2.14%) JIRA
3 22 (1.68%) Maven
4 20 (1.53%) Jenkins
5 16 (1.23%) JUnit
6 13 (1.00%) Cucumber
7 11 (0.84%) Atlassian Bamboo
7 11 (0.84%) Visual Studio
8 10 (0.77%) Bitbucket
9 7 (0.54%) Team Foundation Server
10 6 (0.46%) ERwin
11 4 (0.31%) Selenium
12 1 (0.077%) Artifactory
12 1 (0.077%) CircleCI
12 1 (0.077%) ER Studio
12 1 (0.077%) GitLab
12 1 (0.077%) PowerDesigner
12 1 (0.077%) SonarQube
12 1 (0.077%) Visual Studio Team System
General
1 531 (40.66%) Social Skills
2 357 (27.34%) Finance
3 208 (15.93%) Analytical Skills
4 138 (10.57%) Banking
5 103 (7.89%) Retail
6 80 (6.13%) Inclusion and Diversity
7 71 (5.44%) Manufacturing
8 60 (4.59%) Legal
9 51 (3.91%) Public Sector
10 49 (3.75%) Presentation Skills
11 44 (3.37%) Marketing
12 36 (2.76%) Law
13 35 (2.68%) Influencing Skills
14 30 (2.30%) Games
15 27 (2.07%) Financial Institution
16 24 (1.84%) Aerospace
17 19 (1.45%) Back Office
18 13 (1.00%) Publishing
19 12 (0.92%) Telecoms
20 11 (0.84%) Organisational Skills
Job Titles
1 594 (45.48%) Architect
2 407 (31.16%) Solutions Architect
3 240 (18.38%) Presales Solution Architect
4 155 (11.87%) Senior
5 82 (6.28%) Enterprise Architect
6 81 (6.20%) IT Manager
7 75 (5.74%) Developer
8 73 (5.59%) Analyst
9 61 (4.67%) Site Controller
10 57 (4.36%) Senior Architect
11 54 (4.13%) Lead
12 43 (3.29%) Head of IT
13 41 (3.14%) Commercial Architect
14 39 (2.99%) Security Architect
15 35 (2.68%) Senior Solutions Architect
16 34 (2.60%) Data Architect
17 33 (2.53%) IT Architect
18 32 (2.45%) Technical Architect
19 31 (2.37%) Payments Architect
19 31 (2.37%) Payments Solutions Architect
Libraries, Frameworks & Software Standards
1 83 (6.36%) .NET
2 74 (5.67%) Kafka
3 61 (4.67%) ModSecurity
4 60 (4.59%) OpenID
5 54 (4.13%) REST
6 44 (3.37%) React
6 44 (3.37%) Web Services
7 42 (3.22%) JWT
8 37 (2.83%) Spring
9 26 (1.99%) ASP.NET
10 25 (1.91%) Middleware
11 21 (1.61%) .NET Core
12 20 (1.53%) .NET Framework
13 18 (1.38%) OAuth
14 14 (1.07%) Node.js
15 11 (0.84%) CSS
15 11 (0.84%) Razor View Engine
16 10 (0.77%) EDI
16 10 (0.77%) Spring Boot
17 9 (0.69%) HTML
Miscellaneous
1 122 (9.34%) Management Information System
2 71 (5.44%) Public Cloud
3 63 (4.82%) Greenfield Project
4 55 (4.21%) Blockchain
5 45 (3.45%) Mainframe
6 42 (3.22%) Product Ownership
7 28 (2.14%) Data Centre
7 28 (2.14%) Hybrid Cloud
8 24 (1.84%) Private Cloud
9 22 (1.68%) Swaptions
10 16 (1.23%) Cloud Native
10 16 (1.23%) Self-Motivation
10 16 (1.23%) Virtual Team
11 15 (1.15%) Credit Risk
12 12 (0.92%) Enterprise Software
13 11 (0.84%) Culture of Ownership
13 11 (0.84%) IoT
13 11 (0.84%) Onboarding
14 10 (0.77%) Legacy Systems
15 9 (0.69%) Video Conferencing
Operating Systems
1 128 (9.80%) Windows
2 57 (4.36%) Unix
3 52 (3.98%) Windows Server
4 25 (1.91%) Linux
5 17 (1.30%) Windows 10
6 9 (0.69%) Windows Server 2016
7 8 (0.61%) Android
7 8 (0.61%) Windows Server 2012
8 6 (0.46%) Mac OS
8 6 (0.46%) Windows Server 2019
9 5 (0.38%) Apple iOS
10 3 (0.23%) Windows 2000 Server
11 2 (0.15%) Windows 7
11 2 (0.15%) Windows Server 2008
12 1 (0.077%) HPUX
12 1 (0.077%) Mac OS X
12 1 (0.077%) Red Hat Enterprise Linux
12 1 (0.077%) Ubuntu
12 1 (0.077%) VMS
12 1 (0.077%) Windows Server 2003
Processes & Methodologies
1 737 (56.43%) Technology Strategy
2 387 (29.63%) Agile
2 387 (29.63%) Problem-Solving
3 366 (28.02%) Actionable Insight
4 358 (27.41%) Roadmaps
5 331 (25.34%) Analytics
6 303 (23.20%) Thought Leadership
7 295 (22.59%) Business Case
8 266 (20.37%) Data Analytics
9 262 (20.06%) Commercial Awareness
10 261 (19.98%) Digital Transformation Programme
11 260 (19.91%) Contract Negotiation
12 244 (18.68%) Presales
13 189 (14.47%) Business Strategy
14 162 (12.40%) Cybersecurity
15 149 (11.41%) Strategic Roadmap
16 140 (10.72%) Stakeholder Management
17 129 (9.88%) Enterprise Architecture
18 127 (9.72%) Microservices
18 127 (9.72%) Project Management
Programming Languages
1 109 (8.35%) C#
2 104 (7.96%) Java
3 84 (6.43%) SQL
4 65 (4.98%) Python
5 34 (2.60%) VB
6 29 (2.22%) JavaScript
7 21 (1.61%) PowerShell
8 20 (1.53%) VB.NET
9 17 (1.30%) T-SQL
10 15 (1.15%) R
11 13 (1.00%) PL/SQL
12 10 (0.77%) Bicep
13 6 (0.46%) Go
13 6 (0.46%) TypeScript
14 4 (0.31%) COBOL
14 4 (0.31%) Data Analysis Expressions
15 3 (0.23%) JCL
15 3 (0.23%) Micro Focus COBOL
16 2 (0.15%) Bash
16 2 (0.15%) PHP
Qualifications
1 374 (28.64%) Security Cleared
2 308 (23.58%) SC Cleared
3 215 (16.46%) Degree
4 85 (6.51%) CISSP
5 68 (5.21%) CISM
6 61 (4.67%) CISA
6 61 (4.67%) CRISC
7 27 (2.07%) Computer Science Degree
7 27 (2.07%) TOGAF Certification
8 23 (1.76%) Master's Degree
9 20 (1.53%) Azure Certification
10 17 (1.30%) CISMP
10 17 (1.30%) Microsoft Certification
11 16 (1.23%) DV Cleared
12 15 (1.15%) ISSAP
12 15 (1.15%) PMI Certification
13 12 (0.92%) MBA
14 9 (0.69%) Cisco Certification
14 9 (0.69%) PMP
15 7 (0.54%) MCSA
Quality Assurance & Compliance
1 78 (5.97%) GRC
2 75 (5.74%) ISO/IEC 27001
3 65 (4.98%) NIST
4 64 (4.90%) ISO 22301
5 50 (3.83%) QA
6 22 (1.68%) GDPR
7 17 (1.30%) Data Quality
7 17 (1.30%) SLA
8 15 (1.15%) PMO
9 13 (1.00%) Accessibility
9 13 (1.00%) CRD IV
9 13 (1.00%) IFRS
9 13 (1.00%) IFRS 9
10 10 (0.77%) Cyber Essentials
11 8 (0.61%) COBIT
12 5 (0.38%) NCSC
13 4 (0.31%) Sarbanes-Oxley
14 3 (0.23%) Cyber Essentials PLUS
15 1 (0.077%) HL7
15 1 (0.077%) P3O
System Software
1 77 (5.90%) Active Directory
2 18 (1.38%) VMware Infrastructure
3 14 (1.07%) Docker
4 13 (1.00%) Hyper-V
5 4 (0.31%) DFS Replication
5 4 (0.31%) Virtual Desktop
6 3 (0.23%) Forefront TMG
6 3 (0.23%) ISA Server
6 3 (0.23%) Time Sharing Option
7 2 (0.15%) Virtual Machines
8 1 (0.077%) Firmware
8 1 (0.077%) Terminal Server
8 1 (0.077%) VMware ESXi
8 1 (0.077%) vSphere
Systems Management
1 67 (5.13%) Kubernetes
2 22 (1.68%) Microsoft Intune
3 17 (1.30%) Ansible
3 17 (1.30%) Terraform
4 13 (1.00%) SCCM
5 6 (0.46%) Puppet
5 6 (0.46%) WebSphere Cast Iron
6 5 (0.38%) Active Directory Federation Services
7 4 (0.31%) NetBackup
7 4 (0.31%) SysTrack
7 4 (0.31%) vRealize Orchestrator
8 3 (0.23%) Oracle RMAN
9 2 (0.15%) Oracle Identity Management
9 2 (0.15%) Single Sign-On
10 1 (0.077%) Argo
10 1 (0.077%) Demisto
10 1 (0.077%) Grafana
10 1 (0.077%) HP Fortify
10 1 (0.077%) Packer
10 1 (0.077%) PaperCut
Vendors
1 236 (18.07%) Microsoft
2 65 (4.98%) CA
3 61 (4.67%) Oracle
4 48 (3.68%) VMware
5 36 (2.76%) Cisco
5 36 (2.76%) SAP
6 33 (2.53%) Google
7 22 (1.68%) OpenLink
7 22 (1.68%) Sybase
7 22 (1.68%) TIBCO
8 16 (1.23%) Atlassian
8 16 (1.23%) Databricks
9 13 (1.00%) Palo Alto
10 12 (0.92%) Citrix
11 10 (0.77%) Aruba
12 9 (0.69%) Apple
13 8 (0.61%) Blue Prism
13 8 (0.61%) Sitecore
14 7 (0.54%) AppDynamics
14 7 (0.54%) Dynatrace