Middleware Jobs in the UK excluding London

Middleware
UK > UK excluding London

The table below provides summary statistics for permanent job vacancies advertised in the UK excluding London requiring Middleware skills. It includes a benchmarking guide to the annual salaries offered in vacancies that cited Middleware over the 6 months leading up to 17 May 2025, comparing them to the same period in the previous two years.

6 months to
17 May 2025
Same period 2024 Same period 2023
Rank 309 546 372
Rank change year-on-year +237 -174 +38
Permanent jobs citing Middleware 310 214 472
As % of all permanent jobs advertised in the UK excluding London 0.78% 0.30% 0.80%
As % of the Libraries, Frameworks & Software Standards category 5.68% 1.50% 2.91%
Number of salaries quoted 169 149 180
10th Percentile £37,574 £40,000 £42,155
25th Percentile £47,500 £46,750 £56,219
Median annual salary (50th Percentile) £62,500 £57,500 £61,375
Median % change year-on-year +8.70% -6.31% +11.59%
75th Percentile £73,000 £67,500 £77,500
90th Percentile £73,886 £88,750 £90,225
UK median annual salary £66,367 £65,000 £65,000
% change year-on-year +2.10% - +4.00%

All Software Libraries and Frameworks
UK excluding London

Middleware falls under the Software Libraries and Frameworks category. For comparison with the information above, the following table provides summary statistics for all permanent job vacancies requiring technical specification, industry standards, software libraries and framework skills in the UK excluding London.

Permanent vacancies with a requirement for technical specification, industry standards, software libraries and framework skills 5,457 14,306 16,245
As % of all permanent jobs advertised in the UK excluding London 13.75% 20.04% 27.41%
Number of salaries quoted 3,515 10,304 8,960
10th Percentile £32,500 £33,750 £36,250
25th Percentile £45,000 £42,500 £45,000
Median annual salary (50th Percentile) £60,000 £55,000 £57,500
Median % change year-on-year +9.09% -4.35% +4.55%
75th Percentile £73,750 £68,750 £72,500
90th Percentile £87,500 £80,000 £86,250
UK median annual salary £65,000 £60,000 £67,500
% change year-on-year +8.33% -11.11% +5.88%

Middleware
Job Vacancy Trend in the UK excluding London

Job postings citing Middleware as a proportion of all IT jobs advertised in the UK excluding London.
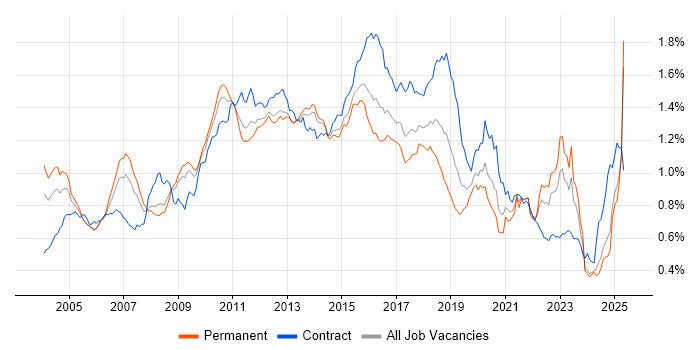
Job vacancy trend for Middleware in the UK excluding London

Middleware
Salary Trend in the UK excluding London

3-month moving average salary quoted in jobs citing Middleware in the UK excluding London.

Salary trend for Middleware in the UK excluding London

Middleware
Salary Histogram in the UK excluding London

Salary distribution for jobs citing Middleware in the UK excluding London over the 6 months to 17 May 2025.

Salary histogram for Middleware in the UK excluding London

Middleware
Job Locations in the UK excluding London

The table below looks at the demand and provides a guide to the median salaries quoted in IT jobs citing Middleware within the UK excluding London region over the 6 months to 17 May 2025. The 'Rank Change' column provides an indication of the change in demand within each location based on the same 6 month period last year.

Location Rank Change
on Same Period
Last Year
Matching
Permanent
IT Job Ads
Median Salary
Past 6 Months
Median Salary
% Change
on Same Period
Last Year
Live
Jobs
South East +134 114 £73,000 +46.00% 56
Midlands +88 52 £55,000 -8.33% 31
North of England +62 50 £65,000 +8.33% 29
West Midlands +73 42 £53,750 -10.42% 13
East of England +64 39 £55,000 -15.38% 17
North West +21 34 £66,367 +1.32% 18
Scotland +98 24 £57,500 -12.55% 7
South West +98 18 £48,918 -18.47% 25
Yorkshire +60 15 £47,500 -19.15% 9
East Midlands - 10 £55,000 - 17
Wales +47 7 £73,000 +8.15% 1
Northern Ireland - 6 £50,000 - 1
North East +41 1 - - 2
Middleware
UK

Middleware
Co-occurring Skills and Capabilities in the UK excluding London by Category

The follow tables expand on the table above by listing co-occurrences grouped by category. The same employment type, locality and period is covered with up to 20 co-occurrences shown in each of the following categories:

Application Platforms
1 30 (9.68%) Apache
2 10 (3.23%) Kinematics
3 4 (1.29%) Confluence
3 4 (1.29%) GemFire
3 4 (1.29%) nginx
4 3 (0.97%) Oracle SOA Suite
4 3 (0.97%) Tomcat
5 2 (0.65%) Oracle Service Bus
5 2 (0.65%) WebLogic
5 2 (0.65%) WebSphere
5 2 (0.65%) WebSphere Application Server
6 1 (0.32%) Adobe Experience Manager
6 1 (0.32%) Apache Spark
6 1 (0.32%) BizTalk Server
6 1 (0.32%) CMS
6 1 (0.32%) Headless CMS
6 1 (0.32%) IIS
6 1 (0.32%) Oracle HTTP Server
6 1 (0.32%) Oracle Workflow
6 1 (0.32%) SharePoint Server
Applications
1 4 (1.29%) Microsoft Excel
2 2 (0.65%) Microsoft Office
2 2 (0.65%) Microsoft PowerPoint
Business Applications
1 22 (7.10%) Oracle EBS
2 15 (4.84%) Oracle Applications
3 7 (2.26%) SAP S/4HANA
4 4 (1.29%) SAP HCM
5 2 (0.65%) Oracle BPM
6 1 (0.32%) Dynamics AX
6 1 (0.32%) Magento
6 1 (0.32%) Oracle Financials
6 1 (0.32%) SAP EWM
6 1 (0.32%) SAP WM
6 1 (0.32%) Sprinklr
Cloud Services
1 36 (11.61%) Azure
2 27 (8.71%) AWS
3 21 (6.77%) Salesforce Sales Cloud
4 16 (5.16%) GCP
5 15 (4.84%) GitHub
6 11 (3.55%) PaaS
7 10 (3.23%) Azure API Management
7 10 (3.23%) IaaS
8 9 (2.90%) Azure Synapse Analytics
9 6 (1.94%) Serverless
10 4 (1.29%) AWS Lambda
10 4 (1.29%) Azure DevOps
10 4 (1.29%) Boomi
11 3 (0.97%) Amazon S3
11 3 (0.97%) Azure Functions
11 3 (0.97%) SaaS
12 2 (0.65%) Azure Data Factory
12 2 (0.65%) Azure Logic Apps
12 2 (0.65%) Azure Service Bus
12 2 (0.65%) Dynamics 365
Communications & Networking
1 67 (21.61%) Broadband
2 8 (2.58%) NAS
2 8 (2.58%) SAN
3 5 (1.61%) DHCP
3 5 (1.61%) DNS
3 5 (1.61%) Firewall
3 5 (1.61%) LAN
3 5 (1.61%) VSAN
3 5 (1.61%) WAN
4 3 (0.97%) Internet
4 3 (0.97%) SSL
4 3 (0.97%) Wireless
5 2 (0.65%) Cisco Nexus
5 2 (0.65%) FCoE
5 2 (0.65%) Fibre Channel
5 2 (0.65%) HTTP
5 2 (0.65%) iSCSI
5 2 (0.65%) Multicast
5 2 (0.65%) VPN
6 1 (0.32%) Network Security
Database & Business Intelligence
1 19 (6.13%) PostgreSQL
1 19 (6.13%) SQL Server
2 13 (4.19%) MongoDB
3 11 (3.55%) Oracle Database
4 9 (2.90%) NoSQL
5 8 (2.58%) Redis
6 7 (2.26%) MySQL
7 6 (1.94%) Oracle Exadata
8 5 (1.61%) DB2
9 4 (1.29%) Apache Ignite
9 4 (1.29%) InterSystems Cache
9 4 (1.29%) RDBMS
9 4 (1.29%) Relational Database
10 2 (0.65%) Apache Cassandra
10 2 (0.65%) Azure SQL Database
10 2 (0.65%) Couchbase
10 2 (0.65%) KDB
10 2 (0.65%) Oracle Database 11g
10 2 (0.65%) Oracle Database 12c
10 2 (0.65%) Oracle ODI
Development Applications
1 76 (24.52%) JIRA
2 25 (8.06%) Eclipse
2 25 (8.06%) Eclipse RCP
3 11 (3.55%) Git
4 6 (1.94%) Jenkins
5 5 (1.61%) GitLab
5 5 (1.61%) Oracle Forms
6 2 (0.65%) JDeveloper
6 2 (0.65%) Mocha
6 2 (0.65%) Octopus Deploy
6 2 (0.65%) Sonatype Nexus
6 2 (0.65%) Spock
6 2 (0.65%) TeamCity
6 2 (0.65%) Visual Studio
7 1 (0.32%) JUnit
7 1 (0.32%) Selenium
General
1 62 (20.00%) Social Skills
2 32 (10.32%) Law
3 27 (8.71%) Finance
4 25 (8.06%) Inclusion and Diversity
4 25 (8.06%) Marketing
5 22 (7.10%) Analytical Skills
6 12 (3.87%) Banking
7 11 (3.55%) Electronics
8 10 (3.23%) Public Sector
9 9 (2.90%) Manufacturing
10 5 (1.61%) Police
11 4 (1.29%) Retail
12 3 (0.97%) Aerospace
12 3 (0.97%) Front Office
13 2 (0.65%) Advertising
13 2 (0.65%) Documentation Skills
13 2 (0.65%) Financial Institution
13 2 (0.65%) Local Government
13 2 (0.65%) Military
13 2 (0.65%) Telecoms
Job Titles
1 71 (22.90%) Architect
2 65 (20.97%) Embedded Engineer
2 65 (20.97%) Release Engineer
3 42 (13.55%) Software Architect
3 42 (13.55%) Software Engineer
4 36 (11.61%) Developer
5 24 (7.74%) Senior
6 23 (7.42%) Junior
7 22 (7.10%) Junior Software Engineer
8 21 (6.77%) Enterprise Architect
8 21 (6.77%) Salesforce Architect
9 18 (5.81%) Lead
10 13 (4.19%) Analyst
11 11 (3.55%) Applications Support
11 11 (3.55%) Support Engineer
12 10 (3.23%) Full-Stack Engineer
12 10 (3.23%) Full-Stack Software Engineer
12 10 (3.23%) Java Developer
12 10 (3.23%) Java Engineer
12 10 (3.23%) Robotics Engineer
Libraries, Frameworks & Software Standards
1 34 (10.97%) REST
2 28 (9.03%) CSS
2 28 (9.03%) HTML
2 28 (9.03%) SOAP
3 25 (8.06%) JSP
4 21 (6.77%) Lightning Web Components
4 21 (6.77%) Oracle Fusion
5 18 (5.81%) .NET
6 13 (4.19%) Node.js
7 7 (2.26%) Kafka
7 7 (2.26%) React
7 7 (2.26%) Spring
7 7 (2.26%) Svelte
8 6 (1.94%) Oracle GoldenGate
8 6 (1.94%) RabbitMQ
9 5 (1.61%) GWT
9 5 (1.61%) J2EE
9 5 (1.61%) JPA
9 5 (1.61%) OAuth
9 5 (1.61%) Vaadin
Miscellaneous
1 65 (20.97%) Embedded Systems
2 26 (8.39%) Enterprise Software
3 18 (5.81%) Algorithms
4 16 (5.16%) Robotics
5 9 (2.90%) Hybrid Cloud
5 9 (2.90%) Public Cloud
6 8 (2.58%) Data Structures
7 7 (2.26%) Data Protection Act
7 7 (2.26%) Mobile App
8 6 (1.94%) Cyber Threat
9 5 (1.61%) Clustering
9 5 (1.61%) Foreign Exchange (FX)
9 5 (1.61%) SCADA
10 4 (1.29%) Derivative
11 3 (0.97%) Credit Derivative
11 3 (0.97%) Data Centre
11 3 (0.97%) Equities
11 3 (0.97%) Fixed Income
11 3 (0.97%) Private Cloud
11 3 (0.97%) Replication
Operating Systems
1 59 (19.03%) Linux
2 41 (13.23%) Windows
3 12 (3.87%) Unix
4 5 (1.61%) Robot Operating System
4 5 (1.61%) Rocky
5 4 (1.29%) Solaris
6 3 (0.97%) Red Hat Enterprise Linux
7 2 (0.65%) Windows Server
7 2 (0.65%) zOS
8 1 (0.32%) Ubuntu
Processes & Methodologies
1 169 (54.52%) Agile
2 133 (42.90%) CI/CD
3 88 (28.39%) DevOps
4 87 (28.06%) Software Delivery
5 79 (25.48%) SDLC
6 78 (25.16%) Mentoring
7 75 (24.19%) Roadmaps
8 73 (23.55%) Continuous Deployment
9 72 (23.23%) Continuous Improvement
10 68 (21.94%) Design Patterns
11 67 (21.61%) UML
12 66 (21.29%) Artificial Intelligence
12 66 (21.29%) Computer Science
12 66 (21.29%) Strategic Thinking
13 65 (20.97%) Release Automation
14 54 (17.42%) Software Engineering
15 52 (16.77%) Configuration Management
16 47 (15.16%) OO
17 43 (13.87%) Open Source
17 43 (13.87%) Problem-Solving
Programming Languages
1 77 (24.84%) SQL
2 59 (19.03%) Java
3 51 (16.45%) C#
4 50 (16.13%) Python
5 23 (7.42%) JavaScript
6 22 (7.10%) Ada
6 22 (7.10%) C++
6 22 (7.10%) Rust
7 21 (6.77%) Apex Code
8 14 (4.52%) C
9 9 (2.90%) PL/SQL
10 8 (2.58%) TypeScript
11 7 (2.26%) Shell Script
12 3 (0.97%) PowerShell
13 2 (0.65%) Bash
13 2 (0.65%) Groovy
13 2 (0.65%) T-SQL
13 2 (0.65%) VB
14 1 (0.32%) COBOL
14 1 (0.32%) PHP
Qualifications
1 108 (34.84%) Degree
2 67 (21.61%) BPSS Clearance
3 64 (20.65%) Computer Science Degree
4 42 (13.55%) Chartered Engineer
5 26 (8.39%) Master's Degree
6 15 (4.84%) Security Cleared
7 7 (2.26%) Azure Certification
7 7 (2.26%) Microsoft Certification
8 6 (1.94%) DV Cleared
9 5 (1.61%) OCA
9 5 (1.61%) OCP
9 5 (1.61%) Oracle Certification
9 5 (1.61%) VMware Certified Professional (VCP)
10 4 (1.29%) SC Cleared
11 2 (0.65%) ISTQB
12 1 (0.32%) AWS Certification
12 1 (0.32%) CISA
12 1 (0.32%) CISSP
12 1 (0.32%) ISTQB Foundation Certification
12 1 (0.32%) PMI Certification
Quality Assurance & Compliance
1 42 (13.55%) ISO/IEC 12207
2 23 (7.42%) Data Quality
3 8 (2.58%) Accessibility
4 2 (0.65%) Sarbanes-Oxley
5 1 (0.32%) Cyber Essentials
5 1 (0.32%) ISO/IEC 27001
5 1 (0.32%) NCSC
5 1 (0.32%) NIST
5 1 (0.32%) QA
System Software
1 18 (5.81%) Docker
2 5 (1.61%) VMware NSX
3 4 (1.29%) Active Directory
4 3 (0.97%) VMware Infrastructure
5 2 (0.65%) Hyper-V
5 2 (0.65%) KVM
5 2 (0.65%) NFS
5 2 (0.65%) SRDF
5 2 (0.65%) Veritas Cluster Server
5 2 (0.65%) Xen
Systems Management
1 12 (3.87%) Kubernetes
2 8 (2.58%) Terraform
3 6 (1.94%) Oracle RMAN
4 5 (1.61%) HP ALM
4 5 (1.61%) Progress Chef
5 4 (1.29%) HAProxy
5 4 (1.29%) Prometheus
6 3 (0.97%) Ansible
6 3 (0.97%) Grafana
7 2 (0.65%) Control-M
7 2 (0.65%) Microsoft Intune
7 2 (0.65%) Puppet
8 1 (0.32%) Failover Clustering
8 1 (0.32%) Kibana
Vendors
1 49 (15.81%) Oracle
2 29 (9.35%) Microsoft
3 22 (7.10%) Salesforce
4 21 (6.77%) Salesforce Marketing Cloud
5 15 (4.84%) SAP
5 15 (4.84%) ServiceNow
6 10 (3.23%) VMware
7 9 (2.90%) Databricks
8 7 (2.26%) Google
8 7 (2.26%) IBM
8 7 (2.26%) Red Hat
9 6 (1.94%) Solace
9 6 (1.94%) TIBCO
10 5 (1.61%) HP
10 5 (1.61%) MuleSoft
11 4 (1.29%) Dell
11 4 (1.29%) DocuSign
11 4 (1.29%) NetApp
12 2 (0.65%) Bloomberg
12 2 (0.65%) Citrix