Requirements Gathering Workshops
UK

The following table provides summary statistics for permanent job vacancies with a requirement for Requirements Workshops skills. Included is a benchmarking guide to the salaries offered in vacancies that have cited Requirements Workshops over the 6 months to 11 May 2024 with a comparison to the same period in the previous 2 years.

6 months to
11 May 2024
Same period 2023 Same period 2022
Rank 726 717 792
Rank change year-on-year -9 +75 -95
Permanent jobs citing Requirements Workshops 168 270 470
As % of all permanent jobs advertised in the UK 0.17% 0.27% 0.30%
As % of the Processes & Methodologies category 0.20% 0.28% 0.31%
Number of salaries quoted 115 209 252
10th Percentile £41,250 £44,337 £41,250
25th Percentile £47,250 £51,250 £45,000
Median annual salary (50th Percentile) £55,000 £62,000 £54,250
Median % change year-on-year -11.29% +14.29% -1.36%
75th Percentile £76,250 £77,500 £67,500
90th Percentile £92,500 £85,500 £78,750
UK excluding London median annual salary £50,000 £60,000 £47,500
% change year-on-year -16.67% +26.32% -

All Process and Methodology Skills
UK

Requirements Workshops is in the Processes and Methodologies category. The following table is for comparison with the above and provides summary statistics for all permanent job vacancies with a requirement for process or methodology skills.

Permanent vacancies with a requirement for process or methodology skills 84,921 96,445 150,777
As % of all permanent jobs advertised in the UK 85.57% 95.59% 95.69%
Number of salaries quoted 59,902 56,808 82,456
10th Percentile £29,010 £34,000 £33,645
25th Percentile £40,000 £45,000 £43,750
Median annual salary (50th Percentile) £55,000 £61,000 £60,000
Median % change year-on-year -9.84% +1.67% +9.09%
75th Percentile £72,500 £81,250 £80,000
90th Percentile £92,500 £100,000 £96,250
UK excluding London median annual salary £50,000 £55,000 £52,500
% change year-on-year -9.09% +4.76% +10.53%

Requirements Workshops
Job Vacancy Trend

Job postings citing Requirements Workshops as a proportion of all IT jobs advertised.
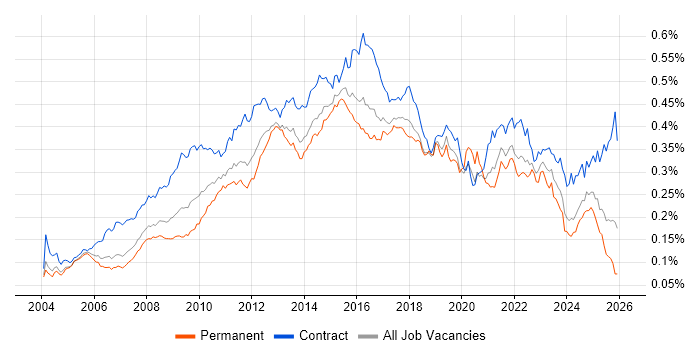
Job vacancy trend for Requirements Workshops in the UK

Requirements Workshops
Salary Trend

3-month moving average salary quoted in jobs citing Requirements Workshops.

Salary trend for Requirements Workshops in the UK

Requirements Workshops
Salary Histogram

Salary distribution for jobs citing Requirements Workshops over the 6 months to 11 May 2024.

Salary histogram for Requirements Workshops in the UK

Requirements Workshops
Top 17 Job Locations

The table below looks at the demand and provides a guide to the median salaries quoted in IT jobs citing Requirements Workshops within the UK over the 6 months to 11 May 2024. The 'Rank Change' column provides an indication of the change in demand within each location based on the same 6 month period last year.

Location Rank Change
on Same Period
Last Year
Matching
Permanent
IT Job Ads
Median Salary
Past 6 Months
Median Salary
% Change
on Same Period
Last Year
Live
Jobs
England -2 142 £55,000 -11.29% 32
UK excluding London +6 125 £50,000 -16.67% 17
Work from Home +31 61 £62,500 +8.70% 13
London +64 35 £72,500 +16.94% 15
North of England +31 33 £47,500 -38.71% 3
South West -15 25 £87,500 +102.31% 3
North West +6 24 £52,500 -32.26% 1
South East -9 20 £62,500 +4.17% 3
East of England +31 19 £50,000 -47.37%
Midlands -16 10 £65,000 +1.96% 5
Scotland -52 9 £40,000 -15.79% 2
West Midlands +5 8 £65,000 - 5
Yorkshire +80 7 £43,461 +8.65% 1
Wales +9 6 £32,500 -23.53%
Northern Ireland - 3 £50,000 - 1
North East -11 2 £45,000 -18.18% 1
East Midlands -21 2 - -

Requirements Workshops
Co-occurring Skills and Capabilities by Category

The follow tables expand on the table above by listing co-occurrences grouped by category. The same employment type, locality and period is covered with up to 20 co-occurrences shown in each of the following categories:

Application Platforms
1 26 (15.48%) Confluence
2 8 (4.76%) SharePoint
3 4 (2.38%) Microsoft Exchange
4 2 (1.19%) Oracle Workflow
5 1 (0.60%) CMS
Applications
1 27 (16.07%) MS Visio
2 25 (14.88%) Microsoft Office
3 8 (4.76%) Microsoft Excel
4 1 (0.60%) Chatbot
Business Applications
1 3 (1.79%) SAP S/4HANA
1 3 (1.79%) SAP SD
2 1 (0.60%) Dynamics CRM
2 1 (0.60%) Magento
2 1 (0.60%) Maximo
2 1 (0.60%) SAP Forecasting and Replenishment
2 1 (0.60%) SAP Retail
2 1 (0.60%) Shopify
2 1 (0.60%) Summit
Cloud Services
1 31 (18.45%) Power Platform
2 27 (16.07%) Azure
3 23 (13.69%) Miro
4 15 (8.93%) Azure DevOps
5 12 (7.14%) Power Automate
6 9 (5.36%) SaaS
7 7 (4.17%) PowerApps
8 4 (2.38%) Dynamics 365
8 4 (2.38%) Microsoft 365
9 3 (1.79%) Azure Logic Apps
9 3 (1.79%) npm
10 2 (1.19%) Azure Cosmos DB
10 2 (1.19%) Azure Data Factory
10 2 (1.19%) NuGet
11 1 (0.60%) Figma
11 1 (0.60%) IaaS
11 1 (0.60%) Microsoft Purview
11 1 (0.60%) OCI
11 1 (0.60%) PaaS
11 1 (0.60%) Salesforce Einstein
Communications & Networking
1 1 (0.60%) HTTP
Database & Business Intelligence
1 19 (11.31%) Power BI
2 18 (10.71%) Data Warehouse
3 5 (2.98%) Data Lake
3 5 (2.98%) SQL Server
3 5 (2.98%) Tableau
4 4 (2.38%) Relational Database
5 1 (0.60%) Geospatial Data
5 1 (0.60%) Power Query
Development Applications
1 28 (16.67%) JIRA
2 2 (1.19%) Git
2 2 (1.19%) Jenkins
2 2 (1.19%) Octopus Deploy
3 1 (0.60%) Cypress.io
3 1 (0.60%) Protractor
3 1 (0.60%) Team Foundation Server
General
1 61 (36.31%) Finance
2 46 (27.38%) Social Skills
3 18 (10.71%) Influencing Skills
4 17 (10.12%) Marketing
5 16 (9.52%) Retail
6 14 (8.33%) Analytical Skills
7 12 (7.14%) Public Sector
8 7 (4.17%) Presentation Skills
9 5 (2.98%) General Ledger
10 3 (1.79%) Law
10 3 (1.79%) Organisational Skills
10 3 (1.79%) Publishing
11 2 (1.19%) Electronics
11 2 (1.19%) Inclusion and Diversity
11 2 (1.19%) Legal
11 2 (1.19%) Manufacturing
11 2 (1.19%) Telecoms
12 1 (0.60%) Automotive
12 1 (0.60%) Aviation
Job Titles
1 80 (47.62%) Analyst
2 75 (44.64%) Business Analyst
3 55 (32.74%) Senior
4 41 (24.40%) Consultant
5 28 (16.67%) Senior Analyst
5 28 (16.67%) Senior Business Analyst
6 20 (11.90%) Senior Consultant
6 20 (11.90%) Technical Consultant
7 19 (11.31%) Architect
8 18 (10.71%) Lead
9 17 (10.12%) Senior ServiceNow Consultant
9 17 (10.12%) Senior Technical Consultant
9 17 (10.12%) ServiceNow Consultant
9 17 (10.12%) Solutions Architect
10 13 (7.74%) Lead Consultant
11 12 (7.14%) Automation Consultant
11 12 (7.14%) Project Manager
12 8 (4.76%) Delivery Project Manager
12 8 (4.76%) Software Delivery Project Manager
12 8 (4.76%) Software Project Manager
Libraries, Frameworks & Software Standards
1 18 (10.71%) AngularJS
1 18 (10.71%) HTML
2 12 (7.14%) REST
3 2 (1.19%) .NET
4 1 (0.60%) CSS
4 1 (0.60%) Jest
4 1 (0.60%) Lightning Web Components
Miscellaneous
1 22 (13.10%) Management Information System
2 7 (4.17%) Low-Code
2 7 (4.17%) Product Ownership
3 6 (3.57%) Mobile App
4 3 (1.79%) Data Structures
4 3 (1.79%) FMCG
4 3 (1.79%) Housing Association
4 3 (1.79%) PMI
5 2 (1.19%) Cloud Native
6 1 (0.60%) Enterprise Software
6 1 (0.60%) Virtual Team
Processes & Methodologies
1 74 (44.05%) Requirements Gathering
2 72 (42.86%) Agile
3 49 (29.17%) Business Analysis
4 39 (23.21%) Stakeholder Management
5 32 (19.05%) Workshop Facilitation
6 31 (18.45%) Acceptance Criteria
6 31 (18.45%) Process Improvement
7 30 (17.86%) Epics
8 29 (17.26%) Project Management
9 28 (16.67%) Project Delivery
9 28 (16.67%) Scrum
10 27 (16.07%) Backlog Refinement
11 25 (14.88%) UML
11 25 (14.88%) User Research
12 24 (14.29%) Knowledge Transfer
13 23 (13.69%) Actionable Insight
13 23 (13.69%) Business Process Modelling
13 23 (13.69%) Stakeholder and Relationship Management
13 23 (13.69%) User-Centered Design (UCD)
14 21 (12.50%) Mentoring
Programming Languages
1 18 (10.71%) JavaScript
2 17 (10.12%) SQL
3 2 (1.19%) T-SQL
4 1 (0.60%) Data Analysis Expressions
4 1 (0.60%) Python
4 1 (0.60%) TypeScript
4 1 (0.60%) VBA
Qualifications
1 41 (24.40%) Degree
2 29 (17.26%) Security Cleared
3 23 (13.69%) SC Cleared
4 9 (5.36%) DBS Check
5 3 (1.79%) PMI Certification
6 2 (1.19%) CBAP
6 2 (1.19%) IIBA
6 2 (1.19%) PMP
7 1 (0.60%) Microsoft Certification
Quality Assurance & Compliance
1 2 (1.19%) QA
System Software
1 2 (1.19%) Docker
Systems Management
1 2 (1.19%) Kubernetes
1 2 (1.19%) Terraform
Vendors
1 47 (27.98%) Microsoft
2 18 (10.71%) ServiceNow
3 9 (5.36%) Salesforce
4 8 (4.76%) SAP
5 7 (4.17%) Oracle
6 3 (1.79%) Freshdesk