E-Commerce Jobs

E-Commerce (Electronic Commerce)
UK

The table below provides summary statistics for permanent job vacancies requiring E-Commerce skills. It includes a benchmarking guide to the annual salaries offered in vacancies that cited E-Commerce over the 6 months leading up to 31 May 2025, comparing them to the same period in the previous two years.

6 months to
31 May 2025
Same period 2024 Same period 2023
Rank 210 166 166
Rank change year-on-year -44 0 -51
Permanent jobs citing E-Commerce 850 1,757 2,151
As % of all permanent jobs advertised in the UK 1.52% 1.69% 2.25%
As % of the Processes & Methodologies category 1.63% 2.02% 2.35%
Number of salaries quoted 599 1,470 1,450
10th Percentile £31,250 £30,000 £39,166
25th Percentile £35,000 £36,250 £50,000
Median annual salary (50th Percentile) £52,500 £50,000 £65,000
Median % change year-on-year +5.00% -23.08% +8.33%
75th Percentile £70,000 £70,000 £80,000
90th Percentile £87,500 £87,500 £91,250
UK excluding London median annual salary £47,500 £45,000 £57,500
% change year-on-year +5.56% -21.74% +15.00%

All Process and Methodology Skills
UK

E-Commerce falls under the Processes and Methodologies category. For comparison with the information above, the following table provides summary statistics for all permanent job vacancies requiring process or methodology skills.

Permanent vacancies with a requirement for process or methodology skills 52,256 87,133 91,481
As % of all permanent jobs advertised in the UK 93.58% 84.04% 95.51%
Number of salaries quoted 25,854 60,896 54,581
10th Percentile £28,822 £29,250 £34,000
25th Percentile £41,250 £40,000 £45,000
Median annual salary (50th Percentile) £57,000 £55,000 £60,899
Median % change year-on-year +3.64% -9.69% +1.50%
75th Percentile £75,000 £72,500 £81,250
90th Percentile £97,500 £92,500 £100,000
UK excluding London median annual salary £51,564 £50,000 £55,000
% change year-on-year +3.13% -9.09% +4.76%

E-Commerce
Job Vacancy Trend

Job postings citing E-Commerce as a proportion of all IT jobs advertised.
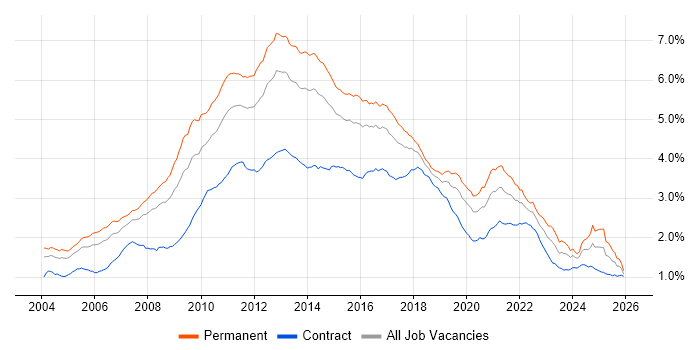
Job vacancy trend for E-Commerce in the UK

E-Commerce
Salary Trend

3-month moving average salary quoted in jobs citing E-Commerce.

Salary trend for E-Commerce in the UK

E-Commerce
Salary Histogram

Salary distribution for jobs citing E-Commerce over the 6 months to 31 May 2025.

Salary histogram for E-Commerce in the UK

E-Commerce
Top 17 Job Locations

The table below looks at the demand and provides a guide to the median salaries quoted in IT jobs citing E-Commerce within the UK over the 6 months to 31 May 2025. The 'Rank Change' column provides an indication of the change in demand within each location based on the same 6 month period last year.

Location Rank Change
on Same Period
Last Year
Matching
Permanent
IT Job Ads
Median Salary
Past 6 Months
Median Salary
% Change
on Same Period
Last Year
Live
Jobs
England -50 778 £52,500 +5.00% 1,611
UK excluding London -51 544 £47,500 +5.56% 718
Work from Home -42 344 £50,000 -9.09% 774
London +12 264 £65,000 -7.14% 943
South East +7 178 £50,000 +5.26% 140
North of England -87 132 £47,500 +5.56% 285
North West -94 82 £50,000 +11.11% 192
Midlands -51 80 £46,250 +2.78% 143
East of England -45 59 £45,000 -10.00% 49
South West +14 57 £60,000 +26.32% 52
East Midlands -19 41 £42,500 +13.33% 61
West Midlands -22 38 £50,000 +5.26% 81
Yorkshire -9 37 £43,542 -3.24% 66
Scotland +141 28 £40,000 -23.81% 12
North East +27 13 £55,000 +12.82% 32
Wales +34 9 £29,500 -18.06% 15
Northern Ireland +20 1 £85,000 +88.89% 12

E-Commerce
Co-occurring Skills and Capabilities by Category

The follow tables expand on the table above by listing co-occurrences grouped by category. The same employment type, locality and period is covered with up to 20 co-occurrences shown in each of the following categories:

Application Platforms
1 78 (9.18%) CMS
2 40 (4.71%) WordPress
3 18 (2.12%) SharePoint
4 14 (1.65%) Headless CMS
5 13 (1.53%) Confluence
5 13 (1.53%) nginx
6 8 (0.94%) Apache Solr
7 7 (0.82%) IIS
7 7 (0.82%) Kentico
7 7 (0.82%) Microsoft Exchange
8 5 (0.59%) IBM Domino
9 4 (0.47%) Apache Spark
9 4 (0.47%) Drupal
9 4 (0.47%) EPiServer
9 4 (0.47%) Strapi
10 3 (0.35%) Apache Airflow
10 3 (0.35%) Umbraco
11 2 (0.24%) Apache
11 2 (0.24%) CoreMedia CMS
11 2 (0.24%) Sitecore CMS
Applications
1 49 (5.76%) Microsoft Excel
2 28 (3.29%) Microsoft Office
3 25 (2.94%) Photoshop
4 13 (1.53%) Adobe Creative Suite
4 13 (1.53%) Adobe Illustrator
5 10 (1.18%) InDesign
6 9 (1.06%) Microsoft PowerPoint
7 8 (0.94%) Adobe XD
8 4 (0.47%) Chatbot
9 2 (0.24%) SPSS
10 1 (0.12%) Adobe After Effects
10 1 (0.12%) Microsoft Project
10 1 (0.12%) Sketch
10 1 (0.12%) Spreadsheet
10 1 (0.12%) Trello
Business Applications
1 83 (9.76%) Shopify
2 58 (6.82%) Magento
3 25 (2.94%) Payment Gateway
4 22 (2.59%) NetSuite
5 15 (1.76%) Sage 200
6 13 (1.53%) Dynamics CRM
6 13 (1.53%) Sage 50
7 6 (0.71%) Dynamics AX
8 5 (0.59%) SAP S/4HANA
9 4 (0.47%) Dynamics NAV
9 4 (0.47%) SAP Business One
10 2 (0.24%) Adobe Campaign
10 2 (0.24%) Sage 1000
10 2 (0.24%) SAP Hybris
11 1 (0.12%) Oracle Applications
11 1 (0.12%) SAP MM
11 1 (0.12%) SAP SD
Cloud Services
1 119 (14.00%) AWS
2 70 (8.24%) Azure
3 65 (7.65%) GCP
4 63 (7.41%) Google Analytics
5 49 (5.76%) Power Platform
6 41 (4.82%) SaaS
7 30 (3.53%) GitHub
8 29 (3.41%) BigCommerce
8 29 (3.41%) Google Ads
9 22 (2.59%) Salesforce Commerce Cloud
10 21 (2.47%) Facebook Ads
10 21 (2.47%) Salesforce Sales Cloud
11 18 (2.12%) Dynamics 365
12 17 (2.00%) Serverless
13 15 (1.76%) Figma
14 12 (1.41%) Azure DevOps
15 11 (1.29%) Amazon Ads
15 11 (1.29%) Stripe
16 10 (1.18%) Cloud Computing
17 9 (1.06%) Zapier
Communications & Networking
1 18 (2.12%) WAN
2 16 (1.88%) Network Security
3 15 (1.76%) LAN
3 15 (1.76%) VoIP
4 12 (1.41%) Internet
5 9 (1.06%) DNS
6 8 (0.94%) HTTPS
6 8 (0.94%) IPsec
6 8 (0.94%) TCP/IP
7 5 (0.59%) Wireless
8 3 (0.35%) Firewall
9 2 (0.24%) SMS
9 2 (0.24%) SMTP
9 2 (0.24%) SSL
10 1 (0.12%) Broadband
10 1 (0.12%) FTP
10 1 (0.12%) HTTP
Database & Business Intelligence
1 113 (13.29%) MySQL
2 44 (5.18%) Power BI
3 39 (4.59%) SQL Server
4 26 (3.06%) NoSQL
5 18 (2.12%) Tableau
6 17 (2.00%) Data Warehouse
7 14 (1.65%) Looker
8 12 (1.41%) PostgreSQL
9 8 (0.94%) Couchbase
9 8 (0.94%) SQL Server Integration Services
9 8 (0.94%) SQL Server Reporting Services
10 6 (0.71%) BigQuery
11 5 (0.59%) Elasticsearch
12 4 (0.47%) Cloud Spanner
12 4 (0.47%) MongoDB
12 4 (0.47%) Relational Database
13 3 (0.35%) SAP HANA
14 2 (0.24%) Azure SQL Database
14 2 (0.24%) Data Lake
14 2 (0.24%) Redis
Development Applications
1 112 (13.18%) Git
2 31 (3.65%) JIRA
3 22 (2.59%) Visual Studio
4 21 (2.47%) Jenkins
5 13 (1.53%) Bazaar
6 9 (1.06%) Appium
7 7 (0.82%) JUnit
7 7 (0.82%) PHPUnit
7 7 (0.82%) Selenium
8 6 (0.71%) GitLab
8 6 (0.71%) Vite
9 5 (0.59%) Cucumber
9 5 (0.59%) Jasmine
9 5 (0.59%) Karma Test Runner
9 5 (0.59%) webpack
10 4 (0.47%) JMeter
10 4 (0.47%) Postman
10 4 (0.47%) TestNG
11 2 (0.24%) Bitbucket
11 2 (0.24%) git-flow
General
1 323 (38.00%) Social Skills
2 275 (32.35%) Marketing
3 227 (26.71%) Retail
4 154 (18.12%) Finance
5 153 (18.00%) Analytical Skills
6 60 (7.06%) Games
7 59 (6.94%) Advertising
8 50 (5.88%) Law
9 48 (5.65%) Organisational Skills
10 43 (5.06%) Manufacturing
11 30 (3.53%) Inclusion and Diversity
12 24 (2.82%) Legal
13 23 (2.71%) Presentation Skills
14 12 (1.41%) Brand Awareness
14 12 (1.41%) Influencing Skills
15 9 (1.06%) Documentation Skills
16 7 (0.82%) Banking
17 6 (0.71%) Telecoms
18 4 (0.47%) French Language
18 4 (0.47%) Mandarin Language
Job Titles
1 232 (27.29%) Developer
2 137 (16.12%) Senior
3 68 (8.00%) Lead
4 62 (7.29%) .NET Developer
5 58 (6.82%) E-Commerce Manager
6 57 (6.71%) Architect
7 53 (6.24%) Senior Developer
8 45 (5.29%) PHP Developer
9 42 (4.94%) Analyst
10 37 (4.35%) Software Engineer
11 36 (4.24%) C# Developer
11 36 (4.24%) Senior Manager
12 34 (4.00%) Front-End Developer (Client-Side Developer)
13 31 (3.65%) Full-Stack Developer
14 30 (3.53%) C# .NET Developer
15 29 (3.41%) Solutions Architect
16 28 (3.29%) Lead Developer
17 27 (3.18%) Senior PHP Developer
18 23 (2.71%) E-Commerce Executive
18 23 (2.71%) Salesforce Architect
Libraries, Frameworks & Software Standards
1 185 (21.76%) HTML
2 181 (21.29%) CSS
3 95 (11.18%) .NET
4 71 (8.35%) Laravel
5 55 (6.47%) LAMP
6 53 (6.24%) React
7 36 (4.24%) REST
8 33 (3.88%) HTML5
8 33 (3.88%) Node.js
9 31 (3.65%) jQuery
9 31 (3.65%) SOAP
10 27 (3.18%) .NET Core
10 27 (3.18%) RESTful
11 26 (3.06%) React Native
11 26 (3.06%) Web Services
12 24 (2.82%) ASP.NET
12 24 (2.82%) Middleware
13 23 (2.71%) XML
14 22 (2.59%) Vue
15 21 (2.47%) Lightning Web Components
Miscellaneous
1 71 (8.35%) Mobile App
2 51 (6.00%) Social Media
3 30 (3.53%) Product Ownership
4 28 (3.29%) EPoS
5 24 (2.82%) Enterprise Software
6 21 (2.47%) Driving Licence
7 17 (2.00%) Client/Server
7 17 (2.00%) Greenfield Project
8 16 (1.88%) Cloud Native
9 15 (1.76%) Analytical Mindset
10 13 (1.53%) Virtual Team
11 12 (1.41%) Onboarding
12 10 (1.18%) Digital Media
13 9 (1.06%) Graphic Design
14 8 (0.94%) Self-Motivation
15 7 (0.82%) Algorithms
15 7 (0.82%) Learning Management System
16 6 (0.71%) Multi-touch
17 5 (0.59%) Distributed Systems
17 5 (0.59%) Team-Oriented Environment
Operating Systems
1 20 (2.35%) Linux
2 16 (1.88%) Android
3 13 (1.53%) Apple iOS
4 9 (1.06%) Windows
5 3 (0.35%) Windows Server
6 2 (0.24%) Unix
Processes & Methodologies
1 198 (23.29%) Problem-Solving
2 164 (19.29%) Analytics
3 153 (18.00%) Agile
4 132 (15.53%) User Experience
5 123 (14.47%) SEO
6 114 (13.41%) Web Development
7 110 (12.94%) Software Engineering
8 106 (12.47%) DevOps
9 100 (11.76%) CRM
10 87 (10.24%) Project Management
11 84 (9.88%) B2B
12 83 (9.76%) Digital Marketing
13 79 (9.29%) CI/CD
14 76 (8.94%) Roadmaps
15 73 (8.59%) Computer Science
16 70 (8.24%) OOP
17 69 (8.12%) ERP
18 67 (7.88%) UX Design
19 65 (7.65%) Continuous Improvement
19 65 (7.65%) MVC
Programming Languages
1 203 (23.88%) JavaScript
2 146 (17.18%) PHP
3 114 (13.41%) SQL
4 104 (12.24%) C#
5 67 (7.88%) Python
6 38 (4.47%) Java
7 27 (3.18%) TypeScript
8 23 (2.71%) Apex Code
9 8 (0.94%) Delphi
10 7 (0.82%) Go
11 5 (0.59%) C++
12 4 (0.47%) T-SQL
12 4 (0.47%) VBA
13 3 (0.35%) C
13 3 (0.35%) PowerShell
13 3 (0.35%) R
13 3 (0.35%) Ruby
13 3 (0.35%) Scala
13 3 (0.35%) VB.NET
14 2 (0.24%) Rust
Qualifications
1 148 (17.41%) Degree
2 67 (7.88%) Computer Science Degree
3 29 (3.41%) Master's Degree
4 8 (0.94%) DBS Check
5 6 (0.71%) ISTQB
5 6 (0.71%) PMI Certification
6 5 (0.59%) Azure Certification
6 5 (0.59%) ITIL Certification
7 4 (0.47%) ACCA
7 4 (0.47%) PMP
8 3 (0.35%) CISM
8 3 (0.35%) CISSP
8 3 (0.35%) Tableau Certification
9 2 (0.24%) CBAP
9 2 (0.24%) CIMA
9 2 (0.24%) CISA
9 2 (0.24%) Microsoft Certification
9 2 (0.24%) MOS
9 2 (0.24%) NVQ Level 3
9 2 (0.24%) PCI QSA
Quality Assurance & Compliance
1 63 (7.41%) QA
2 34 (4.00%) Accessibility
3 30 (3.53%) Data Quality
4 17 (2.00%) GDPR
5 10 (1.18%) PCI DSS
5 10 (1.18%) WCAG
6 4 (0.47%) Actionable Recommendations
6 4 (0.47%) SLA
7 3 (0.35%) ISO/IEC 27001
8 2 (0.24%) GRC
8 2 (0.24%) ISO/IEC 27002 (supersedes ISO/IEC 17799)
8 2 (0.24%) PMO
9 1 (0.12%) Cyber Essentials
9 1 (0.12%) ISO 9001
9 1 (0.12%) NIST
System Software
1 33 (3.88%) Docker
2 3 (0.35%) Samba
3 2 (0.24%) Squid
4 1 (0.12%) Firmware
4 1 (0.12%) Varnish
Systems Management
1 24 (2.82%) Kubernetes
1 24 (2.82%) Terraform
2 9 (1.06%) Ansible
3 3 (0.35%) Grafana
4 2 (0.24%) Kibana
5 1 (0.12%) Prometheus
Vendors
1 122 (14.35%) Google
2 106 (12.47%) Microsoft
3 62 (7.29%) Salesforce
4 56 (6.59%) Adobe
5 29 (3.41%) Facebook
6 28 (3.29%) TikTok
6 28 (3.29%) WooCommerce
7 25 (2.94%) Salesforce Marketing Cloud
8 22 (2.59%) Instagram
9 18 (2.12%) SAP
10 17 (2.00%) Sage
11 16 (1.88%) Twitter
12 13 (1.53%) ATG
12 13 (1.53%) New Relic
12 13 (1.53%) Pinterest
13 10 (1.18%) Hotjar
14 9 (1.06%) HubSpot
15 8 (0.94%) Ahrefs
15 8 (0.94%) Screaming Frog
16 7 (0.82%) Criteo