PRINCE 2
UK

The following table provides summary statistics for permanent job vacancies with a requirement for PRINCE2 skills. Included is a benchmarking guide to the salaries offered in vacancies that have cited PRINCE2 over the 6 months to 4 December 2023 with a comparison to the same period in the previous 2 years.

6 months to
4 Dec 2023
Same period 2022 Same period 2021
Rank 190 184 213
Rank change year-on-year -6 +29 +52
Permanent jobs citing PRINCE2 998 2,576 2,306
As % of all permanent jobs advertised in the UK 1.87% 2.08% 1.80%
As % of the Processes & Methodologies category 1.99% 2.17% 1.88%
Number of salaries quoted 803 1,827 1,869
10th Percentile £42,500 £39,750 £37,500
25th Percentile £50,000 £46,250 £43,750
Median annual salary (50th Percentile) £60,000 £55,000 £55,000
Median % change year-on-year +9.09% - +10.00%
75th Percentile £67,500 £71,250 £68,750
90th Percentile £84,750 £81,250 £80,000
UK excluding London median annual salary £58,000 £52,500 £50,500
% change year-on-year +10.48% +3.96% +5.76%

All Process and Methodology Skills
UK

PRINCE2 is in the Processes and Methodologies category. The following table is for comparison with the above and provides summary statistics for all permanent job vacancies with a requirement for process or methodology skills.

Permanent vacancies with a requirement for process or methodology skills 50,088 118,671 122,416
As % of all permanent jobs advertised in the UK 94.09% 95.74% 95.45%
Number of salaries quoted 36,209 72,079 81,851
10th Percentile £32,500 £34,492 £32,500
25th Percentile £43,750 £45,000 £42,500
Median annual salary (50th Percentile) £60,000 £60,000 £60,000
Median % change year-on-year - - +9.09%
75th Percentile £80,000 £82,000 £77,500
90th Percentile £99,025 £100,000 £95,000
UK excluding London median annual salary £52,500 £53,219 £50,000
% change year-on-year -1.35% +6.44% +4.17%

PRINCE2
Job Vacancy Trend

Job postings citing PRINCE2 as a proportion of all IT jobs advertised.
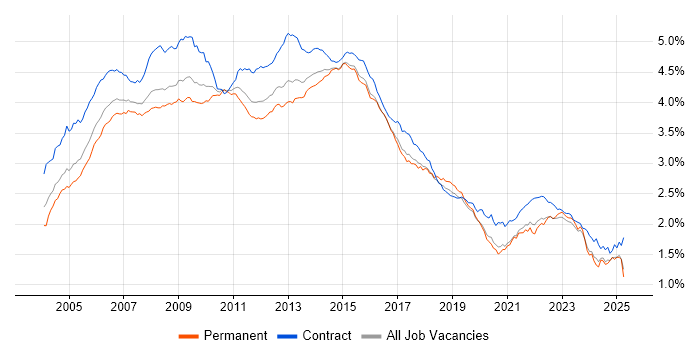
Job vacancy trend for PRINCE2 in the UK

PRINCE2
Salary Trend

3-month moving average salary quoted in jobs citing PRINCE2.

Salary trend for PRINCE2 in the UK

PRINCE2
Salary Histogram

Salary distribution for jobs citing PRINCE2 over the 6 months to 4 December 2023.

Salary histogram for PRINCE2 in the UK

PRINCE2
Top 17 Job Locations

The table below looks at the demand and provides a guide to the median salaries quoted in IT jobs citing PRINCE2 within the UK over the 6 months to 4 December 2023. The 'Rank Change' column provides an indication of the change in demand within each location based on the same 6 month period last year.

Location Rank Change
on Same Period
Last Year
Matching
Permanent
IT Job Ads
Median Salary
Past 6 Months
Median Salary
% Change
on Same Period
Last Year
Live
Jobs
England -6 892 £60,000 +9.09% 400
UK excluding London -3 651 £58,000 +10.48% 300
Work from Home -25 410 £57,500 +4.55% 175
London +2 293 £70,000 +10.24% 117
South East -17 161 £55,000 +5.26% 64
North of England -10 131 £60,000 +14.29% 66
South West +46 111 £55,000 +10.00% 47
Midlands +16 107 £57,500 +9.52% 56
West Midlands +54 78 £57,500 +9.52% 40
East of England +69 67 £60,000 +9.09% 35
Yorkshire +7 59 £55,000 +4.76% 16
North West -8 55 £60,000 +9.09% 42
Scotland +54 42 £55,000 +10.00% 26
East Midlands -7 26 £60,000 +20.00% 15
Wales -14 23 £55,000 +7.66% 9
North East +51 17 £53,750 +7.50% 8
Northern Ireland +40 9 £57,500 +53.33% 5

PRINCE2
Co-occurring Skills and Capabilities by Category

The follow tables expand on the table above by listing co-occurrences grouped by category. The same employment type, locality and period is covered with up to 20 co-occurrences shown in each of the following categories:

Application Platforms
1 39 (3.91%) SharePoint
2 20 (2.00%) MS Exchange
3 17 (1.70%) Confluence
4 4 (0.40%) Exchange Server 2010
5 2 (0.20%) Alfresco
5 2 (0.20%) Captiva
5 2 (0.20%) Documentum
6 1 (0.10%) CMS
6 1 (0.10%) Exchange Server 2003
6 1 (0.10%) Exchange Server 2007
6 1 (0.10%) Exchange Server 2013
6 1 (0.10%) SAS
6 1 (0.10%) Skype for Business
6 1 (0.10%) Umbraco
Applications
1 88 (8.82%) Microsoft Project
2 77 (7.72%) Microsoft Office
3 69 (6.91%) Microsoft Excel
4 38 (3.81%) Microsoft PowerPoint
5 24 (2.40%) MS Visio
6 4 (0.40%) Trello
7 1 (0.10%) Oracle Smart View
7 1 (0.10%) SPSS
Business Applications
1 17 (1.70%) SAP S/4HANA
2 14 (1.40%) Dynamics CRM
3 9 (0.90%) SAP CO
3 9 (0.90%) SAP FI
3 9 (0.90%) SAP FI/CO
4 8 (0.80%) Primavera
4 8 (0.80%) SAP ERP
5 3 (0.30%) Remedy ITSM
5 3 (0.30%) SAP BPC
5 3 (0.30%) SAP Oil and Gas
5 3 (0.30%) Shopify
6 2 (0.20%) Cerner Millennium
6 2 (0.20%) Dynamics GP
6 2 (0.20%) ScheduALL
7 1 (0.10%) Dynamics AX
7 1 (0.10%) NetSuite
7 1 (0.10%) Oracle Payables
7 1 (0.10%) SAP GRC
7 1 (0.10%) SAP SRM
7 1 (0.10%) Temenos T24
Cloud Services
1 71 (7.11%) Microsoft 365
2 70 (7.01%) Azure
3 37 (3.71%) Power Platform
4 19 (1.90%) Dynamics 365
5 17 (1.70%) SaaS
6 13 (1.30%) Azure DevOps
6 13 (1.30%) Power Automate
7 12 (1.20%) AWS
7 12 (1.20%) PowerApps
8 8 (0.80%) Cloud Computing
9 6 (0.60%) IaaS
9 6 (0.60%) Mimecast
10 5 (0.50%) PaaS
11 4 (0.40%) Entra ID
12 3 (0.30%) Azure Sentinel
12 3 (0.30%) Smartsheet
12 3 (0.30%) WhatsApp
13 2 (0.20%) Azure Logic Apps
13 2 (0.20%) GCP
14 1 (0.10%) SuccessFactors
Communications & Networking
1 34 (3.41%) WAN
2 31 (3.11%) LAN
3 23 (2.30%) Firewall
4 21 (2.10%) Wi-Fi
5 14 (1.40%) VLAN
5 14 (1.40%) VPN
6 13 (1.30%) DNS
6 13 (1.30%) SAN
7 12 (1.20%) WLAN
8 10 (1.00%) NAS
9 9 (0.90%) Fibre Channel
9 9 (0.90%) iSCSI
9 9 (0.90%) MPLS
9 9 (0.90%) SD-WAN
9 9 (0.90%) TCP/IP
10 8 (0.80%) DHCP
10 8 (0.80%) Network Security
11 7 (0.70%) Remote Desktop
12 5 (0.50%) 5G
13 4 (0.40%) Intrusion Detection
Database & Business Intelligence
1 26 (2.61%) Power BI
2 15 (1.50%) SQL Server
3 6 (0.60%) SQL Server Integration Services
4 5 (0.50%) Electronic Patient Records
4 5 (0.50%) Relational Database
5 4 (0.40%) RDBMS
6 3 (0.30%) Data Warehouse
6 3 (0.30%) DTS
7 2 (0.20%) EDMS
7 2 (0.20%) Oracle Reports
7 2 (0.20%) SAP BW
7 2 (0.20%) SAP HANA
7 2 (0.20%) SQL Server Reporting Services
8 1 (0.10%) Amazon RDS
8 1 (0.10%) Enterprise Data Warehouse
8 1 (0.10%) Oracle BI Publisher
8 1 (0.10%) Power Query
8 1 (0.10%) Qlik Sense
8 1 (0.10%) SAS EBI
8 1 (0.10%) Semantic Layer
Development Applications
1 43 (4.31%) JIRA
2 6 (0.60%) RequisitePro
3 4 (0.40%) Team Foundation Server
4 1 (0.10%) Cucumber
4 1 (0.10%) GitLab
4 1 (0.10%) JMeter
4 1 (0.10%) JUnit
4 1 (0.10%) Rational DOORS
4 1 (0.10%) Rational Rhapsody
4 1 (0.10%) REST Assured
4 1 (0.10%) SQL Server Management Studio (SSMS)
4 1 (0.10%) Visual Studio
General
1 369 (36.97%) Finance
2 341 (34.17%) Social Skills
3 155 (15.53%) Public Sector
4 103 (10.32%) Analytical Skills
5 102 (10.22%) Organisational Skills
6 83 (8.32%) Manufacturing
7 62 (6.21%) Legal
8 53 (5.31%) Retail
9 46 (4.61%) Telecoms
10 44 (4.41%) Presentation Skills
11 40 (4.01%) Marketing
12 33 (3.31%) Influencing Skills
13 32 (3.21%) Electronics
14 25 (2.51%) Banking
15 21 (2.10%) Law
16 20 (2.00%) Documentation Skills
16 20 (2.00%) Inclusion and Diversity
17 16 (1.60%) Back Office
18 12 (1.20%) Police
19 11 (1.10%) Aerospace
Job Titles
1 578 (57.92%) Project Manager
2 217 (21.74%) Senior
3 189 (18.94%) Senior Manager
4 175 (17.54%) Senior Project Manager
5 136 (13.63%) IT Manager
6 117 (11.72%) IT Project Manager
7 77 (7.72%) Analyst
8 63 (6.31%) Infrastructure Manager
9 55 (5.51%) Infrastructure Project Manager
10 41 (4.11%) Lead
11 39 (3.91%) Programme Manager
12 38 (3.81%) Business Analyst
13 30 (3.01%) ServiceNow Manager
13 30 (3.01%) ServiceNow Project Manager
14 27 (2.71%) Delivery Manager
15 25 (2.51%) Software Project Manager
16 23 (2.30%) PMO Manager
16 23 (2.30%) PRINCE2 Project Manager
16 23 (2.30%) Service Manager
17 21 (2.10%) Infrastructure Engineer
Libraries, Frameworks & Software Standards
1 8 (0.80%) ADO
2 6 (0.60%) .NET
3 5 (0.50%) EDI
4 4 (0.40%) .NET Framework
4 4 (0.40%) Velocity
4 4 (0.40%) WCF
4 4 (0.40%) Web Services
5 2 (0.20%) CSS
5 2 (0.20%) FHIR
6 1 (0.10%) ASP.NET Web API
6 1 (0.10%) HTML
6 1 (0.10%) Leaflet
6 1 (0.10%) Middleware
6 1 (0.10%) React
6 1 (0.10%) Series 60
6 1 (0.10%) Spring
6 1 (0.10%) Spring Boot
Miscellaneous
1 157 (15.73%) Management Information System
2 111 (11.12%) Virtual Team
3 57 (5.71%) PMI
4 37 (3.71%) Self-Motivation
5 34 (3.41%) Driving Licence
6 27 (2.71%) Product Ownership
7 21 (2.10%) Data Centre
8 16 (1.60%) NHS
9 13 (1.30%) Onboarding
10 10 (1.00%) Legacy Systems
11 8 (0.80%) Enterprise Software
12 7 (0.70%) FMCG
13 6 (0.60%) Public Cloud
14 5 (0.50%) Video Conferencing
15 4 (0.40%) Greenfield Project
16 3 (0.30%) Analytical Mindset
16 3 (0.30%) CCTV
16 3 (0.30%) CESG
16 3 (0.30%) Foreign Exchange (FX)
16 3 (0.30%) Tandem
Operating Systems
1 56 (5.61%) Windows
2 13 (1.30%) Windows Server
3 8 (0.80%) Linux
4 7 (0.70%) Windows 10
5 6 (0.60%) Android
6 5 (0.50%) Windows Server 2008
6 5 (0.50%) Windows Server 2016
6 5 (0.50%) Windows Server 2019
7 4 (0.40%) Windows Server 2012
8 2 (0.20%) VMS
9 1 (0.10%) Apple iOS
9 1 (0.10%) Mac OS
9 1 (0.10%) Windows 2000 Server
9 1 (0.10%) Windows Server 2003
Processes & Methodologies
1 730 (73.15%) Project Management
2 434 (43.49%) Agile
3 396 (39.68%) Project Delivery
4 229 (22.95%) Stakeholder Management
5 197 (19.74%) ITIL
6 191 (19.14%) Scrum
7 171 (17.13%) Computer Science
8 169 (16.93%) ERP
9 150 (15.03%) Migration
10 148 (14.83%) Waterfall
11 146 (14.63%) Problem-Solving
12 143 (14.33%) SDLC
13 134 (13.43%) Programme Management
14 127 (12.73%) Change Management
15 108 (10.82%) Budget Management
16 91 (9.12%) Business Case
17 90 (9.02%) Business Analysis
18 89 (8.92%) Continuous Improvement
19 73 (7.31%) Customer Service
20 67 (6.71%) Roadmaps
Programming Languages
1 26 (2.61%) SQL
2 15 (1.50%) PowerShell
3 12 (1.20%) JavaScript
4 9 (0.90%) Python
5 8 (0.80%) C#
5 8 (0.80%) Java
6 7 (0.70%) C++
7 5 (0.50%) PL/SQL
7 5 (0.50%) T-SQL
8 3 (0.30%) Kusto Query Language
9 1 (0.10%) ABAP
9 1 (0.10%) C
9 1 (0.10%) VB
9 1 (0.10%) VBA
9 1 (0.10%) VBScript
Qualifications
1 337 (33.77%) Degree
2 164 (16.43%) PMI Certification
3 160 (16.03%) PMP
4 148 (14.83%) Computer Science Degree
5 111 (11.12%) Security Cleared
6 87 (8.72%) SC Cleared
7 86 (8.62%) PRINCE2 Practitioner
8 84 (8.42%) PRINCE2 Certification
9 35 (3.51%) APMP
10 24 (2.40%) BPSS Clearance
10 24 (2.40%) DBS Check
10 24 (2.40%) ITIL Certification
11 21 (2.10%) Microsoft Certification
12 16 (1.60%) DV Cleared
12 16 (1.60%) HNC
13 15 (1.50%) MCSE
14 10 (1.00%) Azure Certification
15 9 (0.90%) Six Sigma Black Belt
16 8 (0.80%) Cisco Certification
17 7 (0.70%) ISEB
Quality Assurance & Compliance
1 125 (12.53%) PMO
2 44 (4.41%) QA
3 12 (1.20%) SLA
4 11 (1.10%) GDPR
5 10 (1.00%) COBIT
5 10 (1.00%) Cyber Essentials
5 10 (1.00%) ISO 9001
5 10 (1.00%) ISO/IEC 27001
5 10 (1.00%) P3O
6 6 (0.60%) Data Quality
6 6 (0.60%) GRC
7 3 (0.30%) PCI DSS
8 2 (0.20%) Cyber Essentials PLUS
8 2 (0.20%) HL7
8 2 (0.20%) NIST
9 1 (0.10%) Government Security Classifications
9 1 (0.10%) ISO/IEC 20000
9 1 (0.10%) ISO/IEC 27002 (supersedes ISO/IEC 17799)
9 1 (0.10%) NEBOSH
9 1 (0.10%) PMBOK
System Software
1 47 (4.71%) Active Directory
2 19 (1.90%) VMware Infrastructure
3 9 (0.90%) Terminal Server
4 6 (0.60%) Hyper-V
5 4 (0.40%) VMware ESXi
5 4 (0.40%) XenApp
6 3 (0.30%) Docker
7 2 (0.20%) BitLocker
7 2 (0.20%) Firmware
8 1 (0.10%) Virtual Desktop
8 1 (0.10%) VMware NSX
8 1 (0.10%) vSphere
Systems Management
1 15 (1.50%) Microsoft Intune
2 6 (0.60%) HP Quality Center
3 4 (0.40%) WSUS
4 2 (0.20%) SCCM
4 2 (0.20%) SCOM
5 1 (0.10%) Kubernetes
5 1 (0.10%) Puppet
5 1 (0.10%) Single Sign-On
Vendors
1 188 (18.84%) Microsoft
2 123 (12.32%) Salesforce
3 120 (12.02%) NEC
4 77 (7.72%) SAP
5 42 (4.21%) ServiceNow
6 25 (2.51%) Oracle
7 22 (2.20%) VMware
8 17 (1.70%) Cisco
9 15 (1.50%) Citrix
10 12 (1.20%) NetApp
11 11 (1.10%) HP
12 10 (1.00%) IBM
13 7 (0.70%) Siebel
14 5 (0.50%) Juniper
15 4 (0.40%) Meraki
15 4 (0.40%) Remedy
16 3 (0.30%) Aruba
16 3 (0.30%) Ruckus Wireless
16 3 (0.30%) WooCommerce
17 2 (0.20%) Aderant