Digital Transformation Programme Jobs

Digital Transformation Programmes/Projects
UK

The table below provides summary statistics for permanent job vacancies requiring Digital Transformation Programme skills. It includes a benchmarking guide to the annual salaries offered in vacancies that cited Digital Transformation Programme over the 6 months leading up to 28 May 2025, comparing them to the same period in the previous two years.

6 months to
28 May 2025
Same period 2024 Same period 2023
Rank 448 422 340
Rank change year-on-year -26 -82 +23
Permanent jobs citing Digital Transformation Programme 281 616 971
As % of all permanent jobs advertised in the UK 0.51% 0.60% 0.99%
As % of the Processes & Methodologies category 0.55% 0.72% 1.04%
Number of salaries quoted 147 425 535
10th Percentile £42,500 £37,350 £41,250
25th Percentile £49,375 £42,500 £52,500
Median annual salary (50th Percentile) £60,000 £60,000 £68,497
Median % change year-on-year - -12.40% -2.15%
75th Percentile £84,375 £75,000 £80,000
90th Percentile £95,000 £91,250 £95,000
UK excluding London median annual salary £58,750 £52,500 £62,500
% change year-on-year +11.90% -16.00% +4.17%

All Process and Methodology Skills
UK

Digital Transformation Programme falls under the Processes and Methodologies category. For comparison with the information above, the following table provides summary statistics for all permanent job vacancies requiring process or methodology skills.

Permanent vacancies with a requirement for process or methodology skills 51,242 86,144 93,565
As % of all permanent jobs advertised in the UK 93.71% 84.33% 95.55%
Number of salaries quoted 25,211 60,433 55,406
10th Percentile £29,000 £29,250 £34,000
25th Percentile £41,250 £40,000 £45,000
Median annual salary (50th Percentile) £57,500 £55,000 £61,000
Median % change year-on-year +4.55% -9.84% +1.67%
75th Percentile £75,000 £72,500 £81,250
90th Percentile £97,500 £92,500 £100,000
UK excluding London median annual salary £51,645 £50,000 £55,000
% change year-on-year +3.29% -9.09% +4.76%

Digital Transformation Programme
Job Vacancy Trend

Job postings citing Digital Transformation Programme as a proportion of all IT jobs advertised.
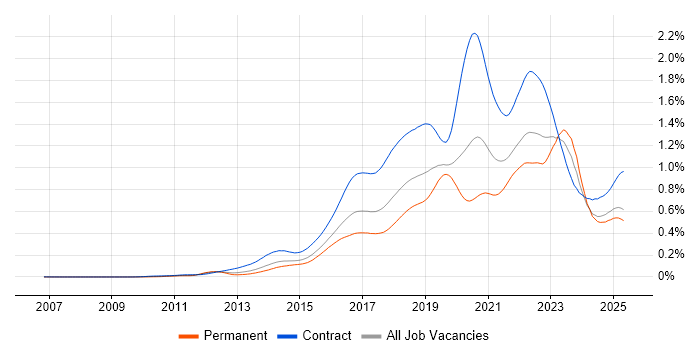
Job vacancy trend for Digital Transformation Programme in the UK

Digital Transformation Programme
Salary Trend

3-month moving average salary quoted in jobs citing Digital Transformation Programme.

Salary trend for Digital Transformation Programme in the UK

Digital Transformation Programme
Salary Histogram

Salary distribution for jobs citing Digital Transformation Programme over the 6 months to 28 May 2025.

Salary histogram for Digital Transformation Programme in the UK

Digital Transformation Programme
Top 17 Job Locations

The table below looks at the demand and provides a guide to the median salaries quoted in IT jobs citing Digital Transformation Programme within the UK over the 6 months to 28 May 2025. The 'Rank Change' column provides an indication of the change in demand within each location based on the same 6 month period last year.

Location Rank Change
on Same Period
Last Year
Matching
Permanent
IT Job Ads
Median Salary
Past 6 Months
Median Salary
% Change
on Same Period
Last Year
Live
Jobs
England -48 252 £65,000 +8.33% 1,430
UK excluding London -1 165 £58,750 +11.90% 1,346
Work from Home -56 106 £58,750 - 904
London +46 95 £90,000 +27.66% 247
South East +84 50 £60,000 - 355
Midlands +11 35 £57,500 +4.55% 260
North of England -80 25 £65,000 +13.04% 334
East of England +51 24 £52,500 +10.53% 184
West Midlands +24 21 £48,000 -21.58% 133
South West +77 15 £60,125 +20.25% 154
North West -72 13 £55,000 -10.14% 167
East Midlands +30 12 £60,000 +37.16% 111
Scotland +107 11 £49,672 +41.92% 59
Yorkshire +26 9 £67,500 +22.73% 119
Northern Ireland +34 3 £87,500 +75.00% 15
North East +27 3 £55,000 +18.33% 50
Wales +39 2 £70,000 +42.86% 37

Digital Transformation Programme
Co-occurring Skills and Capabilities by Category

The follow tables expand on the table above by listing co-occurrences grouped by category. The same employment type, locality and period is covered with up to 20 co-occurrences shown in each of the following categories:

Application Platforms
1 12 (4.27%) CMS
2 8 (2.85%) SharePoint
3 4 (1.42%) Umbraco
4 2 (0.71%) Apache Spark
4 2 (0.71%) DNN
4 2 (0.71%) Kentico
4 2 (0.71%) nginx
4 2 (0.71%) SharePoint Server
4 2 (0.71%) Sitecore CMS
4 2 (0.71%) Sitefinity
4 2 (0.71%) WordPress
5 1 (0.36%) Apache
5 1 (0.36%) Apache Airflow
5 1 (0.36%) BizTalk Server
5 1 (0.36%) Headless CMS
5 1 (0.36%) Mendix
5 1 (0.36%) Microsoft Exchange
5 1 (0.36%) OpenEdge
5 1 (0.36%) Oracle Workflow
5 1 (0.36%) WebLogic
Applications
1 24 (8.54%) Microsoft Office
2 8 (2.85%) Maya
2 8 (2.85%) Microsoft Excel
3 6 (2.14%) Microsoft Project
4 4 (1.42%) MS Visio
5 3 (1.07%) Microsoft PowerPoint
6 1 (0.36%) Trello
Business Applications
1 13 (4.63%) Dynamics CRM
2 4 (1.42%) SAP S/4HANA
2 4 (1.42%) SAP SCM
3 2 (0.71%) Sage 200
4 1 (0.36%) Dynamics AX
4 1 (0.36%) iTrent
4 1 (0.36%) Lorenzo
4 1 (0.36%) Oracle EBS
4 1 (0.36%) Oracle Payables
4 1 (0.36%) SAP CO
4 1 (0.36%) SAP FI
4 1 (0.36%) SAP FI/CO
4 1 (0.36%) Shopify
4 1 (0.36%) SystmOne
4 1 (0.36%) Visualfiles
Cloud Services
1 46 (16.37%) Azure
2 36 (12.81%) Power Platform
3 35 (12.46%) AWS
4 16 (5.69%) Dynamics 365
5 15 (5.34%) Microsoft 365
6 13 (4.63%) GCP
7 11 (3.91%) Boomi
7 11 (3.91%) Microsoft Copilot
7 11 (3.91%) SaaS
8 10 (3.56%) GitHub
9 9 (3.20%) Amazon SageMaker
9 9 (3.20%) Azure DevOps
10 8 (2.85%) Salesforce Commerce Cloud
11 7 (2.49%) Entra ID
12 6 (2.14%) Cloud Computing
13 5 (1.78%) AWS CloudFormation
13 5 (1.78%) GitHub Actions
13 5 (1.78%) PaaS
13 5 (1.78%) PowerApps
14 3 (1.07%) Snowflake
Communications & Networking
1 8 (2.85%) DNS
2 7 (2.49%) Firewall
3 6 (2.14%) DHCP
4 4 (1.42%) TCP/IP
4 4 (1.42%) VLAN
5 2 (0.71%) Network Security
6 1 (0.36%) Broadband
6 1 (0.36%) VoIP
Database & Business Intelligence
1 20 (7.12%) Power BI
2 12 (4.27%) Tableau
3 9 (3.20%) Data Lake
4 7 (2.49%) NoSQL
5 6 (2.14%) SQL Server
6 3 (1.07%) Hadoop
7 2 (0.71%) Big Data
7 2 (0.71%) BigQuery
7 2 (0.71%) DTS
7 2 (0.71%) Electronic Patient Records
7 2 (0.71%) Metadata
7 2 (0.71%) PostgreSQL
8 1 (0.36%) HBase
8 1 (0.36%) KDB
8 1 (0.36%) Oracle Database
8 1 (0.36%) Relational Database
8 1 (0.36%) SAP HANA
8 1 (0.36%) SQL Server Analysis Services
8 1 (0.36%) SQL Server Integration Services
8 1 (0.36%) SQL Server Reporting Services
Development Applications
1 6 (2.14%) Jenkins
2 4 (1.42%) JIRA
3 3 (1.07%) Git
4 2 (0.71%) Checkstyle
4 2 (0.71%) SonarQube
5 1 (0.36%) CircleCI
5 1 (0.36%) IBM UrbanCode
5 1 (0.36%) Jasmine
5 1 (0.36%) Karma Test Runner
5 1 (0.36%) Octopus Deploy
5 1 (0.36%) Protractor
5 1 (0.36%) Subversion
5 1 (0.36%) Team Foundation Server
5 1 (0.36%) TeamCity
5 1 (0.36%) Travis CI
5 1 (0.36%) Vite
General
1 101 (35.94%) Social Skills
2 82 (29.18%) Finance
3 76 (27.05%) Law
4 59 (21.00%) Analytical Skills
5 25 (8.90%) Retail
6 22 (7.83%) Marketing
7 15 (5.34%) Legal
8 14 (4.98%) Games
9 13 (4.63%) Presentation Skills
10 12 (4.27%) Manufacturing
10 12 (4.27%) Public Sector
11 11 (3.91%) Banking
12 9 (3.20%) Pharmaceutical
13 7 (2.49%) Inclusion and Diversity
14 4 (1.42%) Local Government
14 4 (1.42%) Publishing
14 4 (1.42%) Retail Banking
15 3 (1.07%) Automotive
15 3 (1.07%) Private Banking
15 3 (1.07%) Telecoms
Job Titles
1 61 (21.71%) Senior
2 55 (19.57%) Architect
3 43 (15.30%) Lead
4 39 (13.88%) Solutions Architect
5 38 (13.52%) Senior Architect
6 30 (10.68%) Senior Solutions Architect
7 28 (9.96%) ServiceNow Architect
8 25 (8.90%) Analyst
9 20 (7.12%) Project Manager
10 18 (6.41%) Developer
11 13 (4.63%) Business Analyst
12 10 (3.56%) Salesforce Architect
12 10 (3.56%) Senior Manager
13 8 (2.85%) CRM Architect
13 8 (2.85%) IT Architect
13 8 (2.85%) Senior Salesforce Architect
14 7 (2.49%) Consultant
14 7 (2.49%) Digital Transformation
14 7 (2.49%) Junior
14 7 (2.49%) Systems Manager
Libraries, Frameworks & Software Standards
1 12 (4.27%) React
2 9 (3.20%) Keras
2 9 (3.20%) NumPy
2 9 (3.20%) PyTorch
2 9 (3.20%) scikit-learn
2 9 (3.20%) TensorFlow
3 7 (2.49%) .NET
4 6 (2.14%) Node.js
5 5 (1.78%) CSS
5 5 (1.78%) Middleware
6 4 (1.42%) AngularJS
6 4 (1.42%) HTML
6 4 (1.42%) REST
6 4 (1.42%) Web Services
7 3 (1.07%) Kafka
7 3 (1.07%) RESTful
8 2 (0.71%) Blazor
8 2 (0.71%) EJB
8 2 (0.71%) MACH
8 2 (0.71%) React Native
Miscellaneous
1 13 (4.63%) Cloud Native
2 11 (3.91%) Algorithms
2 11 (3.91%) Legacy Systems
2 11 (3.91%) Product Ownership
3 9 (3.20%) Analytical Mindset
3 9 (3.20%) Enterprise Software
4 8 (2.85%) NHS
4 8 (2.85%) Self-Motivation
5 5 (1.78%) Legacy Applications
5 5 (1.78%) Microsoft Licensing
5 5 (1.78%) Operational Technology
5 5 (1.78%) Renewable Energy
6 4 (1.42%) Cloud Security Posture
6 4 (1.42%) Distributed Systems
6 4 (1.42%) Greenfield Project
6 4 (1.42%) Hybrid Cloud
6 4 (1.42%) Management Information System
6 4 (1.42%) Security Posture
7 3 (1.07%) Foreign Exchange (FX)
8 2 (0.71%) Driving Licence
Operating Systems
1 10 (3.56%) Windows
2 2 (0.71%) Linux
2 2 (0.71%) Windows Server
2 2 (0.71%) Windows Server 2016
2 2 (0.71%) Windows Server 2019
Processes & Methodologies
1 99 (35.23%) Agile
2 81 (28.83%) Project Management
3 74 (26.33%) Roadmaps
4 73 (25.98%) User Experience
5 71 (25.27%) Continuous Improvement
6 63 (22.42%) Problem-Solving
7 59 (21.00%) Artificial Intelligence
8 49 (17.44%) Computer Science
9 48 (17.08%) Stakeholder Engagement
10 45 (16.01%) Decision-Making
11 43 (15.30%) Stakeholder Management
12 42 (14.95%) Business Strategy
12 42 (14.95%) Change Management
12 42 (14.95%) Service Delivery
13 41 (14.59%) Project Delivery
14 40 (14.23%) Analytics
15 39 (13.88%) Workflow
16 32 (11.39%) Process Improvement
16 32 (11.39%) Product Strategy
16 32 (11.39%) Thought Leadership
Programming Languages
1 31 (11.03%) Python
2 19 (6.76%) SQL
3 10 (3.56%) JavaScript
4 9 (3.20%) Java
4 9 (3.20%) TypeScript
5 8 (2.85%) C#
6 6 (2.14%) Go
7 4 (1.42%) PowerShell
8 3 (1.07%) C++
9 2 (0.71%) Apex Code
9 2 (0.71%) Bash
10 1 (0.36%) ABAP
10 1 (0.36%) Bicep
10 1 (0.36%) C
10 1 (0.36%) PL/SQL
10 1 (0.36%) R
10 1 (0.36%) VBA
Qualifications
1 76 (27.05%) Degree
2 37 (13.17%) Computer Science Degree
3 27 (9.61%) PMI Certification
3 27 (9.61%) Security Cleared
4 26 (9.25%) PMP
5 20 (7.12%) SC Cleared
6 9 (3.20%) PhD
7 8 (2.85%) Azure Certification
7 8 (2.85%) Microsoft Certification
8 6 (2.14%) BPSS Clearance
9 3 (1.07%) ACCA
9 3 (1.07%) CISM
9 3 (1.07%) CISSP
9 3 (1.07%) PRINCE2 Practitioner
10 2 (0.71%) AWS Certification
10 2 (0.71%) AWS Certified Solutions Architect
10 2 (0.71%) CBAP
10 2 (0.71%) CESG Certified Professional
10 2 (0.71%) ISO 27001 Lead Auditor
10 2 (0.71%) TOGAF Certification
Quality Assurance & Compliance
1 16 (5.69%) GDPR
2 12 (4.27%) QA
3 10 (3.56%) Data Quality
3 10 (3.56%) PMO
4 6 (2.14%) ISO/IEC 27001
5 4 (1.42%) NIST
6 3 (1.07%) Def Stans
6 3 (1.07%) GRC
6 3 (1.07%) RMADS
6 3 (1.07%) Sarbanes-Oxley
7 2 (0.71%) Accessibility
7 2 (0.71%) Cyber Essentials
7 2 (0.71%) PCI DSS
7 2 (0.71%) SLA
8 1 (0.36%) COBIT
8 1 (0.36%) DICOM
8 1 (0.36%) HL7
8 1 (0.36%) SNOMED CT
8 1 (0.36%) WCAG
System Software
1 11 (3.91%) Docker
2 8 (2.85%) Active Directory
3 2 (0.71%) Hyper-V
4 1 (0.36%) HDFS
Systems Management
1 12 (4.27%) Terraform
2 11 (3.91%) Kubernetes
3 2 (0.71%) Ansible
3 2 (0.71%) Grafana
3 2 (0.71%) Microsoft Intune
4 1 (0.36%) Automic
4 1 (0.36%) Consul
4 1 (0.36%) Marathon
4 1 (0.36%) Rancher
Vendors
1 65 (23.13%) Microsoft
2 48 (17.08%) SAP
3 42 (14.95%) ServiceNow
4 36 (12.81%) Salesforce
5 19 (6.76%) Concur
5 19 (6.76%) Workday
6 12 (4.27%) Oracle
7 11 (3.91%) MuleSoft
8 8 (2.85%) Adobe
8 8 (2.85%) Dell
8 8 (2.85%) Google
9 6 (2.14%) Hitachi
10 4 (1.42%) Ariba
11 3 (1.07%) Salesforce Marketing Cloud
12 2 (0.71%) Foundry
12 2 (0.71%) Palantir
12 2 (0.71%) Sage
12 2 (0.71%) Sitecore
13 1 (0.36%) ATG
13 1 (0.36%) InterSystems